Teacher Workload
Survey 2016
Technical report
February 2017
John Higton, Sarah Leonardi, Neil Richards and Arifa
Choudhoury, CFE Research
Contents
Annex 1: Survey design
4
Background to the survey design
4
Setting a baseline describing teachers’ workload
4
Comparability with past surveys
4
Rationale for using a survey rather than a diary
5
Design timeline
8
Annex 2: Sampling
10
Design considerations
10
Comparability with TALIS and prior diaries
10
Prior diary studies
11
The practicalities of research in schools
11
Sampling approach
12
School selection probability
12
Sampling
13
Annex 3: Cognitive testing
15
Selection of schools
15
Testing process
16
Feedback from testing
16
Changes made as part of the questionnaire development phase
16
Annex 4: Final questionnaire
21
Working hours questions – TEACHER route
21
Working hours questions – HEADTEACHER route
27
Perceptions and drivers of workload
31
Annex 5: Response rates
42
School cooperation rate
42
Teachers’ response rate
43
Improving cooperation and response rates in subsequent surveys
43
Annex 6: Data processing and tabulation
45
Cleaning
45
Processing and tabulating
46
Annex 7: Weighting
48
Annex 8: Modelling the factors which impact on teacher workload
49
Introduction to multilevel models
49
Between- and within-school variance components
49
Procedure used for multilevel modelling
50
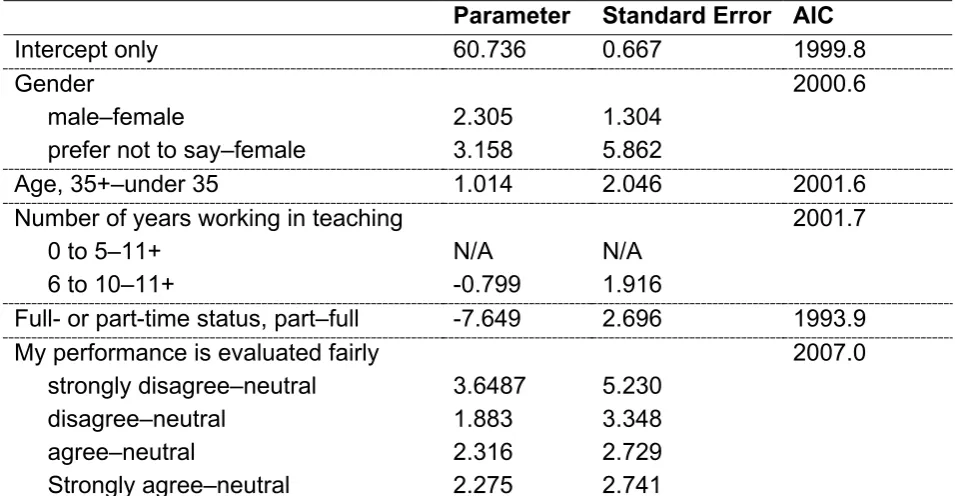
Explanatory variables evaluated as separate models
53
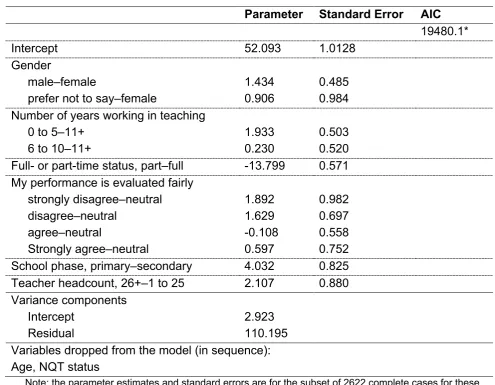
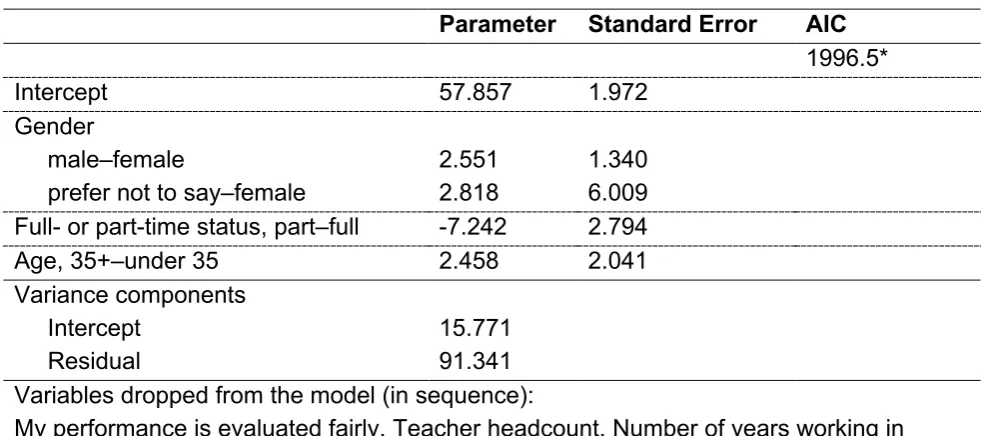
The final models of total workload
57
Contributions of the explanatory variables to fitted scores
60
Annex 1: Survey design
This section describes the survey design process for the Teacher Workload Survey. The section summarises the key design decisions and rationale for the final structure of the survey
instrument.
The survey design was led by a steering group, which was comprised of DfE staff and representation from each of the main teaching unions.
Background to the survey design
Setting a baseline describing teachers’ workload
The invitation to tender issued by DfE for this survey stated that a robust baseline measure of teachers’ workload was required for primary and secondary schools in England. Existing data either described a limited sub-set of the teacher population robustly, or collected less robust data over the whole population. As a result, it was difficult for DfE and other parties interested in teachers’ workload to draw comparative conclusions about working hours. A survey was required to address this gap, set a baseline describing workload and, in subsequent years, allow DfE to monitor changes in workload comfortable in the fact that differences between years were meaningful.
Comparability with past surveys
The Teacher Workload Survey was designed to combine elements from two other survey instruments: the Teaching and Learning International Survey (TALIS), which is administered to OECD countries, and past teacher workload diaries commissioned by DfE.
The principle challenge in the design was to achieve as close comparability with TALIS as possible whilst recognising that the level of detail on workload issues in TALIS was
limited compared to past diary studies.
Items describing workload in prior diary studies were also important to include. In particular, past diaries recorded detail on professional activities undertaken by teachers that featured within the DfE Workload Challenge. Understanding these activities in more detail and designing a study that allows DfE to confidently measure changes in the amount of time spent on these activities in the future was therefore an important design consideration.
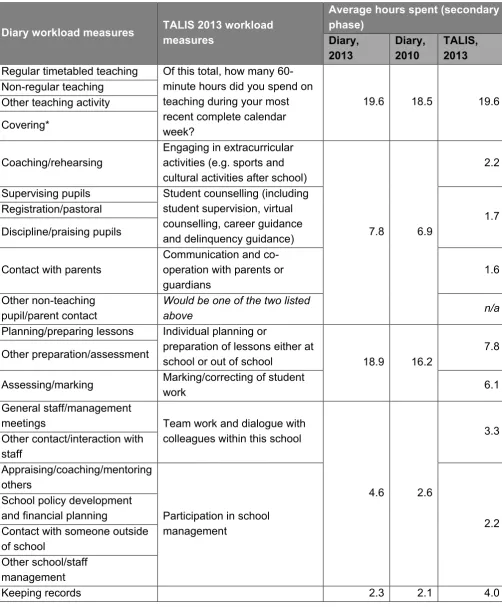
The relationship between TALIS and the diary studies is mapped in Table A1.1 at the end of this section. The relationship between individual survey items was an important consideration for the study and results in some conflicts between each. For example, TALIS records the time spent on a range of pupil guidance activities as “students counselling (including student supervision, virtual counselling, career guidance and delinquency guidance)”. The equivalent measures in prior diary studies account for a much greater slice of teachers’ time and, importantly, separate out activities that are important in an English context, such as pupil discipline. From a cognitive perspective, this item also includes use of the word student rather than the preferred noun of pupil in the English context. This is a good example of some of the wording changes made based on cognitive testing.
Rationale for using a survey rather than a diary
Past diary studies had poor response rates from teachers (TNS-BMRB, 2014). Response rates are governed by a range of factors, which were considered in the overall design of the survey instrument and its administration. These factors can be classed under categories that include:
1. Research Burden for the teacher. The last diary study asked teachers to code their time in five-minute intervals for an entire, randomly selected day within a given working week. The practicality of this approach in relation to a teacher’s working day is questionable and it was theorised that teachers would mainly complete their diaries after their working day. By nature, this would lead to some level of estimation and compare unfavourably to those completing the survey during the day.
In addition, the diary design during its last iteration was complex and used a paper-based method of data collection. Whilst a paper-based approach is appropriate for a diary, the burden for the teacher on the given collection day given the topic of the study was deemed inappropriate. Reducing the survey length is one of several standard design measures relating to response rates (see Krosnick, 1991).
problematic for the school without considerable support from the research contractor and DfE because:
• The method requires random selection of a set number of teachers. The individual within each school responsible for distributing the diary needs to apply a
consistent and potentially complex randomised approach (1-in-n selection from a random seed, Kish grid, etc.). There is a significant time commitment from the school to deliver this and to administer surveys to individually selected teachers. There is a dissonance between this time requirement, the wish to reduce burden on participating schools and the nature of the workload study.
• There is also a significant time commitment required from the contractor to deliver this approach, especially given the number of PSUs (i.e. schools) involved in the survey. This has a major cost implication, which requires a resulting and
consummate benefit to justify.
Taken together, these factors make it less likely that schools would agree to take part in a study, which has a subsequent impact on cooperation and response rates from schools. However, it is important to note that the two-stage process is a methodologically more rigorous approach to take to the study, because it corrects for the bias introduced through sampling by the size of the PSU (that teachers in larger schools are more likely to be selected to take part in the study).
3. Design and administration of paper responses. It is not possible to use validation in paper surveys. This can lead to teachers placing their own interpretation on a question and amending it to fit what they think it should say. This invalidates the response. All possible routes through a survey also need to be shown on a paper document. This means the survey itself may appear longer than it is, and lead to errors in the way an individual respondent completes the survey, including completion of incorrect questions for that individual (based on their role for example). All of these issues can be managed by a survey script and address non-response through invalid completions.
4. Requirement to post returned diaries. Once completed, diaries needed to be posted back by teachers. This introduced a further step in the process that was outside the control of the contractor. Return envelopes could be lost, diaries completed but unsent, or the perception of burden increased in the mind of the teacher.
Survey addressed this problem and made it simple for school administrators to send reminders.
6. Timing. In 2013, TALIS was administered in the weeks leading up to Easter. It was important that the workload survey replicate this timing. This led to some one-off time pressures this year due to the date of commissioning; it is assumed that subsequent workload surveys will be commissioned earlier to address this issue and allow more time for planning. However, this study also had a relatively short fieldwork window of three weeks and this duration is likely to remain fixed for two main reasons. Firstly, it will be important to at least repeat fieldwork in the same half-term of the school year. This by nature limits the fieldwork period. Secondly, it is also important that fieldwork is conducted to minimise any differences that might arise between weeks. The first and last week of a term can be atypical of others as pupils return or prepare for a school holiday. This further limits the available fieldwork time.
Design timeline
[image:8.595.61.564.165.773.2]Once all the factors above were taken into consideration, the survey was designed in January 2016 for initial testing in February 2016 (including the cognitive testing process, detailed in Annex 3: Cognitive testing).
Table A1.1: Comparison between TALIS 2013 and Teacher workload diary questions
Diary workload measures TALIS 2013 workload measures
Average hours spent (secondary phase)
Diary,
2013 Diary, 2010 TALIS, 2013 Regular timetabled teaching Of this total, how many
60-minute hours did you spend on teaching during your most recent complete calendar week?
19.6 18.5 19.6 Non-regular teaching
Other teaching activity Covering*
Coaching/rehearsing
Engaging in extracurricular activities (e.g. sports and cultural activities after school)
7.8 6.9
2.2
Supervising pupils Student counselling (including student supervision, virtual counselling, career guidance and delinquency guidance)
1.7 Registration/pastoral
Discipline/praising pupils
Contact with parents
Communication and co-operation with parents or
guardians 1.6
Other non-teaching pupil/parent contact
Would be one of the two listed
above n/a
Planning/preparing lessons Individual planning or
preparation of lessons either at
school or out of school 18.9 16.2
7.8 Other preparation/assessment
Assessing/marking Marking/correcting of student work 6.1
General staff/management
meetings Team work and dialogue with colleagues within this school
4.6 2.6
3.3 Other contact/interaction with
staff
Appraising/coaching/mentoring others
Participation in school
management 2.2
School policy development and financial planning
Contact with someone outside of school
Other school/staff management
Diary workload measures TALIS 2013 workload measures
Average hours spent (secondary phase)
Diary,
2013 Diary, 2010 TALIS, 2013 Organising resources and
premises
General administrative work (including communication, paperwork and other clerical duties you undertake in your job as a teacher)
Other kinds of administrative activities
Training or development
activity No specific measure in TALIS,
would be under “other” 1.7 3.1 2.3 Other professional
development
Non-working breaks/absences
during school hours Not collected in TALIS 0.8 0.5 n/a
Own time outside school hours
Annex 2: Sampling
Design considerations
The sampling design needed to address several competing issues:
1. Retain comparability with TALIS (2013) and, to a lesser extent, earlier diary studies;
2. Obtain a robust achieved sample of the target audience and critical sub-groups with a better response rate than the prior diary study; and
3. Do so in a cost-effective way.
Comparability with TALIS and prior diaries
TALIS used a clustered two-stage sampling method utilising a Probability Proportional to Size (PPS) approach. The two stages of PPS are traditionally:
• To stratify the primary sampling unit (PSU) firstly by some measure of size, then by other strata of interest. In this case, the PSU was the school and the measure of size was the number of teachers. In the case of English schools in TALIS, the stratification variables were by: funding type (Independent v State funded), two size bands and four regions (OECD, 2014, p.80).
• The second stage is to then randomly select the same number of participants within each selected school to take part in the study.
For English schools in TALIS in 2013, lower secondary schools were in scope (the primary and upper secondary phases were out of scope). The study achieved excellent response rates of 75% for schools and 83% for teachers (Micklewright et al, 2014, p.15). However, achieving this response rate required a significant amount of support and administrative work on behalf of the research contractors including liaison and support activity with designated in-school coordinators, the production and distribution of manuals covering the sampling approach and in-school
Prior diary studies
The last diary study was administered in 2013. It used a random sampling approach by selecting teachers to undertake the survey using the School Workforce Census (SWC1) as a sampling
frame. Theoretically, this approach removes much of the selection bias from using a two-stage clustering method. However, the response rate for the 2013 diary survey was only 15% leading to significant non-response bias, especially as there was also differential response rates by teacher subgroup (TNS-BMRB, 2014).
Paper was the only viable survey mode using SWC as the sample frame for two reasons. Firstly, SWC does not hold school email addresses for teachers and hence was unsuitable to sample and contact teachers directly for an online study. Secondly, whilst a school telephone number was recorded, it was impractical and burdensome to repeatedly call schools in order to interview individual teachers working in them.
Given these constraints and the deviation in this approach from TALIS, an adapted PPS approach more in line with the TALIS method was agreed.
The practicalities of research in schools
The TALIS technical report noted that differences in the structure of the teaching body were greater between schools than within schools (OECD, 2014). As a result, the key element of any sampling approach was to ensure that there was a representative sample of enough schools in the sample frame from which teachers could be drawn to minimise clustering effects.
A differential response from teachers was experienced in the last wave of TALIS and between roles and phases in the 2013 Teacher Workload Diary Survey. This was addressed by weighting for non-response. Weighting was an essential element of this study as the sampling method used (PPS without adjustment) delivered an unbalanced sample. The traditional second phase of a PPS method would then see a set number of teachers in the selected schools randomly sampled to account for a higher selection probability of teachers in larger schools. Weighting was,
therefore, essential to adjust for this bias, and to account for non-response from teachers.
Some support and guidance activity with schools was undertaken in the current research to maximise response rates. This included engaging with schools during the recruitment phase and providing a large amount of explanatory materials to gain support and buy-in prior to the fieldwork going live. Help from members of the DfE team was especially helpful and effective in
1 DfE state that: “The school workforce census is a statutory data collection that takes place each
autumn… [SWC] collects data on all teaching and support staff in regular employment.”
encouraging a number of schools to participate in the study. Once in field, chasing activity via email and phone to schools was undertaken and reminder emails drafted for school coordinators to send to their teaching staff.
Sampling approach
The overall sampling approach used the first stage of a Probability Proportional to Size (PPS) method to sample schools. Specifically, schools were selected by the number of teaching staff listed in the 2014 School Workforce Census (the most recent available at that time). Sampling was disproportionate by school phase. Secondary schools are larger cluster units than primary, so the design was such to ensure a large enough number of secondary clusters were present. Without oversampling, there was a significant chance of bias at the secondary school level, because too few PSUs would have been selected.
900 schools were originally sampled. 600 formed the initial sample and 300 were held in reserve. One school was removed almost immediately after drawing the initial sample (due to missing contact details listed in the SWC) and never contacted and a matched school was drawn from the reserve to replace it. All of the remaining 899 schools were eventually invited to take part via email at some point in the sampling phase. Of these, 757 were followed up using telephone methods.
School selection probability
The selection probability of the school (PSU) was calculated using the following formula:
(Population of the cluster (eligible teaching staff in school) * Number of clusters sampled) / Total population (e1)
There are two ways to conduct this calculation: 1) At the total school population level or; b) by the disproportionately stratified population i.e. for primary, then separately for secondary. Both selection probabilities were calculated.
The second stage of the PPS process usually involves randomly selecting the same number of secondary sampling units (in this case teachers) within each cluster. This means the probability of selection for each teacher within the full sample is the same. However, it was agreed that this stage would be removed for this survey for several reasons:
2. The subsequent increase in cooperation rate through simplifying administration would increase the total number of interviews achieved. Note the final number of completed questionnaires for this study was twice that of previous diary studies using the second stage method (and over three times that of the 2013 diary study).
3. Response rates per school would differ meaning non-response weighting would be
required. In the TALIS survey, thresholds were set stipulating minimum response rates and significant resource was in place to ensure these thresholds were met. The budget
required for this level of support would have been disproportionate for the workload study.
4. The variation in schools sizes (a function of the number of teachers) varies markedly by school. For example, the smallest secondary school sampled employed seven teachers and the largest 171. In the case of primary schools, teacher counts ranged from three to 53. The only way to achieve an equal selection weight by teachers would be to set a very small target per school (three) and sample far more schools. Given the time constraints and value for money, this was unrealistic. In the case of TALIS, only secondary schools were in scope, so the amount of variation in the cluster size was less. Furthermore, there was also some variation in the TALIS cluster size as “if a school had 30 teachers or less, all were sampled for convenience.” (Micklewright et al, 2014).
5. Disproportionate sampling by phase was also important. Without this, far more primary schools would have been selected than secondary. As a result, most of the secondary teacher responses would have come from a small number of schools, which may have introduced significant bias.
Rather than sample teachers in a second stage of PPS, a census was taken within the randomly selected schools instead. Whilst this addresses all the points above, it does mean that teacher responses within these randomly selected schools were self-selecting and that the sampling method does not correct for the unequal selection probabilities that result from selecting schools by the size of the teaching body. As noted in the survey design rationale (Annex 1), this design is a deviation from the ideal two-stage approach and leads to unequal selection probabilities for teachers which is subsequently corrected through weighting. This is justified by a larger achieved sample size and a much simpler process of administration for schools resulting in improvements in response rates.
Sampling
Academy Converter, Academy Special Converter, Academy Special Sponsor Led, Academy Sponsor Led, Community School, Community Special School, Foundation School, Foundation Special School, Free Schools, Free Schools Special, Studio Schools, Voluntary Aided School, Voluntary Controlled School
Any schools marked as “closed” or “proposed to open” were removed, followed by any schools specified only as “16 plus” or “Nursery” in the Phase field.
Separately, the School Workforce Census (SWC) was used to aggregate the number of teachers currently at every school, at the level of teachers, phase of education, type of establishment, GOR (region) and gender (whether the school was for boys/girls or mixed). The Local Authority Establishment (LAESTAB) number for every school served as a unique identifier to merge this information in with the master dataset.
At this point, any school, where there was no information on number of teachers per school, was given a value of the median number of teachers per school phase.
Data was then split into Primary and Secondary phases and both datasets were sorted on the number of teachers per school, followed by the phase of education, type of establishment, GOR and gender. With the datasets primarily sorted in descending order of number of teachers, an algorithm was devised to calculate the cumulative numbers and percentiles of teachers within each dataset, allowing selection of exactly 175 primary schools equally spaced throughout the primary school dataset and 125 secondary schools equally spaced throughout the dataset, for a total of 300 schools.
Annex 3: Cognitive testing
This section describes the process of cognitive testing of the Teacher Workload Survey. The cognitive testing process took place in February 2016 in advance of the live survey, which was conducted in March 2016.
Selection of schools
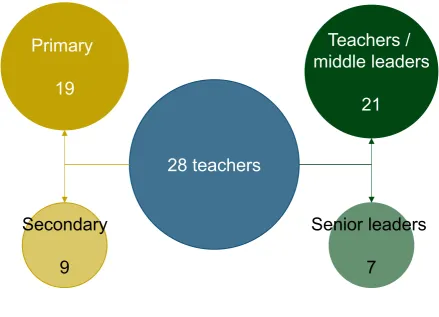
[image:15.595.72.512.395.712.2]Teachers were interviewed in ten schools for the cognitive testing who were not on the survey sample for the mainstage fieldwork. These schools were sampled by factors such as phase (primary and secondary), size and geography. As the survey design included specific questions tailored to a teacher’s role/level of responsibility, the initial discussions with each school ensured that there would be good representation of teachers across all levels (headteachers, deputy headteachers and classroom teachers) included in the testing. The testing then took place in ten schools (seven primary and three secondary) across England: four in the Midlands, two in the North East, two in the North West and one in both the South and Yorkshire. The breakdown of interviews is described in figure A3.1 below.
Figure A3.1: Sample split for cognitive testing
28 teachers
Primary
19
Secondary
9
Teachers /
middle leaders
21
Senior leaders
CFE sent a Cognitive Testing briefing document (see end of this annex) in advance of initial contact with each school. This summarised the key requirements.
Testing process
The majority of testing took place on-site. A CFE team member attended the school and spent time with the teachers. Group testing usually included between 3-4 teachers. In the case of senior leaders, these interviews comprised entirely of one-to-one interviews with headteachers. Other senior leaders (deputy headteachers) did take part in some of the group work.
CFE’s team member initially observed and recorded while the teachers completed the survey online, taking particular note of the length of time taken overall, questions which proved to be stumbling blocks, or any technical issues which prevented satisfactory completion of the survey first time. The remainder of the session was open to share thoughts on the survey and discuss any questions, in terms of wording or comprehension, which teachers felt merited further discussion. While completion of the survey usually stimulated discussion around the subject matter in general, CFE were able to moderate discussion where necessary towards relevant questions and wording within the questionnaire, so that as much relevant feedback as possible was collected and recorded.
The full structure of the cognitive testing session was detailed in a briefing document (shown at the end of this Annex). Each session took 45 minutes to 1 hour depending on the availability of teachers at each establishment, and all sessions were positive and well-received. Many schools were keen for their results to be included in the survey (which was sadly not possible as the questions changed as a result of the testing), but this was a good indication that the surveys were being answered “as live” and were highly salient to teachers.
Feedback from testing
In total, 28 teachers completed a cognitive test and provided a large amount of feedback and suggested improvements. These were collated and reviewed in order to make a series of suggested revisions to the first draft questionnaire. Below is a list of resulting changes that were made between the cognitive testing and live surveys.
Changes made as part of the questionnaire development phase
• The first draft questionnaire was too long, primarily because it included some test
• Part-time teachers particularly felt that reported hours needed to be considered alongside how long they were supposed to work. A question was added to record the number of contracted hours per week.
• Instructions were shortened and simplified where possible as they were deemed
confusing in some instances. For example, the instruction on how to record hours to the nearest half hour was revised considerably.
• Teachers spent a long time thinking about each individual listed activity and then totalled the hours to cross-reference with the total. Whilst such cross-checking is potentially desirable, it did lead teachers to spend much longer completing the survey. In addition, some questions (such as questions 6 and 7, Annex 4: Final questionnaire) were designed as sub-categories and more detailed items relating to some of the broader TALIS items such as “General Administration”. As a result, checking totals could lead to error. Further clarification and instruction was included in the survey to reassure teachers on cross-checking. Also note that the TALIS survey reports a discrepancy between the “total” hours question and the addition of the individual units. Removing the “total” question (question 2 in Annex 4: Final questionnaire) was discussed as part of the design process. However, it was agreed that this question should be retained to ensure comparability with TALIS.
• Scales of “a bit too little/too much” were changed to “too little/too much” to reflect the feedback that teachers felt this was hard to quantify.
• “Information meetings” was removed because a few participants were not clear what it referred to, and replaced with “staff meetings” which was mentioned several times.
• Some more administrative tasks were split into a separate question because of the importance of different aspects of administration in the DfE Workload Challenge2.
• Wording for some senior leader activities was revised – for example lesson planning was removed from the draft questionnaire as it was deemed part of curriculum planning for senior leaders.
• Additional training and development questions for headteachers were removed as they were thought to overlap with previous answers. The question regarding strategies for managing and planning professional time (question 13; Annex 4: Final questionnaire) was retained, but only asked to headteachers as the issue was relevant at the school-level and not for individual teachers. This allowed a reduction in the overall survey length.
2 See DfE microsite on the Workload Challenge:
• The test survey included the following questions about the use of resources. How often, if at all, do you use text books at [INSERT SCHOOL] for…?
Schemes of work; Individual lesson planning; Lesson delivery; Homework
How often, if at all, do you use teacher guides at [INSERT SCHOOL] for…?
How often, if at all, do you use online resources at [INSERT SCHOOL] for…?
Questions about the use of text books were removed as teachers felt the questions could be construed as critical of teachers’ professionalism and because of timing issues. As a result, this could have led to some teachers dropping out of the survey in response.
Similarly, the questions on use of teacher guides and online resources were removed, primarily for timing reasons, although they did also illicit similar discomfort in some cases.
• In completing grid questions on working environment (question 16, Annex 4: Final questionnaire3) and professional development (question 17, Annex 4: Final
questionnaire4) it was felt that the survey was becoming onerous. A number of options
were removed to reduce questionnaire length. These options were those which either had another item that could be used as a proxy, or that were thought to be less likely to
contribute towards perceptions of workload as they were not cited in prior evidence as problematic.
• A question about the importance of addressing workload was removed:
Taking all staffing issues in your school into consideration, how important, if at all, is it for you to address teachers’ workload?
This was deemed redundant since it was an obvious consequence of the previous question (seriousness of workload, question 19, Annex 4: Final questionnaire).
• The test survey included a satisfaction question with several aspects of teaching: How satisfied or dissatisfied are you with the following aspects of your role?
The number of hours I work;
3 Items removed:
Staff at [INSERT SCHOOL] have opportunities to contribute to strategic decisions affecting the school as a whole;
There is a mutually supportive environment between staff in the school;
Lesson observations carried out in [INSERT SCHOOL] are effective as part of professional development activity
4 Items removed:
The value society places in the teaching profession;
My own performance as a teacher / headteacher;
[TEACHER ONLY] My level of involvement in decisions that affect my work at [INSERT SCHOOL];
If I could decide again, I would still choose to work as a teacher.
For several items, no direct relationship with workload could be made by teachers and so some items were removed as having limited value. Item D (my level of involvement in decisions that affect my work at [INSERT SCHOOL]) was moved to be included with question 18 of the final survey (Annex 4: Final questionnaire).
• Two advocacy questions about how respondents speak about being a teacher or about the teaching profession also proved quite emotive:
On balance, which of the following statements comes closest to how you speak about being a teacher / about the teaching profession?
I speak positively about … without being asked;
I speak positively about … if I am asked about it;
I speak negatively about … if I am asked about it;
I speak negatively about … without being asked
The Teacher Workload Survey 2016: Cognitive testing for schools
About the Teacher Workload survey
The Government wants to remove unnecessary workload in schools so that teachers can focus on improving outcomes for pupils. A range of actions have already been implemented or are in progress. Three review groups have been set up to address the causes of unnecessary workload in relation to marking, planning and resources and data management - the three biggest issues emerging from the Workload Challenge. The actions also include a commitment to monitor teacher workload through this biennial survey starting in spring 2016. CFE Research and the Institute of Employment Relations at Warwick are delivering the 2016 Teacher Workload Survey on behalf the Department for Education.
The Steering Group advising this study includes representatives from DfE, CFE Research, the University of Warwick and the following unions: ASCL, NAHT, ATL, NUT, The Voice Union, and NASUWT. Further information about the survey can be found at our website: http://cfe.org.uk/our-work/teacher-workload-survey-2016.
What is cognitive testing and what will it involve?
Cognitive testing is an important part of this study and we are looking for schools to support this process. Cognitive testing involves a research team testing a survey that has been designed to ensure that it is working the way it should. If it doesn’t it allows us to make changes before it is launched. For example it allows us to explore if questions are being understood by everyone in the same way and if question wording is clear. It is important to get this stage of the research right to make sure that questions are accurately measuring teacher workload.
If you agree to us undertaking cognitive testing at your school we would only need a small number of teachers to take part (approximately 3-4). They would be asked to complete the Teacher Workload survey online at the start of the session. This stage should take approximately 10 minutes. After this, we would then discuss the survey with them to get their thoughts on the survey completion process and the question wording so that we can be sure each question has been understood as we intended. We want to make sure that different teachers and different schools interpret the questions in the same way. We anticipate this discussion should take no more than 45 minutes, so we would need a maximum of an hour in total.
If you agree to take part we will visit your school or another venue of your choice. You will just need to ensure that each person taking part has separate internet access in order to take the survey (this can be on computers/laptops, tablets or mobile phones if preferred).
If you be happy to take part or would like more information on this please contact the Teacher Workload Survey team on the details below.
Teacher Workload Survey Team at CFE Research
Annex 4: Final questionnaire
1) In order to provide some context for the survey, can you say which of the following best describes your main role at [INSERT SCHOOL FROM SAMPLE]?
SINGLE CODE ONLY.
Role
A
Classroom Teacher
1
B
Head of Department
2
C
Head of Year
3
D
Deputy or Assistant Head
4
E
Headteacher / Acting Headteacher
5
F
Other
(Please specify)
6
HIDDEN FIELDS
IF A TO C AND F =
TEACHER ROUTE
IF D TO E =
HEADTEACHER ROUTE
FLAG SCHOOL PHASE FROM SAMPLE: SECONDARY OR PRIMARY
*****************************
Working hours questions – TEACHER route
SHOW FOR TEACHERS
The first questions cover the activities that are most common for classroom teachers
[
INSERT IF SECONDARY
: , and heads of department and year].
ASK TEACHERS
2) In your most recent full working week, approximately how many hours did you spend in total on teaching, planning lessons, marking, covering for absence, interacting with other teachers, participating in staff meetings, pastoral care and other activities related to your job at [INSERT SCHOOL]?
Please include tasks that took place during weekends, evenings or other out-of-school
hours.
Round to the nearest half hour. As an example, three and a half hours would be
recorded as 3.5 below.
RECORD HOURS
ASK TEACHERS
3) Of this total, how many hours did you spend on teaching in your most recent full working week at [INSERT SCHOOL]?
Please only count actual teaching time.
Time spent on preparation, marking, etc. will be recorded later in the survey.
Round to the nearest half hour. As an example, three and a half hours would be recorded
as 3.5 below.
ASK TEACHERS
4) How many hours did you spend on the following activities other than teaching in your most recent full working week at [INSERT SCHOOL]?
Include activities that took place during weekends, evenings or other off classroom hours.
Please exclude all time spent teaching.
Again, round to the nearest half hour. Please record a 0 (zero) if you spent no time on a
listed activity.
RANDOMISE A TO J.
A
Individual planning or preparation of lessons either at
school or out of school
Numeric
Hours
B
Team work and dialogue with colleagues within this
school
Numeric
Hours
C
Marking/correcting of pupils work
Numeric
Hours
D
Pupil counselling (including career guidance and virtual
counselling)
Numeric
Hours
E
Pupil supervision and tuition (including lunch
supervision)
Numeric
Hours
F
Pupil discipline including detentions
Numeric
Hours
G
Participation in school management
Numeric
Hours
H
General administrative work (including communication,
paperwork, work emails and other clerical duties you
undertake in your job as a teacher)
Numeric
Hours
I
Communication and co-operation with parents or
guardians
Numeric
Hours
J
Engaging in extracurricular activities (e.g. sports and
cultural activities after school)
Numeric
Hours
ASK TEACHERS
5) Across the whole school year, is the amount of time you spend on the activities outlined in the last question too little, too much or about right?
SINGLE CODE ONLY FOR EACH ACTIVITY
Statements
Far
too
little
Too
little
About
right
Too
much
Far
too
much
n/a
A
Individual planning or
preparation of lessons either
at school or out of school
B
Team work and dialogue with
colleagues within this school
C
Marking/correcting pupils’
work
D
Pupil counselling (including
career guidance and virtual
counselling)
E
Pupil supervision and tuition
(including lunch supervision)
F
Pupil discipline including
detentions
G
Participation in school
management
H
General administrative work
(including communication,
paperwork, work emails and
other clerical duties you
undertake in your job as a
teacher)
I
Communication and
co-operation with parents or
guardians
J
Engaging in extracurricular
activities (e.g. sports and
cultural activities after
school)
ASK TEACHERS
The next two questions ask more detailed activities relating to support, management and administration. When answering, it does not matter if you included any of the following in earlier responses you made.
6) How many hours did you spend on the following specific support and management activities in your most recent full working week at [INSERT SCHOOL]?
Round to the nearest half hour. Please record a 0 (zero) if you spent no time on a listed
activity.
RANDOMISE A TO F.
A
Non-regular teaching cover for absent colleagues within
school's timetabled day
Numeric
Hours
B
Appraising, monitoring, coaching, mentoring and
training other teaching staff
Numeric
Hours
C
Contact with people or organisations outside of school
other than parents
Numeric
Hours
D
Organising resources and premises, setting up displays,
setting up/tidying classrooms
Numeric
Hours
E
[
ASK SECONDARY ONLY
]
Timetabled tutor time
Numeric
Hours
F
Staff meetings
Numeric
Hours
ASK TEACHERS
7) How many hours did you spend on the following specific administrative activities in your most recent full working week at [INSERT SCHOOL]?
Round to the nearest half hour. Please record a 0 (zero) if you spent no time on a listed
activity.
RANDOMISE A TO C.
A
School policy development and financial planning
Numeric
Hours
B
Recording, inputting, monitoring and analysing data in
relation to pupil performance and for other purposes
Numeric
Hours
C
Planning, administering and reporting on pupil
assessments
ASK TEACHERS
8) Across the whole school year, is the amount of time you spend on the support and management activities outlined in the last questions too little, too much or about right?
SINGLE CODE ONLY FOR EACH ACTIVITY
Statements
Far
too
little
Too
little
About
right
Too
much
Far
too
much
n/a
A
Non-regular teaching cover
for absent colleagues within
school's timetabled day
B
Appraising, monitoring,
coaching, mentoring and
training other teaching staff
C
Contact with people or
organisations outside of
school other than parents
D
Organising resources and
premises, setting up
displays, setting up/tidying
classrooms
E [
ASK SECONDARY ONLY
]
Timetabled tutor time
ASK TEACHERS
9) Across the whole school year, is the amount of time you spend on the administrative activities outlined in the last questions too little, too much or about right?
Statements
Far
too
little
Too
little
About
right
Too
much
Far
too
much
n/a
A
School policy development
and financial planning
B
Recording, inputting,
monitoring and analysing
data in relation to pupil
performance and for other
purposes
C
Planning, administering and
reporting on pupil
assessments
*****************************
Working hours questions – HEADTEACHER route
SHOW FOR HEADTEACHERS
The first questions cover the activities that are most common for Headteachers and
Deputy Headteachers.
Some questions will ask for an estimate of time spent in
hours
in your most recent full
working week.
ASK HEADTEACHERS
10) In your most recent full working week, approximately how many hours did you spend in total on school management, staff supervision, interacting with other teachers, teaching and on other tasks related to your job at [INSERT SCHOOL]?
Please include tasks that took place during weekends, evenings or other out-of-school
hours.
Round to the nearest half hour. As an example, three and a half hours would be recorded
as 3.5 below.
ASK HEADTEACHERS
11) How many hours did you spend on the following activities in your most recent full working week at [INSERT SCHOOL]?
Please include tasks that took place during weekends, evenings or other out-of-school
hours. Again, round to the nearest half hour.
Please record a 0 (zero) if you spent no time on a listed activity.
DO NOT RANDOMISE.
A
Leadership and management within the school
Including strategic planning, staff meetings and other
school-centred management activities, such as those associated
with the management of federated schools.
Numeric
Hours
B
Administration within the school
Including applying regulations to the school, reporting, school
budget, preparing timetables and class composition.
Numeric
Hours
C
Administrative and management with external bodies
Including responding to requests from local, regional, or
national education officials
Numeric
Hours
D
Performance management of staff
Including human resource/personnel issues, classroom
observations, mentoring, initial teacher training and
continuing professional development
Numeric
Hours
E
Teaching and related tasks
Including covering for teacher absences, lesson planning,
assessing and marking pupils’ work and student assessment
Numeric
Hours
F
Curriculum planning
Including developing curriculum and student evaluation
Numeric
Hours
G
Data analysis
Including analysis performance data at the level of the
teacher and the school and record keeping for external
bodies / regulatory purposes
Numeric
Hours
H
Student interactions
Including counselling and conversations outside structured
learning activities, discipline
Numeric
Hours
I
Parent or guardian interactions
Including formal and informal interactions
Numeric
Hours
J
Recruitment
For teaching and support staff
Numeric
Hours
ASK HEADTEACHERS
12) Across the whole school year, is the amount of time you spend on the activities outlined in the last question too little, too much or about right?
SINGLE CODE ONLY FOR EACH ACTIVITY
Statements
Far
too
little
Too
little
About
right
Too
much
Far
too
much
n/a
A
Leadership and management
within the school
B
Administration within the
school
C
Administrative and
management with external
bodies
D
Performance management of
staff
E
Teaching and related tasks
F
Data analysis
G
Curriculum planning
H
Student interactions
I
Parent or guardian
interactions
J
Recruitment
ASK HEADTEACHERS
13) Does [INSERT SCHOOL] have any of the following strategies in place for managing and planning professional time?
SINGLE CODE EACH. RANDOMISE A TO E
Strategy
Yes No Not
sure
A
Protected blocks on non-teaching time to plan lessons
and/or mark work (PPA)
B
Working collaboratively with other staff to plan
schemes of work and/or share resources
C
Existing schemes of work and associated lesson plans
that can be adapted by teaching staff
D
Computer software that effectively helps with
administrative tasks
E
A committee in place that monitors teachers’ workload
F
Other time management strategies (please specify)
Perceptions and drivers of workload
ASK ALL
14) To what extent do you agree or disagree with the following statements about your working hours?
SINGLE CODE EACH. RANDOMISE A TO C
Statements
Strongly
disagree
Tend to
disagree
Neither
agree
nor
disagree
Tend to
agree
Strongly
agree
A
I can complete my assigned
workload during my
contracted working hours
B
I have an acceptable
workload
C
Overall, I achieve a good
balance between my work
life and my private life
15) You said earlier that you worked [INSERT RESPONSE FROM Q2 OR Q10] hours in your last working week. How many of those hours were spent working during weekends, evenings or other out-of-school hours?
Round to the nearest half hour. As an example, three and a half hours would be recorded
as 3.5 below.
RECORD HOURS
ASK ALL
16) To what extent do you agree or disagree with the following statements about the working environment within [INSERT SCHOOL]?
SINGLE CODE EACH. RANDOMISE A TO D
Statements
Strongly
disagree
Tend to
disagree
Neither
agree
nor
disagree
Tend to
agree
Strongly
agree
A
Teaching staff collaborate
effectively to address
disciplinary problems
B
Lesson observations carried
out in
[INSERT SCHOOL]
are
an effective part of
professional development
activity
C
Teaching assistants are
effectively
deployed at
[INSERT SCHOOL]
ASK ALL
17) To what extent do you agree or disagree with the following statements about professional development and support?
SINGLE CODE EACH. RANDOMISE A TO E
Statements
Strongly
disagree
Tend to
disagree
Neither
agree
nor
disagree
Tend to
agree
Strongly
agree
A
I have enough time to keep
informed on changes to
guidance and rules affecting
professional practice
B
I have the necessary
Information and
Communication Technology
(ICT) skills to perform data
recording and analysis tasks
C [INSERT SCHOOL]
supports
continuing professional
development for teachers
D
I have time during my
contracted working hours to
take part in professional
development activities
ASK ALL
18) To what extent do you agree or disagree with the following statements about the way you are managed?
SINGLE CODE EACH. RANDOMISE A TO C
Statements
Strongly
disagree
Tend to
disagree
Neither
agree
nor
disagree
Tend to
agree
Strongly
agree
A [
TEACHER ONLY
]
My
manager is considerate of
my life outside work
B [
TEACHER ONLY
]
My
manager recognises when I
have done my job well
C
I think that my performance
is evaluated fairly
D
I am satisfied with the
number of hours I usually
work
E [
TEACHER ONLY
]
I am
satisfied with my level of
involvement in decisions that
affect my work at
[INSERT
SCHOOL]
ASK ALL
19) To what extent, if at all, do you consider teacher workload to be a serious problem in your school?
SINGLE CODE. REVERSE A TO D
A
Workload is a very serious problem
1
B
Workload is a fairly serious problem
2
C
Workload is not a very serious problem
3
D
Workload is not a serious problem at all
4
E
Don’t know
5
[i6] DfE would like to understand how workload, and other issues covered by this
research, affects teachers’ careers. To do this DfE would like its contractors to link
teachers’ answers to this survey to information held on the School Workforce Census, for
the purposes of this research. This will provide further information about you and your
career without you being asked further questions. Only aggregated statistics will be
produced with this information, no individual or school will be identified in analysis or
reports. Further information on how they will do this and how your privacy will be
protected is available <here>.
ASK ALL
20) Do you give permission for the research contractors to match your survey answers to your personal information held on DfE’s School Workforce Census for this statistical analysis only?
SINGLE CODE ONLY.
Response
A
Yes
1
B
No
2
ASK IF YES AT Q20
21) In order for us to link to the School Workforce Census, can you please provide the following details:
ALLOW REFUSED AS WELL AS DK FOR TEACHER REFERENCE NUMBER
Response
ALLOW
REFUSED
A
Full Name
OPEN TEXT FIELD
B
Date of birth
USE DATE FIELD
C
Teacher Reference
Number
ASK IF NO AT Q20 OR REFUSED Q21
22) Into which of the following age bands do you fall?
SINGLE CODE ONLY.
Age
A
Under 25
1
B
25 to 29
2
C
30 to 34
3
D
35 to 39
4
E
40 to 44
5
F
45 to 49
6
G
50 to 54
7
H
55 to 59
8
I
60 or older
9
J
Prefer not to say
10
ASK ALL
23) What is your gender?
Sex
A
Female
1
B
Male
2
C
Prefer not to say
3
IF NO AT Q20 OR REFUSED AT Q21
24) Please provide the number of hours per week for which you are contracted to work at [INSERT SCHOOL]? If your contract is variable and/or term-time only, please write in the typical hours you work per school week.
IF NO AT Q20 OR REFUSED AT Q21
25) Which of the following best describes your employment contract at [INSERT SCHOOL]?
SINGLE CODE ONLY.
A
Permanent employment (an on-going contract with no fixed end-point
before the age of retirement)
B
Fixed-term contract for a period of more than 1 school year
C
Fixed-term contract for a period of 1 school year or less
ASK ALL SECONDARY TEACHERS
26) Which of the following subjects do you teach on a regular basis?
MULTICODE. ALPHABETICAL ORDER DROP DOWN MENU
1 Applied Business Studies
2 Art and Design / Art
3 Biology / Botany / Zoology / Ecology
4 Chemistry
5 Commercial and Business Studies/Education/Management
6 Design and Technology
7 Design and Technology - Food Technology
8 Design and Technology - Resistant Materials
9 Drama
10 English
11 French
12 Geography
13 German
14 Health and Social Care
15 History
16 Humanities
17 Information and Communication Technology
18 Mathematics / Mathematical Development (Early Years)
19 Media Studies
20 Music
21 Other
22 Personal Social and Health Education (PSHE)
23 Physical Education / Sports
24 Physics
25 Primary Curriculum
26 Psychology
27 Religious Education
28 Science
29 Sociology
30 Spanish
31 Other (Please specify)
32 Prefer not to say
27) Are you a…?
SINGLE CODE ITEM.
Role
Yes No
A
… SEN Coordinator?
B
… Newly qualified teacher (NQT)?
ASK ALL
28) How many years you have been working in...?
Please record the time in years to the nearest half year.
A
…the teaching profession
Numeric
Years
B
…your current school
Numeric
Years
C
…your current role
Numeric
Years
SHOW FOR THOSE WHO SAID YES AT Q20
DfE may wish to track the progress of your employment in teaching over the next three
years (until 31st August 2019) to help better understand the any impact of workload over
time. To do this DfE will keep a record of your survey answers and your School
Workforce Census record. The data will only be used for research and statistical
purposes.
Only aggregated statistics will be produced with this information, no individual or school
will be identified in analysis or reports. Further information on how they will do this and
how your privacy will be protected is available <here>.
29) Do you provide permission for CFE Research to pass on a copy of your survey responses plus your personal details to DfE for this purpose?
SINGLE CODE ONLY
Response
A
Yes, you may pass on my linked survey and personal details to DfE
to help them understand the longer term impact of workload on
teachers’ careers only
1
B
No
2
SHOW TO ALL
contacted, you will be under no obligation to take part). Further information on how your
privacy will be protected is available <here>.
DfE may contact you directly or appoint an approved contractor. Your details would not
be shared with any other third parties.
ASK ALL
30) Do you provide permission for CFE Research to pass on a copy of your survey responses plus your personal details to DfE for this purpose?
SINGLE CODE ONLY
Response
A
Yes, DfE may contact me to learn more about my survey responses
and/or to invite me to take part in further research on this issue
1
B
No
2
SHOW IF YES AT Q20 AND YES AT Q30
31) Could you please provide details of how we can contact you for further research on teachers’ workload. Note your contact details will not be used for any other purpose.
Response
ALLOW
REFUSED
A
Telephone number
OPEN TEXT FIELD
B
Email address
OPEN TEXT FIELD
SHOW IF NO AT Q20 AND YES AT Q30
32) Please provide some contact details so we can contact you for further research on teachers’ workload. Note your contact details will not be used for any other purpose.
Response
ALLOW
REFUSED
A
Full Name
OPEN TEXT FIELD
B
Date of birth
USE DATE FIELD
C
Telephone number
OPEN TEXT FIELD
D
Email address
OPEN TEXT FIELD
END
Annex 5: Response rates
School cooperation rate
A target of 250 participating schools was set at the outset of the study. This target was
challenging given the short timeframe for the study as a whole, including a short four week period for recruitment. Based on prior experience, it was estimated that a minimum sample of 750 schools would be required. The timeframe of the study meant that there would be little time to draw a reserve sample once the cooperation rate was known. As a result, the reserve was drawn at the same time as the main sample. An initial sample of 600 schools was invited to participate and after reviewing the cooperation rate, a further 250 were contacted early in the recruitment process. This left a reserve of 150 schools, all of whom were contacted by email at the end of the first week of fieldwork. The contact details of one school were incorrect, which left a total of 899 that were invited in some way to participate. As noted earlier (Annex 2: Sampling), school sampling by phase was conducted disproportionately to ensure that there were enough
participating schools within the primary and secondary phases to address potential issues of a small number of sampling units in the secondary phase if representative sampling was used. The sample design was balanced in such a way as to provide enough individual clusters to minimise bias whilst still delivering the robust sub-samples of teachers for comparative analysis.
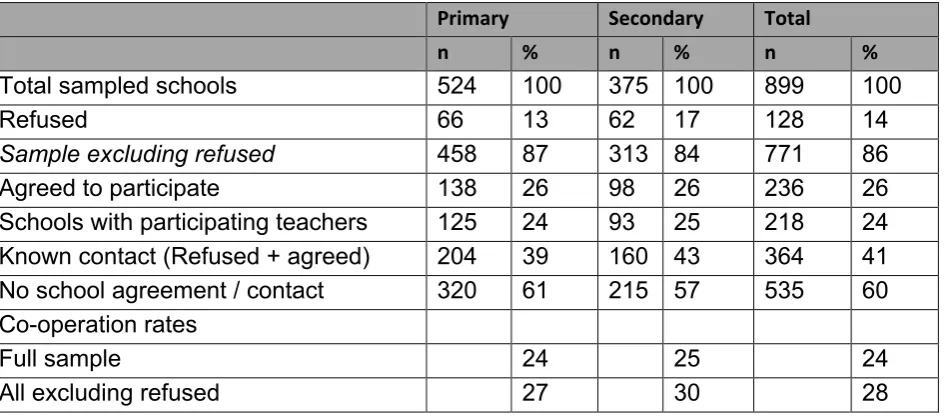
[image:42.595.63.537.542.752.2]In total, 244 schools agreed to take part in the study and at least one response was received from 218 of these. Of the 899 invited, 128 schools (14%) refused to take part in the study, which left an eligible sample of 771. Table A5.1 shows the cooperation rates by school in total and between phases. The cooperation rate achieved for the full sample was 24%; the cooperation rate for the sample excluding refusals was 28%.
Table A5.1: School cooperation rates
Primary Secondary Total
n % n % n %
Total sampled schools
524
100
375 100
899
100
Refused
66
13
62
17
128
14
Sample excluding refused
458
87
313
84
771
86
Agreed to participate
138
26
98
26
236
26
Schools with participating teachers
125
24
93
25
218
24
Known contact (Refused + agreed)
204
39
160 43
364
41
No school agreement / contact
320
61
215 57
535
60
Co-operation rates
Full sample
24
25
24
Teachers’ response rate
As noted in Table A5.1, 218 schools had at least one teacher completing the survey. The teacher response rate was, therefore, calculated by comparing the number of responses received (in total and by sub-group) compared to the population of teachers present in these schools (based on aggregating the number of staff working at each participating school as recorded in the School Workforce Census at that point in time (March 2016)).
The response rate in each school ranged from 1% to 100%. Of the 218 participating schools, just 10 had a response rate of less than 10%. Table A5.2 shows the overall response rate was 33.9%.
Table A5.2: Overall teacher response rates
Primary Secondary Total
Teachers present in participating schools
2,295 7,091
9,386
Completed interviews
900
2,141
3,186
Response rate
39.2% 30.2%
33.9%
Improving cooperation and response rates in subsequent
surveys
The survey has successfully improved on both the achieved sample size (1,004 diaries in 2013) and the response rate (15%) achieved in the last diary study (TNS-BMRB, 2013). As a result, the robustness and value of sub-group analysis has been enhanced. However, there are always opportunities to improve studies and two measures that could be taken to improve response rates in subsequent studies of this type are provided below.
1. Provide more preparation time for school recruitment. Out of necessity, the study was commissioned to a short timetable. Ideally, at least twice the time would have been
2. Increased support activity to improve response and cooperation rates. The 33.9% response rate was achieved through simplifying the methodology compared to past diary surveys and removing as much work as possible in survey administration from those coordinating within schools. There was little time or budget available to deliver the same level of technical and administrative support that was provided to schools in the TALIS survey, which also used mixed mode options (online and postal) to boost response rates and included minimum response rate targets as part of each participating country’s contract (OECD, 2014). The level of support provided in TALIS was, therefore, necessary to fulfil contractual requirements. In addition, the sample administration was more
complex and the questionnaire was much longer.
However, some further resource in future workload surveys would help minimise the number of participating schools with particularly low response rates (which would be excluded from analysis in TALIS) by providing more and targeted guidance and support if needed. For example, an experiment was run on a randomised sub-sample as part of the recruitment work. Half of the subset of schools were initially emailed by DfE and half by CFE Research. The DfE email was twice as effective in eliciting a positive response for cooperation from schools. Emails from DfE used as reminders were also fairly effective at increasing the number of surveys completed by teachers.
The contractor also had limited time to fully contact all of the sample due to the tight timetable. Whilst it was possible to call most schools at least three times within budget, it would have been useful to spend a little more time maximising coverage of the sample to increase the cooperation rate. Coupled with a more favourable timetable, there is no reason why a modest increase in the support budget could not improve both school cooperation rates and teacher response rates.
Annex 6: Data processing and tabulation
Cleaning
The use of Confimit survey scripting software ensured that necessary data cleaning was kept to a minimum – for example teachers were routed correctly through the survey depending on
classroom teacher or head teacher role so that the right questions were answered. Closed questions were mostly compulsory until the demographic information section. In other regards data was kept as similar as possible to the TALIS survey for consistency and clarity of
comparison.
Data cleaning was performed in the form of back-coding for the following questions:
• Q1 (role). In this particular instance, a small number of interviews were removed for those recording “Other (please specify)” because the response suggested that they were
teaching assistants or other roles, which made them ineligible for the survey.
• Q4 / Q11 (hours spent on activities other than teaching). Hours spent on “other activities” were reassigned, where possible, to one of the ten pre-coded options..
• Q13 (other time management strategies). Open responses were back-coded as “Yes” into other pre-assigned categories where appropriate. All remaining responses were classed as “other”.
Additional data cleaning was performed where respondents had misinterpreted the question such as Q24 (number of contracted hours per week). Here, where people had given responses less than one (such as 0.8) it was reasonable to assume they had given their FTE equivalent. These were cleaned by multiplying their response by 32.5. This was done in order to derive a consistent figure in hours for as many respondents as possible. In the case of fractional responses to this question (0.1 to 0.9), is was deemed likely that teachers had given a response that reflected their hours proportional to full time hours. In cases where teachers gave permission for data-matching, it was possible to check data with the School Workforce Census and confirm this interpretation.
Finally, there were occasions during the “fuzzy matching” process of matching teachers to their School Workforce Census records, where it was clear that there were errors in date of birth given as there were discrepancies between dates entered into the survey and those held in the Census records. In these situations discretion was used to clean birth dates (for example where a year of birth was obviously given as “03” instead of “63”, or in cases where a given variable either did not match with the SWC record, or was inconsistent with other responses) so that age bands
Data Matching
Additional publicly available secondary data was included for all schools where available,
specifically the Ofsted rating and region classification, pulled in from the Edubase database using the school’s local authority establishment identifier (LAESTAB number).
In addition, teacher level data from the School Workforce Census (SWC) was included where the teacher gave consent at Q20/Q21. In this case it was found that the majority of consenting teachers were not aware of their Teacher Reference Number so they were matched with the secondary SWC data using a unique ID derived from teacher surname, date of birth and school identifier (LAESTAB).
This allowed matching of SWC data into the sample for the majority of those who gave consent. Where a match was not possible, “fuzzy matching” was utilised. This largely manual process involved identifying where close matches were present that could be confidently identified as correct matches, for example variations in spelling of surnames or easily identifiable error