1 Equally Flexible and Optimal Response Bias in Older Compared to Younger Adults
Roderick Garton, Angus Reynolds, Mark R. Hinder, Andrew Heathcote Department of Psychology, University of Tasmania
Accepted for publication in Psychology and Aging, 8 February 2019
© 2019, American Psychological Association. This paper is not the copy of record and may not exactly replicate the final, authoritative version of the article. Please do not copy or cite without authors’ permission. The final article will be available, upon publication, via its DOI: 10.1037/pag0000339
Author Note
Roderick Garton, Department of Psychology, University of Tasmania, Sandy Bay, Tasmania, Australia; Angus Reynolds, Department of Psychology, University of Tasmania, Sandy Bay, Tasmania, Australia; Mark R. Hinder, Department of Psychology, University of Tasmania, Sandy Bay, Tasmania, Australia; Andrew Heathcote, Department of Psychology, University of Tasmania, Sandy Bay, Tasmania, Australia.
Correspondence concerning this article should be addressed to Roderick Garton, University of Tasmania Private Bag 30, Hobart, Tasmania, Australia, 7001. Email: rgarton@utas.edu.au
This study was supported by Australian Research Council Discovery Project
DP160101891 (Andrew Heathcote) and Future Fellowship FT150100406 (Mark R. Hinder), and by Australian Government Research Training Program Scholarships (Angus Reynolds and Roderick Garton). The authors would like to thank Matthew Gretton for help with data acquisition, Luke Strickland and Yi-Shin Lin for help with data analysis, and Claire Byrne for help with study administration. The trial-level data for the experiment reported in this
2 Abstract
Base-rate neglect is a failure to sufficiently bias decisions toward a priori more likely options. Given cognitive and neurocognitive model-based evidence indicating that, in speeded choice tasks, (1) age-related slowing is associated with higher and less flexible overall evidence thresholds (response caution) and (2) gains in speed and accuracy in relation to base-rate bias require flexible control of choice-specific evidence thresholds (response bias), it was hypothesised that base-rate neglect might increase with age due to compromised flexibility of response bias. We administered a computer-based perceptual discrimination task to 20 healthy older (63–78 years) and 20 younger (18–28 years) adults where base-rate
direction was either variable or constant over trials and so required more or less flexible bias control. Using an evidence accumulation model of response times and accuracy (specifically, the Linear Ballistic Accumulator model; Brown & Heathcote, 2008), age-related slowing was attributable to higher response caution, and gains in speed and accuracy per base-rate bias were attributable to response bias. Both age groups were less biased than required to achieve optimal accuracy, and more so when base-rate direction changed frequently. However, bias was closer to optimal among older than younger participants, especially when base-rate direction was constant. We conclude that older participants performed better than younger participants because of their greater emphasis on accuracy, and that, by making greater absolute and equivalent relative adjustments of evidence thresholds in relation to base-rate bias, flexibility of bias control is at most only slightly compromised with age.
Keywords
3 Binary decisions require making a judgement about the relative likelihood of each option. Normatively, uncertain judgements require combining knowledge of the base rates for each option (i.e., knowledge about prior probabilities) with the probability of the observed evidence given each option (i.e., a likelihood ratio). In both behaviour and the brain,
judgement and decision making has been conceptualized as a dynamic process (formally, as a weighted sum of the logarithm of the prior likelihood and gradually accumulating estimates of the logarithm of the likelihood of each option; Carpenter & Williams, 1995; Gold & Shadlen, 2001). A tendency to under-weight base rates (often termed the “base-rate fallacy” or “base-rate neglect”) is well known in high-level decision making (e.g., Bar-Hillel, 1980; Kahneman & Tversky, 1973, 1982). Here we study the extent to which aging affects the weighting of prior evidence in simple perceptual decision making.
It is increasingly understood that older adults make slower decisions between stimulus alternatives not exclusively or even ubiquitously because they process less stimulus
4 thresholds to base-rate information more difficult with age, especially in situations where base-rate information changes rapidly.
In the first part of this report, we review evidence about the effects of aging on the setting of evidence thresholds in the context of evidence accumulation models of choice responding. We then draw out the implications of this evidence for the way in which normal aging affects how response bias is controlled in association with base-rate information. We then report of an experiment in which older and younger participants made binary perceptual discriminations under two procedures of base-rate biasing—one in which the more likely target was constant across a block of trials, the other in which the more likely target randomly changed from trial-to-trial. We hypothesised that the need to adjust thresholds quickly and flexibly under the latter condition could make it harder for both older and younger
participants to appropriately bias their response thresholds, and that this limitation could be greater in older participants due to a reduced ability to flexibly control threshold setting. We also benchmarked the biasing of response thresholds to base-rate information against the level of biasing required to optimise accuracy relative to given levels of response caution. Response Caution and Age-Related Slowing
Slowing of choice responses is well known to occur with increasing adult age.
Although decreased central processing efficiency was for some time the dominant account of age-related slowing (e.g., Hartley, 2006; Salthouse, 2016), a long-standing alternative
account attributes this to increased response caution with age (e.g., Craik, 1969; Welford, 1977). This hypothesis has received new impetus across the last two decades from analyses based on evidence-accumulation models of performance on speeded choice tasks.
5 Heathcote, 2008). The racing choice options are referred to as “accumulators”. In an
elementary binary choice task, the response is determined by the winner of the race between two accumulators to their own decision thresholds, and the decision time is determined by the finishing time of the winning accumulator. Response time (RT) is the sum of the decision time and the duration of non-decision processes (i.e., initial encoding of the stimulus into a form from which evidence relevant to the choice can be derived, and the production of a response corresponding to the choice once it is made). Modelling usually focuses on two core components: the placement of decision thresholds, and the rate at which evidence is
accumulated. Models differ in how they describe these two components. Greater response caution is identified with the persistent use of higher thresholds across the two accumulators and slowed information processing is identified with a lower rate of evidence accumulation. We also report subsidiary analyses based on another type of evidence accumulation model, the Diffusion Decision Model (DDM; Ratcliff & McKoon, 2008), which explains
information processing rates and response caution in a comparable way.
6 2014), and racing accumulator models (Ratcliff et al., 2005), including the LBA (Forstmann et al., 2011). Although decreases in processing efficiency with age are consistently found in a number of paradigms—for choices requiring discrimination of fine visual detail (e.g., Ratcliff et al., 2005; Yang, Bender, & Raz, 2015), strong demands on memory (e.g., Ratcliff, Thapar, & McKoon, 2011; Spaniol, Madden, & Voss, 2006) and switching between tasks (e.g., Karayanidis et al., 2011; Whitson et al., 2014; but see Schuch, 2016)—even in these cases there are large caution effects. It is also interesting to note that accumulation rates can even be higher for older than younger adults in association with greater task-relevant ability and motivation (Davies, Arnell, Birchenough, Grimmond, & Houlson, 2017; Dirk et al., 2017; Ratcliff et al., 2001, Exp. 1; Starns & Ratcliff, 2010, Exp. 2A).
7 difference persisted. They suggested that these age differences were not solely due to
differences in goals “but also the ability to achieve those goals” (Starns & Ratcliff, 2012, p. 145; see also Smith & Brewer, 1995).
Age-related changes in the brain provide a potential explanation for this reduced ability to achieve the goal of balancing speed and accuracy. In particular, reduced white matter integrity in fronto-striatal tracts connecting the pre-Supplementary Motor Area (pre-SMA) to the striatum has been suggested to reduce flexibility in threshold setting with age. Neurocognitive modelling has shown not only a correlation of fronto-striatal activity with LBA response caution, but a negative correlation between the white matter integrity of these tracts and both age and LBA thresholds (e.g., Forstmann et al., 2011). Building on a range of evidence linking degradation of white matter integrity and impairments in memory retrieval and cognitive control with age, Forstmann et al. (2011) suggested that “unwillingness of older adults to adopt fast speed-accuracy tradeoff settings may not just reflect a strategic choice that is entirely under voluntary control … it may also reflect structural limitations: age-related decrements in brain connectivity” (p.17242).
Response Bias and Aging
In speeded choice tasks, responses are faster and more accurate for options with a higher base rate. In the context of the accumulator model described above, the effects of biased base rates can be modelled by setting one decision threshold lower than the other, so that the corresponding accumulator wins the decision race more frequently and in less time— so producing greater accuracy and shorter RT for the more likely option. Whether this occurs by reducing the threshold associated with the more likely option and/or increasing the
8 that this effect is well described by response-specific threshold adaptation. These studies have mostly involved a block-wise bias where the base rates for each option were held constant across a block of trials and might only vary in direction (which target was the more likely one) between blocks (e.g., Arnold, Bröder, & Bayen, 2015; Criss, 2010; Leite & Ratcliff, 2011; Ratcliff, 1985; Ratcliff & McKoon, 2008, Exp. 3; Simen et al., 2009, Exp. 2; Van Ravenzwaaij, Mulder, Tuerlinckx, & Wagenmakers, 2012; Van Zandt, Colonius, & Proctor, 2000; White & Poldrack, 2014). Other studies have involved a trial-wise bias in which there were equal base rates across the block but targets were sampled on each trial such that the direction of bias could change between trials, the more likely target being cued ahead of each stimulus presentation (e.g., Dunovan & Wheeler, 2018; Forstmann, Brown, Dutilh, Neumann, & Wagenmakers, 2010; Mulder, Wagenmakers, Ratcliff, Boekel, & Forstmann, 2012).
It is commonly observed in these studies that, for the more likely option, error responses tend to be slower than correct responses, whereas, for the less likely option, error responses can be as fast, or faster, than correct responses (see, e.g., Mulder et al., 2012, Fig. 4). This pattern in the behavioural data is supportive of a relative threshold model of bias effects given that, with equal accumulation rates per option, this model predicts that (1) for the more likely option, the threshold for a correct response is lower than that for an error response, leading to faster correct than error responses, but (2) for the less likely option, the threshold for the correct response is higher than that for the error response (i.e., in this case, the more likely option), leading to faster errors relative to correct responses.
9 by LBA thresholds was associated with differential fMRI activation in the orbitofrontal cortex, hippocampus and the side of the striatal putamen contralateral to the cued direction (see also Mulder et al., 2012, for a similar finding using the DDM but with stronger parietal involvement; and Forstmann, Ratcliff, & Wagenmakers, 2016, for a review). Given the pervasiveness of the association between age-related degradations in white matter integrity and impairments in cognitive control, and similarities between networks controlling caution and bias, it seems reasonable to hypothesise that the control of thresholds necessary to set an appropriate response bias might decline with age.
Consistent with this hypothesis, there is evidence of limited trial-by-trial adjustment of response caution among older adults. Specifically, Karayanidis et al. (2011) found that, in a task-switching paradigm, younger adults flexibly adjusted response thresholds on a trial-by-trial basis so as to maintain greater caution on the harder switch trial-by-trials relative to easier repeat trials (replicating earlier findings), whereas caution was held uniformly high by older
participants over switch and repeat trials. Also, Forstmann et al. (2011) found larger
variability in the startpoints of evidence accumulation for older than younger adults in their LBA fits of data from a trial-wise caution (speed/accuracy) manipulation, concluding that older adults are “less proficient at controlling their bias or response caution settings” (p. 17246).
10 than, younger adults. Consistent with this hypothesis, older adults have shown speed
facilitation at levels equivalent to, or greater than, younger adults in association with response precuing in spatial choice (reviewed in Proctor, Vu, & Pick, 2005) and task-switching (Mayr, 2001), and with sequential biases over trial history in elementary choice response (e.g., Fozard, Thomas, & Waugh, 1976; Melis, Soetens, & van der Molen, 2002; Rabbitt & Vyas, 1980). These effects are indicative of flexible trial-by-trial adjustments of response-specific thresholds, which manifest as greater startpoint variability (Heathcote et al., 2015). As such, it is possible that greater startpoint variability among older relative to younger participants is indicative of greater trial-wise adjustment of response-specific thresholds to prior
experimental or incidental cues rather than lack of control of overall threshold setting.
Experiment
11 likely, and, to the extent that control of response bias is reduced with age, the difference between block-wise and trial-wise biasing might be expected to increase with age.
To measure evidence thresholds while accounting for possible effects on non-threshold parameters, we fit our data with the LBA (Brown & Heathcote, 2008) using
Bayesian methods (Heathcote et al., 2018). Just as is the case for RT measurement, where the equivalence or otherwise of the effects of a manipulation must be judged relative to baseline differences between older and younger participants (Verhaeghen, Steitz, Sliwinski & Cerella, 2003), higher overall thresholds for the older group raise the question of whether to use an additive or multiplicative measure of bias effects. We circumvented this issue, and
benchmarked the normative performance of both groups, by determining the level of bias that optimized accuracy based on the distribution of posterior parameter estimates of the LBA model. This afforded us tests of the absolute and relative optimality of older and younger participants that take account of both the speed and accuracy of decisions as well all sources of uncertainty in our data.
12 time, with younger participants showing a small advantage over older participants (~0.025s). Given similarities of task and analysis between our study and that of Forstmann et al., and that our sample of older participants was also healthy and highly motivated, we expected similar results.
Several aspects of our design were motivated by minimizing potential confounds that occur under bias manipulations, and to improve measurement of LBA parameters. Simply responding with the more likely correct or rewarded option as soon as a stimulus is detected (fast guessing) occurs with a short response-stimulus interval (Simen et al., 2009) and when fast responding is encouraged by instruction (Noorbaloochi, Sharon & McClelland, 2015). We therefore used a long response-to-stimulus interval, a fast-guess warning, and a moderate base-rate manipulation to minimize fast guessing. Furthermore, base-rate bias can be less effective in producing prospective shifts of response thresholds when, with highly practiced participants, difficulty varies widely and unpredictably (including choices with no correct answer) between trials. Under these conditions, thresholds might nevertheless be
13 parameters (Voss et al., 2004). To account for effects of base-rate bias on both thresholds and accumulation rate, we performed model selection among three LBA parameterizations that assumed a selective influence of the bias manipulation on either thresholds or rates alone, or on both thresholds and rates. For generalizability across model architectures, we also
performed a post hoc modelling of the data with the DDM (as encouraged by a reviewer).
Method
Participants
14 Those participating comprised 51% of those in the pool who were approached to participate in the current study.
Design and Stimuli
All participants completed one session in which bias direction was manipulated in a block-wise manner, and one session in which bias direction was manipulated in a trial-wise manner, with session order counter-balanced within each age group. Each stimulus colour was presented as the more likely (cue-congruent) target and the less likely (cue-incongruent) target in equal proportions across blocks under both bias-types, and within blocks under trial-wise biasing. Within blocks, easy vs. hard target discriminations occurred equally often in a random order.
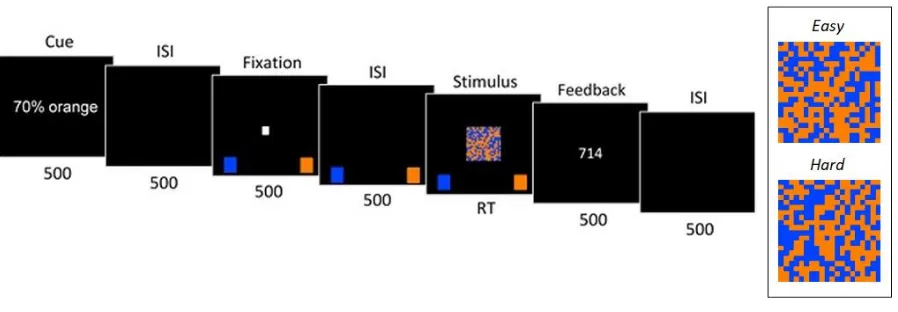
15 Figure 1. Trial sequence and stimulus difficulty samples. Events within each trial are shown in their temporal sequence from left to right. The duration of each event is shown below each event image (in ms), with the stimulus presentation remaining on-screen until a response was made, up to a maximum of 2s. See the text for definition of each event and its elements. Elements within each image are not to scale with respect to the enclosing display region or to each other; for example, in the experiment, the width of the stimulus grid was only 10% of the width of the screen. The inset presents a static sample of the stimulus grid where orange (light grey) cells predominate relative to blue (dark grey) cells under both easy (54%) and hard (52%) levels of target discrimination difficulty.
Procedure
After introductory verbal and on-screen instructions, each session commenced with a practice block of 20 trials, all without biasing and with easy discriminations where the target colour filled 60% of the cells of the stimulus array. This was followed by 10 blocks of 60 trials each, the first two blocks of which were designated practice and for which the data were not analysed. Participants self-initiated each block by pressing a space-bar. This firstly
produced an instruction screen that reminded participants of the type of bias for that
16 ahead of each trial would be congruent with that colour. Participants were instructed to try to use this information to help them make the response as quickly as possible while being correct. The assignment of targets to trials according to these probabilities was made by sampling without replacement, where there were always 42 targets of one colour and 18 targets of the other colour within each block-wise bias block, and 30 targets of each colour within each trial-wise bias block.
Each trial commenced with the bias-cue—the statement “70% blue” or “70%
orange”—displayed for 0.5s slightly above the central stimulus region. This was followed by a blank interval of 0.5s, a small white fixation square in the centre of the screen for 0.5s, a blank interval of 0.5s, and then the stimulus. Using a standard USB keyboard, participants were instructed to press the ‘z’ or ‘/’ key to indicate the predominant colour within the stimulus. The mapping of response keys to target colour was counterbalanced across participants. To remind participants about the mapping, the onset of the fixation square coincided with the display of single blue and orange squares on the relevant side at the bottom of the screen. Responses had to be made within 2s. The stimulus and the mapping cues were offset upon registration of a response or on passing of the RT deadline. Onscreen feedback was then presented for 0.5s: responses were followed by a “too fast” message if RT was less than 0.2s, or by a “too slow” message if no response was made within 2s; otherwise, if the response was correct, the RT was presented, or, if the response was incorrect, the word “incorrect”. This was followed by a final 0.5s blank interval. Accordingly, the response-stimulus interval was 3s, including a cue-to-response-stimulus foreperiod duration of 2s. The entire sequence of events in each trial is illustrated in Figure 1.
At the end of each block, participants received performance feedback with an
17 accuracy as a percentage of all trials within that block. Participants were instructed (both verbally ahead of the session, and by on-screen text during the session) to take breaks between each block. Each session lasted 45–60 minutes. After these blocks, within each session, a stop-signal task (not analysed further here), of the same length, was administered. Finally, in debriefing, verbal feedback about task performance was elicited and noted.
Results
Prior to analysis, response timeouts and implausibly fast responses were removed (0.3%, see Supplemental Materials for details). A detailed analysis of observed performance measures (correct and error RTs, and error rates) using linear mixed models is reported in Supplemental Materials. These results are summarized in the next section along with graphical summaries of performance measures, and the subsequent sections define the LBA model (Brown & Heathcote, 2008) and report the results of fitting the model and the
optimality analysis. Performance Measures
18 Figure 2. Observed and LBA-predicted 10th, 50th and 90th correct RT percentiles
19 Figure 3. Observed and LBA-predicted 10th, 50th and 90th error RT percentiles (corresponding to lower, middle and upper lines respectively) for younger participants between
21 Older participants had slower overall responses, but slightly greater accuracy, than younger participants. Older participants were faster when correct than incorrect, whereas younger participants tended to be faster when incorrect than correct. Older participants also had fewer errors of omission than did younger participants. These results are consistent with increased caution in older relative to younger participants.
Overall, correct responses were faster, and accuracy was greater, for the more likely option. Consistent with a relative-threshold account of this effect, error RTs were, conversely, slower for the more likely option. These effects were stronger under block-wise than trial-wise biasing. These effects of base-rate bias were at least as large for older as for younger participants, older participants particularly showing a greater benefit in accuracy for more likely options under block-wise biasing. Consistent with our methodological expectations, sequential facilitation (speed-up by first-order target repetition) was larger under block-wise than trial-wise biasing for both age groups, and it was larger and more reliable on trials involving repetition of more likely options. This repetition effect was nevertheless smaller— and even absent under trial-wise biasing—among younger relative to older participants. LBA Modelling
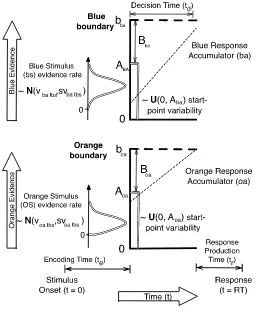
Figure 5 illustrates the LBA model, with one accumulator for orange responses and one accumulator for blue responses. Each accumulator can have different parameters, but we begin by describing the simplified case where they are the same. On each trial the starting evidence level is sampled independently for each accumulator from a uniform distribution on 0-A; A 0 is called the startpoint noise parameter. Evidence accrues linearly (the slanting
22 where t0 constitutes stimulus encoding and response production processes. We report
[image:22.595.187.443.168.480.2]threshold results in terms of B = b – A, enforcing b A (i.e., accumulation cannot begin above the response threshold) by requiring B 0.
Figure 5. An LBA model that incorrectly makes an orange response when deciding on a blue stimulus. Available at https://tinyurl.com/ybpgwn84 under a Creative Commons CC-BY license, https://creativecommons.org/licenses/by/2.0/
23 for the accumulator that mismatches the stimulus, with each distribution having mean v and standard deviation sv. When accuracy is above chance, v is greater for the matching
accumulator than the mismatching accumulator and so sampled rates tend to be higher for the matching accumulator (e.g., the slanting dashed line is steeper for the blue than orange accumulator in Figure 5). One accumulator parameter has to be fixed to make the model identifiable (Donkin, Brown, & Heathcote, 2009); accordingly, we fixed sv = 1 for the mismatching accumulator and estimated it for the matching accumulator.
In Figure 5, an incorrect orange response is made to a blue stimulus, despite the higher rate of the blue accumulator in this example, because startpoint noise gives the orange
24 favouring the more likely option between matching and mismatching rates (producing greater accuracy).
Model selection
Model-selection methods were used to determine which model parameters were influenced by experimental factors. Candidate models were constructed where bias (i.e., cue congruence) could affect (1) only thresholds (i.e., B varied with congruence of cue and accumulator); (2) only mean accumulation rate (i.e., v varied with congruence of cue and stimulus); or (3) both B and v. In all models both B and v were allowed to vary with bias-type. Mean accumulation rate was also allowed to vary with discrimination difficulty and matching versus mismatching accumulator. Difficulty was not set to affect thresholds (given the unpredictability of stimulus identity) or non-decision time (t0) (given that it does not
affect this parameter in this task; Voss et al., 2004). Further models also explored the effect of bias-type on t0, startpoint variability (A) and/or rate variability (sv) for the matching
accumulator; otherwise, estimates for the latter two parameterswere assumed to be the same across all within-subject conditions. Because older and younger groups were fit separately, all parameters were allowed to vary with age-group in all model fits.
25 responses, particularly those of older participants, as has been observed in other studies, and as naturally occurs at ends of the distribution that are subject to less reliable decision
processing and produce too few observations to appropriately constrain estimation (e.g., Ratcliff, Thapar, & McKoon, 2006; Thapar et al., 2003). This was confirmed by measuring goodness-of-fit in terms of root mean square deviations (see Supplemental Materials for details). These indicated a typical range of error of .02s–.05s for RTs, and less than 20% for ERs; better estimation was observed for older than younger participant correct RTs and ERs, as well as for error RTs when taking account of variability in the observed data.
Parameter tests
We report parameter estimates, and differences in parameter estimates (denoted d), as the medians of posterior samples averaged over participants along with 95% credible
intervals (CIs). We used Bayesian p-values (e.g., Klauer, 2010) to perform fixed-effects inferences about differences in these average parameter estimates1 between conditions and
groups, and 95% CIs to quantify uncertainty about the values of parameters and differences between parameters. The p-values correspond to tail areas in the distributions of differences between posterior parameter estimates from different conditions or groups. The 95% CIs correspond to the locations of the 2.5 and 97.5 percentiles of the parameter or difference
1 We did not test group level parameters because they do not account for within-subject correlations,
due to our population model assuming independence. Although a correlated population model would allow
random effects inference based on group parameters, its estimation is technically difficult and has not yet been
achieved with evidence accumulation models. Hence, we opted for inference based on averages over differences
in subjects’ parameters as it allowed us to account for correlations, but we note that this inference does not take
26 distributions. These values are directly interpretable as the probability that the true difference falls in the tail (e.g., the probability that it is greater or less than zero) or in the interval. For ease of interpretation we report p-values corresponding to the smallest of the areas above or below a difference of zero. For example, a small p-value for a positive average difference indicates the probability that the difference is negative is correspondingly small. Because they are of primary interest, we present details of the analysis of threshold parameters below but only summaries of the results for other parameters, with details provided in Supplemental Materials.
[image:26.595.99.496.532.588.2]Thresholds. Table 1 shows that we replicated many previous findings of older participants responding with greater caution, as compared with younger participants. This was true for both block-wise and trial-wise biasing. For older participants, the average threshold under trial-wise biasing was slightly larger than under block-wise biasing [d = 0.07 (0.01, 0.13), p = .008]. For younger participants, there was no difference in thresholds between bias-types [d = 0.01 (–0.02, 0.04), p = .259].
Table 1. Caution: B Posterior Parameter Estimates: Medians of means over cue conditions, accumulators and participants (and 95% credible intervals).
Bias-type Older Younger Older – Younger
Block-wise 1.09 (1.05, 1.13) 0.71 (0.69, 0.72) 0.39 (0.35, 0.43), p < .001
Trial-wise 1.16 (1.12, 1.21) 0.71 (0.70, 0.73) 0.45 (0.40, 0.50), p < .001
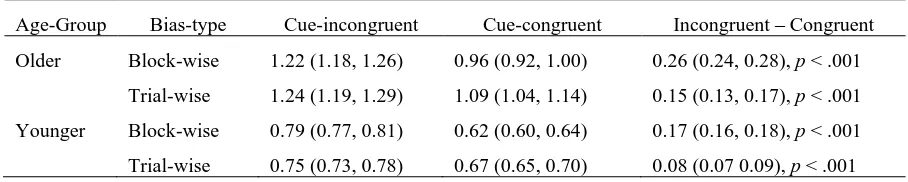
bias-27 types. Between bias-types, the difference between cue-incongruent and cue-congruent
thresholds (right-most column of Table 2) was greater for block-wise than for trial-wise bias—for both older [d = 0.11 (0.08, 0.14), p < .001] and younger [d = 0.09 (0.07, 0.10), p
[image:27.595.70.524.305.396.2]< .001] participants. Although, as these descriptives indicate, there was a slightly greater effect of block-wise relative to trial-wise biasing on the amount of threshold bias among older participants, this age difference was not itself reliable [d = 0.02 (–0.01, 0.06), p = .098].
Table 2. Bias: Threshold (B) Posterior Parameter Estimates: Medians of means over stimulus and participants (and 95% credible intervals).
Age-Group Bias-type Cue-incongruent Cue-congruent Incongruent – Congruent
Older Block-wise 1.22 (1.18, 1.26) 0.96 (0.92, 1.00) 0.26 (0.24, 0.28), p < .001
Trial-wise 1.24 (1.19, 1.29) 1.09 (1.04, 1.14) 0.15 (0.13, 0.17), p < .001
Younger Block-wise 0.79 (0.77, 0.81) 0.62 (0.60, 0.64) 0.17 (0.16, 0.18), p < .001
Trial-wise 0.75 (0.73, 0.78) 0.67 (0.65, 0.70) 0.08 (0.07 0.09), p < .001
Threshold change can also be measured as a proportion of the overall level of caution. We defined proportional bias as the threshold for the cue-congruent accumulator divided by the sum of thresholds for both accumulators:
𝐵𝐶𝑢𝑒−𝑐𝑜𝑛𝑔𝑟𝑢𝑒𝑛𝑡⁄(𝐵𝐶𝑢𝑒−𝑐𝑜𝑛𝑔𝑟𝑢𝑒𝑛𝑡+ 𝐵𝐶𝑢𝑒−𝑖𝑛𝑐𝑜𝑛𝑔𝑟𝑢𝑒𝑛𝑡) (1)
28
Accumulation rates. Performance in terms of rates was better for older than younger participants. Matching rates were higher for older than younger participants for both levels of difficulty and bias-type. The difference between matching and mismatching rates (an index of the quality of stimulus evaluation) was larger for older than younger participants in all
conditions. We also calculated a measure of sensitivity that considers the effect of rate variability. Sensitivity was better for the older than younger participants for all conditions except for hard trials under trial-wise biasing. As expected, the difference between matching and mismatching rateswas greater for easy than for hard trials in all cases, and this effect was larger for older than younger participants under both bias-types. Sensitivity was always better for easy than for hard trials, and the sensitivity advantage for easy trials was larger for older than younger participants under both bias-types.
Startpoint noise (A) was larger for older than younger participants under both bias-types. For older participants, startpoint noise was larger under trial-wise than block-wise biasing, whereas for younger participants, startpoint noise was larger under block-wise than trial-wise biasing.
Non-decision (t0) was longer for older than younger participants under both bias-types. For older participants, non-decision time was longer under block-wise than trial-wise biasing whereas, for younger participants, it was slightly longer under trial-wise than block-wise biasing.
29 goodness-of-fit, and the parameter differences, were weaker for the DDM than the LBA model. Consistent with other DDM analyses (e.g., Dirk et al., 2017; Ratcliff et al., 2001; Ratcliff et al., 2006; Thapar et al., 2003), there was no age-related difference in startpoint noise. Hence, although age-related differences in startpoint noise results are replicable within each type of model, they differ between the LBA and DDM. The two models also differed in the effect age on drift rates under trial-wise biasing, being better for younger participants in the DDM but better for older participants in the LBA. Both models agreed that older participants had better rates under block-wise biasing.
Optimality Analysis
Bias was defined as in Equation 1, and its optimal level was calculated as a function of caution (average B), using simulation methods to determine the level of bias that maximized accuracy conditional on the estimated values of the non-threshold parameters while
maintaining caution at the observed level. An asymptotic level of bias was defined by the odds ratio (7:3) that applied for all levels of caution. Preliminary results examining various odds ratios (see Supplemental Materials) established that optimality requires more extreme biases at lower levels of caution, and that its asymptotic values are an approximately linear function of the logarithm of the odds ratios, consistent with the results of Bogacz et al. (2006) for the DDM.
Observed and optimal accuracy rates and response bias are listed in Table 3. Both age groups were less accurate than they could have been had they adjusted their response bias optimally, but older participants showed a lesser short-fall from optimal accuracy.
30 potential accuracy improvement for the older group was 1.9%, about one fifth less than the 2.4% potential improvement for the younger group. This age difference is notable in that, to the extent that older participants achieved greater accuracy than younger participants, further improvement (by more optimal bias setting) would be more difficult to attain.
Table 3. Observed (OBS) and Optimal (OPT) Accuracy (%C), and Observed and Optimal Proportional Bias—as defined in Equation (1)—as well as Asymptotic Bias (ASY).
Age-Group Bias-type %COBS %COPT BiasOBS BiasOPT BiasASY
Older Block-wise 86.8 89.0 0.443 0.389 0.415
Trial-wise 86.0 87.9 0.467 0.382 0.412
Younger Block-wise 81.5 84.8 0.438 0.353 0.392
Trial-wise 83.9 86.3 0.468 0.363 0.399
Average 86.6 87.2 0.454 0.372 0.406
Calculating optimal and observed response bias for all parameter samples per
participants, and deriving and testing their difference distributions as for the LBA parameter tests, it was found that the difference between observed and optimal bias was smaller for older than younger participants, under both block-wise biasing [older: 0.041 (0.037, 0.046); younger: 0.075 (0.070, 0.081), d = 0.034 (0.026, 0.042), p < .001] and trial-wise biasing [older: 0.076 (0.071, 0.082); younger: 0.093 (0.088, 0.099); d = 0.017 (0.009, 0.025), p
< .001], this age difference being about twice as large under block-wise than trial-wise biasing.
31 that the bias curves differed between bias-types and age groups due to differences in the non-threshold parameters (see also Figure 2 in Supplemental Materials). In particular, the
asymptotic optimal bias was closer to 0.5 for older participants, but the bias curve for
younger participants approached asymptote more quickly. This raises the question as to how each non-threshold parameter affected the bias curves so as to produce the optimality
[image:31.595.74.512.252.426.2]advantage for older participants.
Figure 6. Optimal bias curves (dark lines), asymptotic optimal bias levels (grey horizontal lines), and observed bias under block-wise (B) and trial-wise (T) biasing for older and younger participants.
32 curves, as caused by higher levels of startpoint noise, and it appears that the particularly low level of startpoint noise for younger participants in the trial-wise condition was responsible for their gain in optimality relative to older participants. However, under both block-wise and trial-wise biasing, having greater startpoint noise was more than overcome by older
participants having a higher level of caution, and hence their bias curves being closer to asymptote.
The DDM analysis replicated most of these results (see Supplemental Materials for details), including the findings that both groups were above the optimal curve, and so could, theoretically, further bias their responses toward cue-congruent targets so as to increase their accuracy and that the difference between observed and optimal bias was smaller for older than younger participants under block-wise biasing. However, the latter difference was not as strong as for the LBA, and under trial-wise biasing there was a weak tendency for younger participants to be closer to optimal than older participants.
Discussion
We examined differences between older and younger participants in the way they used base-rate information when making simple perceptual decisions. Recent studies of
33 evidence thresholds were set for more and less likely options, benchmarking participants’ performance relative to threshold settings that optimize accuracy.
In both age groups, our LBA-based analysis found base-rate neglect, but less so in the older group, so that they were closer to optimal in their use of bias to maximise accuracy. This occurred despite older participants having to make larger absolute adjustments in the threshold amount of evidence required to trigger a response (given that they are more cautious in making decisions). These results were largely replicated with the DDM, albeit with a reduced difference in optimality between the groups. Given that the LBA fit provided a better tradeoff between fit and complexity than the DDM, we have focused on the LBA results. However, an appropriately cautious conclusion acknowledging uncertainty related to the choice of model is that older participants are at least as close to optimal as younger participants.
Our results are perhaps surprising in light of findings of reduced ability of threshold setting with age, and of reduced white matter integrity with age in the fronto-striatal tracts thought to mediate threshold setting—factors that could potentially make it more difficult for older adults to flexibly adapt their evidence thresholds to base rate biases. We did find evidence of reduced flexibility in our older adults in that their advantage relative to younger adults was reduced when base-rate direction varied from trial to trial, and so when rapid threshold-adjustment was required. This condition could also be expected to reduce
sequential facilitation as—unlike under block-wise biasing—integrating trial history into the decision process could compromise optimal use of immediate target cues; but, under trial-wise biasing, older participants continued to show sequential facilitation (in association with cue validity), whereas (replicating LaBerge et al., 1970) it fell away among younger
34 history, older participants had greater noise in the startpoints of evidence accumulation
(replicating Forstmann et al., 2011), especially under trial-wise biasing; and this factor largely explained how younger participants could make up some of their optimality deficit relative to older participants under trial-wise biasing. A more direct test would be afforded by a model-based neuroscience approach (Forstmann & Wagenmakers, 2015) that assesses the association between white-matter integrity in relevant cortico-striatal tracts and differences in bias optimality when base-rate information is provided in a block-wise versus trial-wise manner, while also studying how older adults can persist in using sequential information when it compromises optimality.
Our older participants displayed greater processing efficiency in terms of both the overall rate of evidence accumulation and the quality of the information they obtained from the stimuli as measured by their ability to discriminate between correct and incorrect
35 discrimination of fine visual detail (e.g., Thapar et al., 2003), or demanding memory or cognitive control tasks (e.g., Karayanidis et al., 2011, Ratcliff et al., 2011). Under such conditions, it might also be seen that accumulation rate has a role in the effect of base-rate bias (as per Dunovan & Wheeler, 2018), and, because this could involve a fronto-parietal pathway (Mulder et al., 2012), the concept of compensatory neural (parietal) recruitment with age (Grady, 2008) could become relevant to interpretation of age-related bias effects.
A question that arises from our results is why all participants were less biased by base-rate information than is optimal. One possibility is that our definition of optimality is too narrow as it only takes account of accuracy, unlike the reward-rate definition that has been used to assess the optimality of caution setting (Bogacz et al., 2006). However, any criterion that values speed must predict bias that is greater than optimal, because that results in faster responses for the more likely stimulus, and so faster responses overall. A second possibility is that participants simply lacked sufficient experience, and that they would have become more optimal with practice. Practice has been found to improve the reward-rate optimality of caution in younger but not older participants (Starns & Ratcliff, 2010). Future experiments might examine how practice, and appropriate guidance (Evans & Brown, 2017), affects the superiority of older participants in terms of bias optimality.
36 estimate that is then used as a prior in the task.2 On this logic, by finding the base rate that results in the optimal bias that matches the observed bias, we can infer that older participants had an effective base rate of 0.62 under block-wise bias and 0.56 under trial-wise bias, whereas younger participants used a base rate of 0.55 under both bias-types.
More generally, Good’s (1983) explanation is related to findings in high-level decision making that probability information is not treated veridically (Tversky & Kahneman 1992). This link also suggests it would be interesting to contrast the manipulation we used, where base-rate information is given by description, with a manipulation where it is learned from experience. In higher-level decision making there is a gap between the effects of description and experience (Hertwig & Erev, 2009), so it is possible that a different pattern of results may be found in the present paradigm with an experience manipulation.
Finally, the superior performance of older relative to younger adults could have applications in the detection of cognitive decline from conditions such as dementia. Because most cognitive abilities diminish gradually during the latter part of life in a healthy
population, it can be difficult to detect the acceleration caused by disease processes. For disease processes that impact cognitive control, and in particular the control of thresholds, the
2 For example, suppose participants treated the information about a prior probability of 0.7 as
equivalent to one of the two stimuli occurring on 7 out of 10 draws from a binomial distribution, and suppose
they weight a prior belief that each stimulus is equally likely twice as heavily, as equivalent to the stimulus
occurring on 10 out of 20 previous occasions under a beta prior. Their posterior estimate would then be (7 + 10)
/ (10 + 20) 0.57, which is shrunk towards unbiased. An optimal bias set on this basis would appear to be less
38 References
Arnold, N. R., Bröder, A., & Bayen, U. J. (2015). Empirical validation of the diffusion model for recognition memory and a comparison of parameter-estimation methods.
Psychological Research, 79, 882-898. http://doi.org/10.1007/s00426-014-0608-y Baayen, R. H., Davidson, D. J., & Bates, D. M. (2008). Mixed-effects modeling with crossed
random effects for subjects and items. Journal of Memory and Language, 59, 390-412. http://doi.org/10.1016/j.jml.2007.12.005
Baayen, R. H., & Milin, P. (2010). Analyzing reaction times. International Journal of Psychological Research, 3, 12-28. http://doi.org/10.21500/20112084.807
Bar-Hillel, M. (1980). The base-rate fallacy in probability judgments. Acta Psychologica, 44, 211-233. http://doi.org/10.1016/0001-6918(80)90046-3
Bartoń, K. (2018). MuMIn: Multi-model inference (Version 1.42.1) [R package]. Retrieved from https://CRAN.R-project.org/package=MuMIn
Bates, D., Mächler, M., Bolker, B., & Walker, S. (2015). Fitting linear mixed-effects models using lme4. Journal of Statistical Software, 67, 1-48.
http://doi.org/10.18637/jss.v067.i01
Bogacz, R., Brown, E., Moehlis, J., Holmes, P., & Cohen, J. D. (2006). The physics of optimal decision making: A formal analysis of models of performance in two-alternative forced-choice tasks. Psychological Review, 113, 700-765.
http://doi.org/10.1037/0033-295X.113.4.700
Brown, S. D., & Heathcote, A. (2008). The simplest complete model of choice response time: Linear ballistic accumulation. Cognitive Psychology, 57, 153-178.
39 Carpenter, R. H. S., & Williams, M. L. L. (1995). Neural computation of log likelihood in
control of saccadic eye movements. Nature, 377, 59-62. http://doi.org/10.1038/377059a0
Craik, F. I. M. (1969). Applications of signal detection theory to studies of ageing. In A. T. Welford & J. E. Birren (Eds.), Interdisciplinary topics in gerontology (Vol. 4, pp. 147-157). Basel, Switzerland: Karger. http://doi.org/10.1159/000387089
Criss, A. H. (2010). Differentiation and response bias in episodic memory: Evidence from reaction time distributions. Journal of Experimental Psychology: Learning, Memory, and Cognition, 36, 484-499. http://doi.org/10.1037/a0018435
Davies, R. A. I., Arnell, R., Birchenough, J. M. H., Grimmond, D., & Houlson, S. (2017). Reading through the life span: Individual differences in psycholinguistic effects.
Journal of Experimental Psychology: Learning, Memory, and Cognition, 43, 1298-1338. http://doi.org/10.1037/xlm0000366
Di Rosa, E., Schiff, S., Cagnolati, F., & Mapelli, D. (2015). Motivation–cognition interaction: how feedback processing changes in healthy ageing and in Parkinson’s disease. Aging Clinical and Experimental Research, 27, 911-920. http://doi.org/10.1007/s40520-015-0358-8
Dirk, J., Kratzsch, G. K., Prindle, J. J., Kröhne, U., Goldhammer, F., & Schmiedek, F. (2017). Paper-based assessment of the effects of aging on response time: A diffusion model analysis. Journal of Intelligence, 5, 1-16.
40 Donkin, C., Brown, S., & Heathcote, A. (2009). The over-constraint of response time models:
Rethinking the scaling problem. Psychonomic Bulletin and Review, 16, 1129–1135. http://doi.org/10.3758/pbr.16.6.1129
Dunovan, K., & Wheeler, M. E. (2018). Computational and neural signatures of pre and post-sensory expectation bias in inferior temporal cortex. Scientific Reports, 8.
http://doi.org/10.1038/s41598-018-31678-x
Dutilh, G., Forstmann, B. U., Vandekerckhove, J., & Wagenmakers, E.-J. (2013). A diffusion model account of age differences in posterror slowing. Psychology and Aging, 28, 64-76. http://doi.org/10.1037/a0029875
Eager, C., & Roy, J. (2017). Mixed effects models are sometimes terrible. Retrieved from https://arxiv.org/abs/1701.04858
Evans, N. J., & Brown, S. D. (2017). People adopt optimal policies in simple decision-making, after practice and guidance. Psychonomic Bulletin and Review, 24, 597-606. http://doi.org/10.3758/s13423-016-1135-1
Forstmann, B. U., Brown, S., Dutilh, G., Neumann, J., & Wagenmakers, E.-J. (2010). The neural substrate of prior information in perceptual decision making: A model-based analysis. Frontiers in Human Neuroscience, 4, 40.
http://doi.org/10.3389/fnhum.2010.00040
Forstmann, B. U., Ratcliff, R., & Wagenmakers, E.-J. (2016). Sequential sampling models in cognitive neuroscience: Advantages, applications, and extensions. Annual Review of Psychology, 67, 641-666. http://doi.org/10.1146/annurev-psych-122414-033645 Forstmann, B. U., Tittgemeyer, M., Wagenmakers, E.-J., Derrfuss, J., Imperati, D., & Brown,
41 approach. Journal of Neuroscience, 31, 17242-17249.
http://doi.org/10.1523/jneurosci.0309-11.2011
Forstmann, B. U., & Wagenmakers, E.-J. (2015). An introduction to model-based cognitive neuroscience. New York, NY, US: Springer.
Fozard, J. L., Thomas, J. C., & Waugh, N. C. (1976). Effects of age and frequency of stimulus repetitions on two-choice reaction time. Journal of Gerontology, 31, 556-563. http://doi.org/10.1093/geronj/31.5.556
Good, I. J. (1983). Good thinking: The foundations of probability and its applications. Minneapolis, MN, US: University of Minnesota.
Gold, J. I., & Shadlen, M. N. (2001). Neural computations that underlie decisions about sensory stimuli. Trends in Cognitive Sciences, 5, 10-16. http://doi.org/10.1016/S1364-6613(00)01567-9
Grady, C. L. (2008). Cognitive neuroscience of aging. Annals of the New York Academy of Sciences, 1124, 127-44. http://doi.org/10.1196/annals.1440.009
Hanks, T. D., Mazurek, M. E., Kiani, R., Hopp, E., & Shadlen, M. N. (2011). Elapsed decision time affects the weighting of prior probability in a perceptual decision task.
Journal of Neuroscience, 31, 6339. http://doi.org/10.1523/jneurosci.5613-10.201 Hartley, A. (2006). Changing role of the speed of processing construct in the cognitive
psychology of human aging. In J. E. Birren & K. W. Schaie (Eds.), Handbook of the psychology of aging (6th ed., pp. 183-207). Burlington, MA, US: Elsevier.
Heathcote, A., & Love, J. (2012). Linear deterministic accumulator models of simple choice.
42 Heathcote, A., Lin, Y., Reynolds, A., Strickland, L., Gretton, M., & Matzke, D. (2018).
Dynamic models of choice. Behavior Research Methods. https://doi.org/10.3758/s13428-018-1067-y
Hertwig, R., & Erev, I. (2009). The description–experience gap in risky choice. Trends in Cognitive Sciences,13, 517-523. http://doi.org/10.1016/j.tics.2009.09.004
Kahneman, D., & Tversky, A. (1973). On the psychology of prediction. Journal of Experimental Social Psychology, 80, 237-251. http://doi.org/10.1037/h0034747 Kahneman, D., & Tversky, A. (1982). Evidential impact of base rates. In D. Kahneman, P.
Slovic, & A. Tversky (Eds.), Judgment under uncertainty: Heuristics and biases (pp. 153-160). New York, NY, US: Cambridge University Press.
Karayanidis, F., Whitson, L. R., Heathcote, A., & Michie, P. T. (2011). Variability in
proactive and reactive cognitive control processes across the adult lifespan. Frontiers in Psychology, 2. http://doi.org/10.3389/fpsyg.2011.00318
Klauer, K. C. (2010). Hierarchical multinomial processing tree models: A latent–trait approach. Psychometrika, 75, 70-98. http://doi.org/10.1007/s11336-009-9141-0 Kühn, S., Schmiedek, F., Schott, B., Ratcliff, R., Heinze, H.-J., Düzel, E., . . . Lövden, M.
(2011). Brain areas consistently linked to individual differences in perceptual
decision-making in younger as well as older adults before and after training. Journal of Cognitive Neuroscience, 23, 2147-2158. http://doi.org/10.1162/jocn.2010.21564 Kuznetsova, A., Brockhoff, P. B., & Christensen, R. H. B. (2017). lmerTest: Tests in linear
43 LaBerge, D., Van Gelder, P., & Yellott, J. (1970). A cueing technique in choice reaction
time. Perception and Psychophysics, 7, 57-62. http://doi.org/10.3758/bf03210133 Leite, F. P., & Ratcliff, R. (2011). What cognitive processes drive response biases? A
diffusion model analysis. Judgment and Decision Making, 6, 651-687.
Madden, D. J., Spaniol, J., Costello, M. C., Bucur, B., White, L. E., Cabeza, R., . . . Huettel, S. A. (2008). Cerebral white matter integrity mediates adult age differences in cognitive performance. Journal of Cognitive Neuroscience, 21, 289-302. http://doi.org/10.1162/jocn.2009.21047
Malhotra, G., Leslie, D. S., Ludwig, C. J. H., & Bogacz, R. (2017). Time-varying decision boundaries: Insights from optimality analysis. Psychonomic Bulletin and Review. http://doi.org/10.3758/s13423-017-1340-6
Mayr, U. (2001). Age differences in the selection of mental sets: The role of inhibition, stimulus ambiguity, and response-set overlap. Psychology and Aging, 16, 96-109. doi: http://doi.org/10.1037//0882-7974.16.1.96
Melis, A., Soetens, E., & van der Molen, M. W. (2002). Process-specific slowing with advancing age: Evidence derived from the analysis of sequential effects. Brain and Cognition, 49, 420-435. http://doi.org/10.1006/brcg.2001.1508
Mulder, M. J., Wagenmakers, E.-J., Ratcliff, R., Boekel, W., & Forstmann, B. U. (2012). Bias in the brain: A diffusion model analysis of prior probability and potential payoff.
Journal of Neuroscience, 32, 2335-2343. http://doi.org/10.1523/jneurosci.4156-11.2012
44 behavior, evoked potentials, and quantitative model comparison. Journal of
Neuroscience, 35, 10989–11011. http://doi.org/10.1523/jneurosci.0017-15.2015 Proctor, R. W., Vu, K.-P. L., & Pick, D. F. (2005). Aging and response selection in spatial
choice tasks. Human Factors, 47, 250-269. http://doi.org/10.1518/0018720054679425 Rabbitt, P. M. A., & Vyas, S. M. (1980). Selective anticipation for events in old age. Journal
of Gerontology, 35, 913-919. http://doi.org/10.1093/geronj/35.6.913
Ratcliff, R. (1985). Theoretical interpretations of the speed and accuracy of positive and negative responses. Psychological Review, 92, 212-225. http://doi.org/10.1037/0033-295X.92.2.212
Ratcliff, R., & McKoon, G. (2008). The Diffusion Decision Model: Theory and data for two-choice decision tasks. Neural Computation, 20, 873-922.
http://doi.org/10.1162/neco.2008.12-06-420
Ratcliff, R., & McKoon, G. (2015). Aging effects in item and associative recognition memory for pictures and words. Psychology and Aging, 30, 669-674.
http://doi.org/10.1037/pag0000030
Ratcliff, R., Thapar, A., & McKoon, G. (2001). The effects of aging on reaction time in a signal detection task. Psychology and Aging, 16, 323-341.
http://doi.org/10.1037//0882-7974.16.2.323
Ratcliff, R., Thapar, A., & McKoon, G. (2006). Aging, practice, and perceptual tasks: A diffusion model analysis. Psychology and Aging, 21, 353-371.
45 Ratcliff, R., Thapar, A., & McKoon, G. (2011). Effects of aging and IQ on item and
associative memory. Journal of Experimental Psychology: General, 140, 464-487. http://doi.org/10.1037/a002381
Ratcliff, R., Thapar, A., Smith, P. L., & McKoon, G. (2005). Aging and response times: A comparison of sequential sampling models. In J. Duncan, L. Phillips, & P. McLeod (Eds.), Measuring the mind: Speed, control, and age (pp. 3-31). Oxford, UK: Oxford University Press. http://doi.org/10.1093/acprof:oso/9780198566427.003.0001
Salthouse, T. A. (2016). Little relation of adult age with cognition after controlling general influences. Developmental Psychology, 52, 1545-1554.
http://doi.org/10.1037/dev0000162
Schuch, S. (2016). Task inhibition and response inhibition in older vs. younger adults: A diffusion model analysis. Frontiers in Psychology, 7.
http://doi.org/10.3389/fpsyg.2016.01722
Silverman, I. (1963). Age and the tendency to withhold response. Journal of Gerontology, 18, 372-375. http://dx.doi.org/10.1093/geronj/18.4.372
Simen, P., Contreras, D., Buck, C., Hu, P., Holmes, P., & Cohen, J. D. (2009). Reward rate optimization in two-alternative decision making: Empirical tests of theoretical predictions. Journal of Experimental Psychology: Human Perception and Performance, 35, 1865-1897. http://doi.org/10.1037/a0016926
46 Smith, G. A., & Brewer, N. (1995). Slowness and age: Speed-accuracy mechanisms.
Psychology and Aging, 10, 238-247. http://doi.org/10.1037/0882-7974.10.2.238 Spaniol, J., Madden, D. J., & Voss, A. (2006). A diffusion model analysis of adult age
differences in episodic and semantic long-term memory retrieval. Journal of Experimental Psychology: Learning, Memory, and Cognition, 32, 101-117. http://doi.org/10.1037/0278-7393.32.1.101
Spiegelhalter, D. J., Best, N. G., Carlin, B. P., & van der Linde, A. (2014). The deviance information criterion: 12 years on. Journal of the Royal Statistical Society: Series B (Statistical Methodology), 76, 485-493. http://doi.org/10.1111/rssb.12062
Starns, J. J., & Ratcliff, R. (2010). The effects of aging on the speed-accuracy compromise: Boundary optimality in the diffusion model. Psychology and Aging, 25, 377-390. http://doi.org/10.1037/a0018022
Starns, J. J., & Ratcliff, R. (2012). Age-related differences in diffusion model boundary optimality with both trial-limited and time-limited tasks. Psychonomic Bulletin and Review. http://doi.org/10.3758/s13423-011-0189-3
Thapar, A., Ratcliff, R., & McKoon, G. (2003). A diffusion model analysis of the effects of aging on letter discrimination. Psychology and Aging, 18, 415-429.
http://doi.org/10.1037/0882-7974.18.3.415
Tversky, A., & Kahneman, D. (1992). Advances in prospect theory: Cumulative representation of uncertainty. Journal of Risk and Uncertainty, 5, 297-323. http://doi.org/10.1007/BF00122574
47 performance and an empirical test. Frontiers in Psychology, 3.
http://doi.org/10.3389/fpsyg.2012.00132
Van Zandt, T., Colonius, H., & Proctor, R. W. (2000). A comparison of two response time models applied to perceptual matching. Psychonomic Bulletin and Review, 7, 208-256. http://doi.org/10.3758/bf03212980
Verhaeghen, P., Steitz, D. W., Sliwinski, M. J., & Cerella, J. (2003). Aging and dual-task performance: A meta-analysis. Psychology and Aging, 18, 443-460.
http://doi.org/10.1037/0882-7974.18.3.443
Voss, A., Rothermund, K., & Voss, J. (2004). Interpreting the parameters of the diffusion model: An empirical validation. Memory and Cognition, 32, 1206-1220.
http://doi.org/10.3758/BF03196893
Welford, A. T. (1977). Motor performance. In J. E. Birren & K. W. Schaie (Eds.), Handbook of the psychology of aging (pp. 450-496). New York, NY, US: Van Nostrand
Reinhold.
White, C. N., & Poldrack, R. A. (2014). Decomposing bias in different types of simple decisions. Journal of Experimental Psychology: Learning, Memory, and Cognition, 40, 385-398. http://doi.org/10.1037/a0034851
Whitson, L. R., Karayanidis, F., Fulham, R., Provost, A. L., Michie, P. T., Heathcote, A., & Hsieh, S. (2014). Reactive control processes contributing to residual switch cost and mixing cost in young and old adults. Frontiers in Psychology.
http://doi.org/10.3389/fpsyg.2014.00383
48 adults. Neuropsychologia, 66, 246-258.