Overstating Value Change:
Question Ordering in the
Postmaterial Values Index
Bruce Tranter and Mark Western
In much of his research on intergenerational value change, Inglehart uses a four-item index to calculate levels of postmaterial and material value orientations. Latter waves of the World Values Surveys administer a 12-item values index in which the original four-item index is embedded. In some of his research, Inglehart compares values estimated from stand-alone and embedded indices. Using a split sample design, we administered two versions of the longer values index to national probability samples of Australian adults and detected question-ordering effects. Proportions of postmaterialists relative to materialists were inflated when the four-item index was embedded in the longer values index. Comparing estimates of postmaterial values from stand-alone indices with indices embedded in the longer values measure is an unreliable method of assessing change in value orientations, as it overestimates the magnitude of value change over time.
Introduction
Ronald Inglehart’s thesis of generational-based values has been influential in political science since the early 1970s (Inglehart, 1971, 1977, 1990, 1997). Inglehart has argued that value priorities are shifting profoundly, from concern over economic and physical security towards quality of life and freedom of self-expression. He claims the key to understanding political prefer-ences and behaviour lies in childhood socialization, as early experiences influence the formation of differ-ent value priorities (Inglehart, 1977, p. 23). Growing up under circumstances of relative economic affluence and physical safety leads one to prioritize quality of
life, postmaterial values over materialist (economic)
values. Alternatively, experience of economic hardship, war, or major social and political upheaval contributes
to the development of materialist values (Inglehart,
1977, p. 23).
Since values are formed in childhood and early adolescence, and tend to remain relatively stable over the lifecourse (Inglehart, 1997, p. 34, 46), generation-based value differences should be apparent when examining birth cohorts. According to Inglehart (1990, p. 76), younger generations—particularly those born after WWII—tend to prioritize postmaterialist values due to their relative affluence and freedom from external physical threats during their ‘formative years’. Citizens of advanced Western nations are becoming increasingly postmaterialist, as younger postmaterialist ‘generations’ gradually replace older materialist gen-erations (Inglehart, 1997, p. 326).
Some of Inglehart’s claims regarding intergenera-tional values shift are based on data from the World
DOI:10.1093/esr/jcp040, available online at www.esr.oxfordjournals.org
ßThe Author 2009. Published by Oxford University Press. All rights reserved. For permissions, please e-mail: [email protected]
at University of Tasmania Library on March 18, 2010
http://esr.oxfordjournals.org
Values Surveys (WVS), administered in 1981, 1990– 1991, 1995–1998, 1999–2000 and 2005 (European Values Study Group and World Values Survey Association, 2006). In the first WVS, Inglehart employed the four-item values battery, where respon-dents were asked to choose the most important and second most important national goals from the following list:
1. Maintain order in the nation
2. Give people more say in important government decisions
3. Fight rising prices 4. Protect freedom of speech
Respondents who choose options 1 and 3 were deemed ‘materialists’ and options 2 and 4 as ‘post-materialists’ (Inglehart, 1977, p. 28). The largest category of inconsistent value combinations was clas-sified as ‘mixed’.
The four-item values index has been used extensively by survey researchers in a variety of countries (e.g. Abramson and Inglehart, 1986, 1995; Inglehart and
Abramson, 1994; de Graaf et al., 1996; Blake et al.,
1997; Layman et al., 1997; Fuchs and Rohrschneider,
1998; Davis and Davenport, 1999). However,
Inglehart’s value change thesis has been criticized on several fronts, particularly in relation to the validity of his conception of material–postmaterial values and the measurement of the four-item index (e.g. Jagodzinski, 1982; Flanagan, 1982a,b; 1987; Clarke and Dutt, 1991; Duch and Taylor, 1993, 1994; Bean and Papadakis, 1994; Brown and Carmines, 1995; Clarke, Dutt and Rapkin, 1997; Davis and Davenport, 1999;
Clarkeet al., 1999; Clarke, 2000; Moors and Vermunt,
2007).
For example, Clarke and Dutt (1991) maintain high unemployment leads to higher levels of postmaterial values, rather than the reductions posited by the values change thesis, while Inglehart’s short index measures pro-democratic orientations according to Duch and Taylor (1993). Flanagan (1982a) lists several problems with the short index. He argues that the scale measures ‘two separate dimensions of value change’ and that the ‘items Inglehart uses to construct his scale are better characterized as indicators of a respondent’s issue priorities than basic values’ (Flanagan, 1982a, p. 429). In his assessment of the link between education and postmaterial values, Warwick (1998, p. 603) suggests the ‘findings clearly support the notion that the original index registers support for democratic princi-ples in particular, and not simply a more general postmaterialism’. Finally, for Clarke (2000, p. 481), the short index is a ‘seriously flawed instrument for
measuring values and value change in advanced industrial (and other) societies’ due to its ‘sensitivity to prevailing economic conditions’, while Tranter and Western (2009, p. 164) show that the short index is subject to contextual effects; finding ‘younger genera-tions are more likely to develop postmaterial values in countries where Green parties are represented than would be the case from generational replacement alone’.
Not known to miss an opportunity to counterattack, Inglehart has defended his value shift thesis vigorously (e.g. see Abramson and Inglehart, 1994; Inglehart and Abramson, 1994; Abramson and Inglehart, 1995; Abramson, Ellis and Inglehart, 1997; Inglehart, 1997; Inglehart and Abramson, 1999). Inglehart (1981, p. 887) acknowledges that what he refers to as ‘period effects’ (such as variation in the inflation and unemployment rates) do impact on levels of postmaterial values in the short term. However, in
answer to his critics, he maintains ‘one’s formative
experiences seem to have a considerably greater
impact on Materialist/Postmaterialist values than
the individual’s educational level’ (Inglehart, 1997, p. 154), and that the short index ‘has proven to be a very useful indicator of values’ since 1970. He further contends that on ‘the usual tests of validity’ the index ‘has performed remarkably well’, while
the ‘dimensional structure of the measure. . .has a
theoretically coherent structure across a wide range of countries’ (Inglehart and Abramson, 1994, p. 350).
While in this research we are also critical of the short index, our research has additional implications for the reliability and validity of Inglehart’s longer instrument. The four-item index has been adminis-tered extensively in surveys, although Inglehart devel-oped additional questions with the aim of producing ‘a more reliable and valid indicator of values’ than the short index (Abramson and Inglehart, 1995, p. 22), particularly when applied in cross-national context (Abramson and Inglehart, 1995, p. 121). The longer index consists of three separate batteries of questions, each with four responses. Each respective battery contains two materialist and two postmaterialist items, with five of the items used to form a postmaterial values scale (Inglehart, 1997, p. 389; see
our Appendix A).1 The longer index is included in
the second and subsequent waves of the WVSs for several countries. The four original values items are also contained in the 12-item battery, allowing Inglehart to measure shifts in value priorities over time using successive waves of the WVS based upon the short index (e.g. Inglehart, 1997, p. 157; Abramson and Inglehart, 1995, p. 135).
at University of Tasmania Library on March 18, 2010
http://esr.oxfordjournals.org
Question-Ordering Problems
The point of departure for our research lies in the fact that for several countries in the second and subsequent waves of the WVSs and elsewhere, the original four values items were administered as the second battery (Inglehart, 1997, pp. 415–416; Abramson and Inglehart, 1986, pp. 3–4; and see our
Appendix A).2 That is, the original four-item values
responses were directly preceded and followed by other questions designed to measure value priorities (Inglehart, 1997, pp. 108–113). As expected, responses to the individual values items on the longer index are correlated (Inglehart and Abramson, 1999, p. 668). That is, postmaterialists on the first battery are likely to choose postmaterialist items on subsequent bat-teries, and materialists to choose materialist items.
However, we hypothesize that the design of the 12-item index is likely to induce question-ordering effects. This occurs when the four items that comprise the original index are included as a component of the longer 12-item values index, because they are preceded by other correlated values questions. We argue that responses on the four-item index are influenced by the way respondents answer the values questions that immediately precede them. This has particular implications for the reliability and validity of the four-item index when it is used to measure value change over time.
Our argument about question ordering derives in part from Inglehart’s own arguments about the relationships between materialist and postmaterial values, while the possibility of question-ordering effects associated with the presence of high-valence material issues are prompted by inspection of some of the data used by Inglehart. As Inglehart (1990, p. 75) has noted, the four-item index represents a continuum, with the mixed category consisting of individuals whose values are a combination of materialist and postmaterialist types, while the extremes represent ‘pure materialists’ and ‘pure postmaterialists’. The apparent inconsistency of values choices held by respondents in the ‘mixed’ category could result from the fact that they genuinely hold mixed values—that they fall at an intermediate point on the continuum between ‘pure materialists’ and ‘pure post materialists’. This inconsistent or ‘mixed’ response, however, could also indicate unreliability. Pure mate-rialist and postmatemate-rialist respondents on the four-item index, by definition, have produced more reliable responses than those in the mixed category, because they have answered consistently in terms of responses to values items on two occasions. However, if at least
some of the mixed category represents unreliability of response, this category, in particular, is susceptible to non-sampling error, such as question-ordering effects.
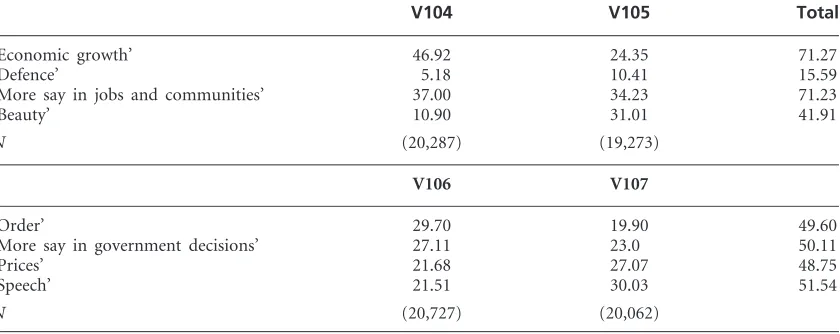
What might such effects look like? Inspection of the raw data for the advanced industrialized countries we analyse show that there are two valence issues in the first battery of the 12-item index: ‘Maintain a high level of economic growth’ and ‘See that people have more say about how things are done at their jobs and in their communities’. In the second wave of the WVS, for the 12 advanced industrialized countries analysed here, ‘economic growth’ was chosen as either first or second response by 71 per cent of respondents and ‘more say’ by 71 per cent, compared to 42 per cent for ‘beauty’ and 16 per cent for ‘defence’ (Table 1). By contrast, the distribution of responses for the second battery items is far more evenly spread (‘Speech’ 52 per cent; ‘Order’ 50 per cent; ‘More say’ 50 per cent and ‘Prices’ 49 per cent).
If responses remain stable between the first and
second battery (i.e. first battery postmaterialists
choose postmaterialist combinations of items on the second battery; mixed on the first battery choose mixed combinations on the second, and materialists on the first battery choose materialist combinations on the second), values estimates based upon the short index will not be influenced when estimates are based on the 12-item index. However, if there is a drift towards either materialist or postmaterialist choices on the second battery, the proportions of postmaterialists to materialists will be influenced.
If part of this ‘drift’ reflects question-ordering effects associated with responses on the different batteries, the classification of value orientations based on the four-item index will be susceptible to whether the short index appears first or second in the three sets of values batteries in the questionnaire. If occurring second is associated with an increased probability of being postmaterialist, or indeed a decreased probability of being materialist (a finding which would also be consistent with Inglehart’s thesis of the growth of postmaterial values over time), then we have to acknowledge the possibility that item-ordering effects are inflating the postmaterialist category.
One possible mechanism for a drift from materialist to postmaterialist responses is derived from Inglehart’s own explanation of value prioritisation. Both Maslow (1954) and Inglehart—drawing upon Maslow—assert a fundamental need for safety and security. In times of political stability, economic security rather than national security will tend to dominate as a salient issue. Economic growth is therefore a high-valence
at University of Tasmania Library on March 18, 2010
http://esr.oxfordjournals.org
item in the first battery, while defence is not. Importantly, respondents are also asked to rank their value priorities with the ordinal nature of the question requiring respondents to nominate their first priority then their second.
In the second battery, the format is similar to the first, with comparable question items and a further instruction for respondents to rank their value priorities. The distribution of responses indicates that the items in the second battery are preferred almost equally by respondents (Table 1), with no high-valence issues. It is plausible in this framework that some respondents believe they are being asked about second-order priorities, and having articu-lated a security response (i.e. economic growth) on the first battery, choose postmaterialist items on the second battery, particularly when one of the second battery materialist items (i.e. fight rising prices) is less relevant in times of low inflation. This kind of mechanism would account for a ‘drift’ from
[image:4.536.59.479.68.235.2]materialist to postmaterialist responses in the second battery, which is the pattern we observe below. More importantly, however, even if our hypothesized ‘drift’ mechanism does not hold, experimental data relating to question ordering that we present below show unambiguously that a question-ordering effect prevails. When the four-item index is presented second, as Inglehart does in wave 2 of the WVS, estimates of the percentage of postmaterialists are significantly higher than when the index is presented as the first battery of items. If question-ordering effects are apparent, comparing values estimates from the stand-alone four-item index with those from the 12-item index—as Inglehart does when comparing different waves of the WVS (e.g. Inglehart, 1997, p. 157; Abramson and Inglehart, 1995, p. 135) and comparing estimates from the WVS to other data (e.g. Inglehart and Welzel, 2005, p. 103)—will misrep-resent the magnitude of any values shift that may be occurring.
Table 1 Responses to Inglehart’s WVS Questions for 12 advanced industrialized countries (per cent)
V104 V105 Total
‘Economic growth’ 46.92 24.35 71.27
‘Defence’ 5.18 10.41 15.59
‘More say in jobs and communities’ 37.00 34.23 71.23
‘Beauty’ 10.90 31.01 41.91
N (20,287) (19,273)
V106 V107
‘Order’ 29.70 19.90 49.60
‘More say in government decisions’ 27.11 23.0 50.11
‘Prices’ 21.68 27.07 48.75
‘Speech’ 21.51 30.03 51.54
N (20,727) (20,062)
Notes: WVS questions:
‘There is a lot of talk these days about what the aims of this country should be for the next ten years. On this card are listed some of the goals which different people would give top priority. Would you please say which one of these you, yourself, consider the most important? And which would be the next most important?’
V104 and V105
1. Maintaining a high level of economic growth. 2. Making sure this country has strong defence forces.
3. Seeing that people have more to say about how things are done at their jobs and in their communities. 4. Trying to make our cities and countryside more beautiful.
V106 and V107
1. Maintaining order in the nation.
2. Giving people more to say in important government decisions. 3. Fighting rising prices.
4. Protecting freedom of speech.
Countries in analyses were Belgium, Britain, Canada, France, Ireland, Italy, Japan, Netherlands, Norway, Spain, USA, and West Germany. Source: World Values Surveys (1990).
at University of Tasmania Library on March 18, 2010
http://esr.oxfordjournals.org
Data and Method
Two sources of data are drawn upon. Data from selected countries from the second wave of the WVS (European Values Study Group and World Values Survey Association, 2006) are examined in regression analyses to assess the association between responses on the first set of questions in the 12-item battery and the original four-item index. We analyse data from the 12 advanced industrialized countries Inglehart (1997, p. 157; Table 5.2) presents as evidence of a
values shift in Modernization and Postmodernization,
to illustrate the possibility of question-ordering effects in the WVS. We disaggregate the 12 possible values combinations to construct dummy variables from the first battery items of the 12-item index (i.e. ‘maintain a high level of economic growth’; ‘make sure this country has strong defence forces’; ‘see that people have more say about how things are done at their jobs and in their communities’; ‘try to make our cities and countryside more beautiful’).
The second set of data are from the 2003 Australian Survey of Social Attitudes (AuSSA), administered as a national mail out, mail back survey between 3 August 2003 and 24 December 2003 to a sample systematically
selected from the 2002 Australian electoral roll.3It has
4270 respondents. The overall response rate for the combined AuSSA sample was 44 per cent, comprising
43 per cent for sub-sample A, (N¼2087) and 45 per
cent for sub-sample B (N¼2183).4 Two versions of
Inglehart’s 12-item index were administered to sepa-rate samples of the Australian adult population (i.e. aged 18 and over). Survey respondents were randomly assigned to ‘control’ or ‘experimental’ samples. Control sample questions appeared in the format Inglehart and his collaborators administered in latter waves of the WVS (see Inglehart, 1997, p. 415 and our Appendix A). For the experimental group the order of the first two batteries was changed so that the orig-inal four items appeared first (see our Appendix B). A pilot study of students from the University of Tasmania, Australia showed the test group exhibited higher levels of materialism and lower levels of postmaterialism than the experimental group. We expected to find a similar association in the national survey.
Values responses from the two AuSSA sub-samples are examined using cross-tabulations and regression analyses. We construct the four-item values index fol-lowing Inglehart (1997, p. 389) calculating the percentages of materialists and postmaterialists, and those with mixed values. Following Abramson and Inglehart (1995, p. 12), we calculate percentage
difference indexes (PDIs) comprising the percentage of postmaterialists minus the percentages of materi-alists. Positive values on the PDI indicate a higher proportion of postmaterialists over materialists. Also following Inglehart (Inglehart and Abramson, 1999, p. 672), we use OLS regression to model the four-item values index. We also replicate our OLS analyses with ordered logit regression to better capture the four-item index’s ordinal structure. We consider the impact of question ordering on values, while following Inglehart and Abramson (1999, p. 672) we control for sex (women), age (in years), bachelor or postgrad-uate degree, church attendance (weekly or more often), professional occupation, income (less than Aus$32,000), location in a large city and self-assessed middle class. We also control for country of birth (i.e. born in the United Kingdom; born in countries other than Australia) to account for the different formative experiences of migrants. With the exception of age, all independent variables are scored 1/0 (see Appendix C). We do not replace missing cases with two exceptions: although not reported in the regres-sion table, dummy variables are included to represent missing cases on income and occupation.
Value Shift in Advanced
Industrialized Countries
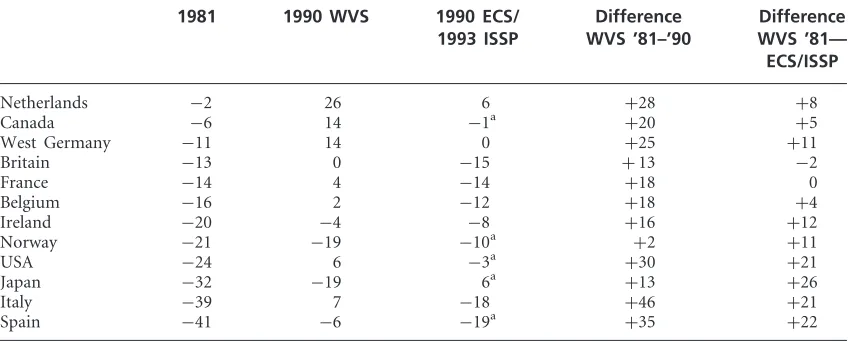
We begin our analysis by comparing values estimates for several advanced industrialized countries using data from the WVS and other international surveys. The first two columns of Table 2 show PDI estimates reproduced from Inglehart (1997, p. 157; Table 5.2). On the basis of the WVS estimates, as Inglehart (1997, p. 156) puts it, a ‘generalised shift toward post-materialist values seems to be taking place’. However, when PDIs for these countries are estimated with data collected from other sources with stand-alone four-item index measures (i.e. the 1990 Eurobarometer and the 1993 International Social Survey Program
surveys), what sort of pattern emerges? Once
again, for the Netherlands, Canada, Ireland, Italy, Spain, the United States, Belgium, the former West Germany, Japan, and Norway, there was a shift
towards postmaterialism as Inglehart predicted.
However, the magnitude of the shift was considerably smaller for most of these countries using alternative
data sources to the WVS.5
For the vast majority of these countries the 1990 WVS appears to overstate the shift towards post-material values compared to estimates from other
respected international surveys.6Importantly, the 1990
at University of Tasmania Library on March 18, 2010
http://esr.oxfordjournals.org
Eurobarometer and the 1993 ISSP surveys included
the short values index as a stand-alone index, not as
a component of the 12-item index. So does the order in which values questions are asked influence responses on the short values index?
In Table 3, we further interrogate the WVS data to examine the association between the first battery of questions in the 12-item index and the 4-item index. Following Inglehart and Abramson (1999) we use OLS regression analysis where the short index is operatio-nalized as a scale-dependent variable and dummy variables represent the 12 possible values combinations from the first battery (ordered logit regression results are also presented). Dummy variables for ‘economic growth’ and ‘defence’ are omitted from the regression equation as they represent the ‘pure materialist’ reference category. We contrast the two ‘pure post-materialist’ options ‘more say in jobs and commu-nities’ and ‘beautiful cities and countryside’ and all mixed values combinations against the pure materialist reference category.
As values are conceptualized as a continuum (Inglehart, 1990, p. 75), we hypothesize that the pure postmaterialist dummy variables should score higher than the mixed categories (i.e. more postmaterialist) on the four-item PDI-dependent variable and higher than pure materialists. We also expect that mixed values combinations where a postmaterialist item was chosen as first choice (labelled ‘first choice postmaterialists’), should score higher than mixed
combinations where materialist items were the first choice (labelled ‘first choice materialists’).
The results indicate, as expected, that both pure postmaterialist dummy variables score considerably higher than the pure materialist reference category
(P50.0001), although the ‘say and beauty’ variable
scores somewhat higher (b¼46.4) than the ‘beauty
and say’ combination (b¼33.9). However, although
the ‘say and growth’ and ‘say and defence’ first-choice postmaterialist dummies also score highly on the dependent variable, a monotonic pattern is not apparent for the values combinations. Notably, the estimate for the first-choice postmaterialist ‘say and
growth’ (b¼38.6) variable is higher than the pure
postmaterialist combination ‘beauty and say’. The first-choice materialist combination ‘growth and say’
esti-mate (b¼24.0) is also of similar magnitude to the
‘say and defence’ combination (b¼23.1). Furthermore,
the effects for ‘beauty and defence’ and ‘defence and beauty’ are weak and non-significant, whereas if the values scale is a continuum, both should score substantially higher than the materialist reference category.
[image:6.536.55.481.66.237.2]Importantly, all values combinations that include the ‘more say’ and ‘economic growth’ options exhibit relatively high scores on the dependent variable. This suggests one explanation of the question-ordering effect. As the results in Table 1 indicate, the materialist item ‘economic growth’ was the most popular first-choice option in the first values battery of equal Table 2 Postmaterial values in 12 countries (PDI)
1981 1990 WVS 1990 ECS/ 1993 ISSP
Difference WVS ’81–’90
Difference WVS ’81— ECS/ISSP
Netherlands 2 26 6 þ28 þ8
Canada 6 14 1a þ20 þ5
West Germany 11 14 0 þ25 þ11
Britain 13 0 15 þ13 2
France 14 4 14 þ18 0
Belgium 16 2 12 þ18 þ4
Ireland 20 4 8 þ16 þ12
Norway 21 19 10a þ2 þ11
USA 24 6 3a þ30 þ21
Japan 32 19 6a þ13 þ26
Italy 39 7 18 þ46 þ21
Spain 41 6 19a þ35 þ22
Notes: PDI is the proportion of postmaterialists minus the proportion of materialists.
aWhere 1990 Eurobarometer data were not available, estimates are from the 1993 ISSP Environment Module.
Source: 1981 and 1990 WVS estimates from Inglehart (1997, p. 157); Table 5.2; European Community Surveys 1990 from Abramson and Inglehart (1995, pp. 12–15); Table 2.1; International Social Science Programme (1993).
at University of Tasmania Library on March 18, 2010
http://esr.oxfordjournals.org
importance to the postmaterialist option ‘more say’ in overall terms. We posit that after satisfying their economic concerns by choosing ‘economic growth’ in the first battery, respondents are ‘freed up’ to choose postmaterialist items in the short index. This boosts levels of postmaterial values as measured by the short index when it is embedded in the middle of the 12-item values index.
These international results, while not a direct test, suggest that question-ordering effects are apparent in the 12-item index in the WVS. This would not be problematic for the measurement of value change if estimates from the 4-item or 12-item indexes were employed consistently in time series comparisons. However, it is a potential problem when values esti-mates from stand-alone four-item indices are com-pared to estimates calculated from the four-item index when it is a component of the longer values index, as done by Inglehart (e.g. Inglehart and Welzel, 2005, p. 103, Figure 4.3; Inglehart, 1997, p. 157, Table 5.2; Abramson and Inglehart, 1995, p. 135, Table 8.2).
Testing for Question-Ordering
Effects in Australia
On the basis of pilot testing, we hypothesized levels of postmaterialism should be higher among the ‘control’
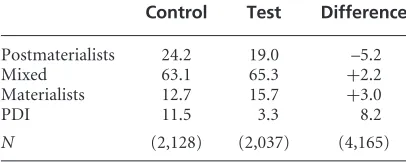
group than the ‘experimental’ group. Questions administered in the control sample from the AuSSA data resulted in a PDI of 11.5, suggesting that
Australians are highly postmaterialist (Table 4).
However, when questions from the original four-item battery were listed first in the test sample (see Appendix B), the PDI was only 3.3. Once again, the test sample results indicate that Australia is a some-what postmaterialist country, but far less so than estimates from the control sample. Binary logistic regression (not shown) indicates the likelihood of being postmaterialist as opposed to materialist is 57 per cent higher in the control sample compared to the test sample (odds ratio 1.57) and highly
[image:7.536.57.496.68.258.2]statistically significant (P50.001).
Table 3 Regression of short item index on first battery value combinations
B SE Logit SE
Intercept(1) 31.90 2.25 2.42 0.08
Intercept(2) – – 0.42 0.08
More say & Beauty (Pure Postmaterialists) 46.38 1.95 1.47 0.07
Beauty & More Say (Pure Postmaterialists) 33.85 2.63 1.07 0.09
More say & Econ. Growth (first choice P.M.) 38.56 1.89 1.20 0.07
More say & Defence (first choice P.M.) 23.05 3.14 0.71 0.11
Beauty & Economic Growth (first choice P.M.) 11.07 2.74 0.33 0.09
Beauty & Defence (first choice P.M.) 5.84 5.22 0.13 0.18
Econ. Growth & More Say (first choice Mat.) 24.00 1.79 0.74 0.06
Economic Growth & Beauty (first choice Mat.) 9.74 2.00 0.29 0.07
Defence & More Say (first choice Mat.) 9.96 3.77 0.30 0.13
Defence & Beauty (first choice Mat.) –1.38 4.67 –0.07 0.16
Growth & Defence (Pure Materialists) 0 – 1 –
Defence & Growth (Pure Materialists) 0 – 1 –
R2(Nagelkerke R2) 0.09 0.09
N (18,677) (18,677)
Notes: Countries included in analyses were Belgium, Britain, Canada, France, Ireland, Italy, Japan, Netherlands, Norway, Spain, USA, and West Germany. Dependent variable for OLS scored –100 Materialists; 0 Mixed; 100 Postmaterialists. Ordered logit regression-dependent variable scored 3 Materialists; 2 Mixed; 1 Postmaterialists.
P50.0001; P50.01.
Source: World Values Surveys (1990).
Table 4 Postmaterial values from the four- item index, test and control groups (per cent)
Control Test Difference
Postmaterialists 24.2 19.0 –5.2
Mixed 63.1 65.3 þ2.2
Materialists 12.7 15.7 þ3.0
PDI 11.5 3.3 8.2
N (2,128) (2,037) (4,165)
Source: Australian Survey of Social Attitudes (2003).
at University of Tasmania Library on March 18, 2010
http://esr.oxfordjournals.org
[image:7.536.278.481.353.434.2]To examine if these question-ordering effect hold after controlling for a range of social background factors we present regression results (Table 5). As Inglehart (1990, p. 75) has noted, the four-item index represents a continuum. We therefore follow Inglehart (e.g. Inglehart and Abramson, 1999, p. 670; Abramson and Inglehart, 1995, p. 13) in operationaliz-ing the four-item index as a continuous dependent variable, scored –100 for materialists, 0 for the mixed category, and 100 for postmaterialists. We also replicate our OLS regression analyses using ordered logit models to better capture what some may see as the ordinal structure of the four-item index. The OLS results show the PDI in the control sample is 8.5 points higher than the test sample even controlling for education and other social background effects. The highly significant effect for the control sample in the logit model confirms this pattern.
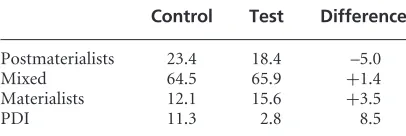
Predicted percentages preferred from the logit model illustrate the question-ordering effect very clearly. In Table 6, all covariates in the logit equation have been set to their sample means, with ‘preferred’ the exception of the treatment variable indicating test or control sample. These percentages, therefore, adjust for any compositional differences between the test and control samples and reflect only the effects of question ordering. As can be seen, the model predicts 23 per cent of respondents in the control sample as postmaterialists and 12 per cent as materialists,
implying a PDI of 11.3. In the test sample, in which the first two item batteries appear in reverse order, 18.4 per cent of respondents are postmaterialist, and 15.6 per cent are materialist yielding a PDI of 2.8. Because the covariates are controlled, the difference in PDIs between the two samples is only attributable to question ordering.
The Australian data therefore provide very strong evidence of a question-ordering effect in the 12-item index leading to an overestimation of the level of postmaterialism in the four-item index. By estimating proportions of materialist and postmaterialist values when the four-item index is a component part of the longer index, Australians would be judged to be
con-siderably more postmaterialist than they would
[image:8.536.54.481.67.258.2]be based upon data from a stand-alone four-item index. Our results suggest that question-ordering Table 5 Influence of question-ordering effects upon four-item index (OLS and ordered logits)
B SE Logit SE
Intercept 2.54 3.94 1.49 0.14
(Intercept 2) – – 1.68 0.14
‘Control’ sample 8.47 1.92 0.30 0.07
Women 1.67 2.02 0.059 0.07
Age (years) 0.32 0.07 0.001 0.002
Degree 16.13 2.79 0.57 0.10
Religious Attendance 11.90 2.79 0.42 0.10
Professional Occupation 5.32 2.80 0.18 0.10
Income (5$32,000) 2.39 2.22 0.09 0.08
Live Inner Metropolitan 4.81 2.22 0.17 0.08
Middle Class 3.74 2.09 0.13 0.07
Born in the UK 5.94 3.54 0.20 0.12
Born in other countries 3.94 2.75 0.15 0.10
R2(and Nagelkerke R2) 0.03 0.04
N (3,718) (3,718)
Notes: Dependent variable scored –100 Materialists; 0 Mixed; 100 Postmaterialists. For ordered logit regression-dependent variable scored 3 Materialists; 2 Mixed; 1 Postmaterialists.
P50.0001;P50.05.
Source: Australian Survey of Social Attitudes (2003).
Table 6 Postmaterial values from the four-item index, test and control groups (predicted probabilities)
Control Test Difference
Postmaterialists 23.4 18.4 –5.0
Mixed 64.5 65.9 þ1.4
Materialists 12.1 15.6 þ3.5
PDI 11.3 2.8 8.5
Source: Australian Survey of Social Attitudes (2003).
at University of Tasmania Library on March 18, 2010
http://esr.oxfordjournals.org
[image:8.536.275.478.349.417.2]effects are also likely in the WVS. The implication is that the magnitude of the value shift calculated by Inglehart is misrepresented when PDI estimates from the longer index are compared to estimates from the stand-alone short index (e.g. Inglehart, 1997, p. 157). Based on the Australian analyses, it seems likely that the WVS overestimates the PDI in favour of post-materialism in other countries as well, although without formal split sample tests conducted elsewhere, we are unable to assess this hypothesis directly.
Conclusions
Using a split sample survey administered to a large probability sample of Australian adults, we find evidence of question-ordering effects in Inglehart’s 12-item values index. Question-ordering effects in Australia—and it seems likely that similar patterns may exist in other countries as well—result in an overestimation of postmaterialists relative to materi-alists, when the short values index is included as the second battery of questions within Inglehart’s longer 12-item values index.
We hypothesize that a drift occurs from mixed responses on the first battery of value orientation questions in the 12-item values measure, towards
postmaterial items on the subsequent four-item
index. This drift increases the probability of classifica-tion as postmaterialists, thereby inflating the propor-tion of respondents classified as ‘postmaterialist’, for example, in the second wave of the WVS. Our research suggests the likelihood of question-ordering effects in the second and subsequent waves of the WVS for several countries, or whenever the 12-item values questions are administered in the order favoured by Inglehart (1997).
The question-ordering effects that were detected for Australia may not appear to be particularly large. However, when Inglehart measures the shift from materialism to postmaterialism (e.g. Inglehart, 1997, p. 157), he typically does so by calculating PDI, then comparing PDI at different time points to test for shifts in value orientations. In this context, a PDI change of the magnitude we have shown to be due to question ordering in Australia would almost certainly be judged large enough by Inglehart to constitute evidence of a societal shift towards post-materialism. If estimations of value orientations based upon the 12-item index are flawed as we suspect, researchers who use this measurement instru-ment to establish the extent of alleged ‘value shifts’ will miscalculate the magnitude of such shifts. This is
a particular problem when estimates from surveys utilizing the short values index (e.g. the first wave of the WVS) are compared to those based upon the longer index (e.g. subsequent waves of the WVS).
We recognize that our study does not undermine Inglehart’s claims of intergenerational values shift, as much of the evidence he has presented in support of his thesis is based upon consistent applications of the short index (regardless of its other well-documented faults). We should also point out that consistent application of the stand-alone version of the short index will avoid the type of problems we identify here. However, if we have discovered a question-ordering effect—and our results indicate strongly that we have—some of the evidence Inglehart draws upon to
substantiate a value shift is questionable.7Importantly,
when Inglehart has made claims of a values shift by comparing estimates from embedded and non-embedded indices, they have appeared in important
and highly influential publications (e.g.Modernization
and Postmodernization; Value Change in Global Perspective) that are very highly cited. An additional implication of the question-ordering problem arises when the embedded short index is used as an independent variable (e.g. Inglehart and Abramson,
1999, p. 670), as it’s validity as a values measure is
also under question.
Cross-national research is necessary to examine the magnitude of question-ordering effects in countries other than Australia. In the meantime, we caution researchers to avoid the approach Inglehart has sometimes adopted of comparing estimates from embedded and stand-alone values indices when mea-suring postmaterial value change.
Funding
Australian Research Council Discovery Projects fund-ing scheme (project number DP0449516).
Notes
1. Inglehart (1997, p. 111) drops the ‘more
beauti-ful’ option, as it does not load strongly on a postmaterialist factor.
2. Inglehart and other WVS researchers retuned
to the four-item battery for several countries (including Britain, France, West Germany, Italy, the Netherlands, Belgium, Denmark, and Ireland) in the 1999–2001 WVSs and European Values
at University of Tasmania Library on March 18, 2010
http://esr.oxfordjournals.org
Surveys. However, in recent work, Inglehart and Welzel (2005, p. 103) compared PDIs for certain countries calculated from a mixture of the four item stand-alone index and the four-item index administered as a component of the 12-item index.
3. The sampling frame ‘excludes permanent and
temporary residents of Australia (who are not citizens) and any other adults in Australia who are non-citizens except for British subjects on a Commonwealth electoral roll as at 25 January 1984. These exclusions amount to approximately
8 per cent of the adult population (Gibsonet al.,
2004, p. 5).
4. The response rate of 43.67% for the combined
samples was calculated as the number of com-pleted questionnaires returned (4,270) divided by the total number of questionnaires mailed out (11,380), less refusals (403), and questionnaires
returned to sender (1,200) (see Gibson et al.,
2004, p. 6). These rates were comparable with the other major Australian attitudinal survey, the Australian Election Study conducted in 2004, which had a response rate of 45 per cent (Tranter, 2007).
5. Samples collected for the WVS were mostly
probability samples, although some cluster
samples were included. All questionnaires were
administered by face-to-face interviews, to
respondents aged 18 and over. In most countries sampling was stratified according to location,
with random selection of respondents. In
Western countries most researchers used the Gallup organization for data collection. Quota sampling was used in some countries. Sampling for the ISSP involved national random samples of the adult population with country samples of 1000 cases or more. The questionnaires were self-administered. The European Community Surveys used multistage, national probability samples, with face-to-face interviewing.
6. Australian academic surveys consistently estimate
far less postmaterialist PDI than the 1995 WVS estimates for Australia (see Tranter and Western,
2003, p. 244; McAllister et al., 1990; Joneset al.,
1993, 1996; Bean et al., 1998, 2002, 2005).
7. In their study of postmaterial values, Davis and
Davenport (1999, p. 652) claimed that responses
to the four-item values index were selected on the basis of chance. Using a variety of data sources from the United States collected between 1972 and 1994, they found that the values estimates from the American 1991 WVS were the only ones to differ significantly from chance. We suspect that this seemingly anom-alous result may have been due to the influence of question ordering in the second wave of the WVS.
References
Abramson, P., Ellis, S. and Inglehart, R. (1997). Research in context: measuring value change. Political Behavior,19, 41–59.
Abramson, P. and Inglehart, R. (1995). Value Change
in Global Perspective. Ann Arbor: University of Michigan Press.
Abramson, P. and Inglehart, R. (1994). Education,
security and postmaterialism. American Journal of
Political Science, 38, 797–814.
Abramson, P. and Inglehart, R. (1986). Generational
replacement and value change in six West
European societies. American Journal of Political
Science, 30, 1–25.
Bean, C. et al.(2005).Australian Election Study, 2004,
User’s Guide for the Machine-Readable Data File (SSDA Study No. 1079). Canberra: Australian Social Science Data Archive, Australian National University.
Bean, C., Gow, D. and McAllister, I. (2002).Australian
Election Study, 2001 User’s Guide for the Machine-Readable Data File (SSDA Study No. 1048). Canberra: Australian Social Science Data Archive, Australian National University.
Bean, C., Gow, D. and McAllister, I. (1998).Australian
Election Study 1998 User’s Guide for the Machine-readable Data File (ASSDA Study 1001). Canberra: Social Sciences Data Archives, Australian National University.
Bean, C. and Papadakis, E. (1994). Polarised priorities or flexible alternatives? Dimensionality in the
materialism-postmaterialism scale. International
Journal of Public Opinion Research, 6, 264–268. Blake, D., Guppy, N. and Urmetzer, P. (1997).
Canadian Public Opinion and Environmental
Action: Evidence from British Columbia.
Canadian Journal of Political Science,30, 451–472. Brown, R. and Carmines, E. (1995). Materialists,
postmaterialists, and the criteria for political
at University of Tasmania Library on March 18, 2010
http://esr.oxfordjournals.org
choice in U.S. presidential elections. Journal of Politics, 57, 483–494.
Clarke, H. (2000). Refutations affirmed: conversations concerning the Euro-barometer values battery. Political Research Quarterly, 53, 477–494.
Clarke, H. et al. (1999). The effect of economic
priorities on the measurement of value change:
new experimental evidence. American Political
Science Review, 93, 637–647.
Clarke, H., Dutt, N. and Rapkin, J. (1997).
Conversations in context: the (mis)measurement of value change in advanced industrialised
socie-ties.Political Behaviour, 19, 19–40.
Clarke, H. and Dutt, N. (1991). Measuring value change in Western industrialised societies: the
impact of unemployment. American Political
Science Review, 85, 905–920.
Davis, D. and Christian, D. (1999). Assessing the
validity of the postmaterialism index. American
Political Science Review, 93, 649–664.
De, G., Dirk, N. and Evans, G. (1996). Why are the young more postmaterialist?: a cross-national analysis of individual and contextual influences on
postmaterial values. Comparative Political Studies,
28, 608.
Duch, R. and Taylor, M. (1994). A reply to Abramson and Inglehart’s ‘education security and
postmateri-alism’. American Journal of Political Science, 38,
815–824.
Duch, R. and Taylor, M. (1993). Postmaterialism
and the economic condition. American Journal of
Political Science, 37, 747–779.
European Values Study Group and World Values
Survey Association (2006). EUROPEAN AND
WORLD VALUES SURVEYS FOUR-WAVE
INTEGRATED DATA FILE, 1981–2004,
v.20060423, Aggregate File. Producers: Ana´lisis Sociolo´gicos Econo´micos y Polı´ticos (ASEP) and
JD Systems (JDS), Madrid, Spain/Tilburg
University, Tilburg, The Netherlands. Data
Files Suppliers: Analisis Sociologicos Economicos
y Politicos (ASEP) and JD Systems (JDS),
Madrid, Spain/Tillburg University, Tillburg,
The Netherlands/Zentralarchiv fur Empirische
Sozialforschung (ZA), Cologne, Germany:
Aggregate File Distributors, Ana´lisis Sociolo´gicos Econo´micos y Polı´ticos (ASEP) and JD Systems (JDS), Madrid, Spain/Tillburg University, Tilburg,
The Netherlands/Zentralarchiv fur Empirische
Sozialforschung (ZA) Cologne, Germany.
Flanagan, S. (1987). Value change in industrial
societies. American Political Science Review, 81,
1303–1319.
Flanagan, S. (1982a). Changing values in advanced
industrial societies. Comparative Political Studies,
14, 403–444.
Flanagan, S. (1982b). Measuring value change in
advanced industrial societies: a rejoinder to
Inglehart.Comparative Political Studies,15, 99–128.
Fuchs, D. and Robert, R. (1998). Postmaterialism and electoral choice before and after German
unifica-tion.West European Politics,21, 95–116.
Gibson, R.et al. (2004).D1070: The Australian Survey
of Social Attitudes, 2003. Canberra: Australian National University.
Inglehart, R. (1971). The silent revolution in
Europe: intergenerational change in post-industrial
societies. American Political Science Review, 65,
991–1017.
Inglehart, R. (1977). The Silent Revolution: Changing
Values and Political Styles Among Western Publics. Princeton, NJ: Princeton University Press. Inglehart, R. (1981). Post-materialism in an
environ-ment of insecurity. American Political Science
Review,75, 880–900.
Inglehart, R. (1990). Culture Shift in Advanced
Industrial Societies. Princeton, NJ: Princeton University Press.
Inglehart, R. (1997).Modernization and
Postmoderniza-tion: Cultural, Economic and Political Change in 43 Societies. Princeton, NJ: Princeton University Press. Inglehart, R. and Abramson, P. (1999). Measuring
postmaterialism. American Political Science Review,
93, 665–677.
Inglehart, R. and Abramson, P. (1994). Economic
security and value change. American Political
Science Review, 88, 336–354.
Inglehart, R. and Christian, W. (2005).Modernization,
Cultural Change, and Democracy. New York: Cambridge University Press.
Jagodzinski, W. (1982). Materialism in Japan recon-sidered: toward a synthesis of generational and
life-cycle explanations. American Political Science
Review,77, 887–894.
Jones, R., McAllister, I. and Gow, D. (1996).Australian
Election Study 1996 User’s Guide for the Machine-readable Data File (ASSDA Study 943). Canberra: Social Sciences Data Archives, Australian National University.
Jones, R., Denemark, D. and Gow, D. (1993). Australian Election Study 1993 User’s Guide for the Machine-readable Data File (ASSDA Study 763). Canberra: Social Sciences Data Archives, Australian National University.
Layman, G. and Carmines, E. (1997). Cultural con-flict in American politics: religious traditionalism,
at University of Tasmania Library on March 18, 2010
http://esr.oxfordjournals.org
postmaterialism, and U.S. political behavior. The Journal of Politics, 59, 751–777.
McAllister, I. et al. (1990). Australian Election Study
1990 User’s Guide for the Machine-Readable Data File (SSDA Study No. 570). Canberra: Australian National University.
Maslow, A. (1954). Motivation and Personality.
New York: Harper and Row.
Moors, Guy, and Vermunt, J. (2007). Heterogeneity in post-material value priorities: evidence from
a latent class discreet choice approach. European
Sociological Review, 23, 631–648.
Tranter, B. (2007). Political knowledge and its
partisan consequences. Australian Journal of
Political Science, 42, 73–88.
Tranter, B. and Western, M. (2009). The influence of
green parties on postmaterialist values. British
Journal of Sociology,60, 145–167.
Tranter, B. and Western, M. (2003). Postmaterial
values and age: the case of Australia. Australian
Journal of Political Science,38, 239–257.
Warwick, P. (1998). Disputed cause, disputed effect:
the postmaterialist thesis re-examined. Public
Opinion Quarterly,62, 583–609.
Authors’ Addresses
Bruce Tranter, School of Sociology and Social Work, University of Tasmania, Hobart, Australia. Email: [email protected]
Mark Western, The University of Queensland, Institute for Social Science Research, Brisbane, Australia. Email: [email protected]
Manuscript received: June 2008
Appendix A
‘Control’ Sample Questions
A11 Next, a question about what you think the aims
of Australia should be for the next ten years. Here is a list of four aims that different people would give priority. If you had to choose among these four aims, which would be your first choice? And which would be your second choice?
Put the letter of the statement in the appropriate box below.
A. Maintain a high level of economic growth
B. Make sure this country has strong defence forces
C. See that people have more say about how things are done at their jobs and in their communities
D. Try to make our cities and countryside more beautiful
First choice
«
Second choice
«
A12 Here is another list of four aims. If you had to
choose among these four aims, which would be your first choice? And which would be your second choice?
Put the letter of the statement in the appropriate box below.
A. Maintain order in the nation
B. Give people more say in important govern-ment decisions
C. Fight rising prices D. Protect freedom of speech
First choice
«
Second choice
«
A13 And here is a further list. If you had to choose
among these four aims, which would be your first choice? And which would be your second choice?
Put the letter of the statement in the appropriate box below.
A. A stable economy
B. Progress toward a less impersonal and more humane society
C. Progress toward a society in which ideas count more than money
D. The fight against crime
First choice
«
Second choice
«
Appendix B
‘Test’ Sample Questions
A9 Next, a question about what you think the aims
of Australia should be for the next ten years. Here is a list of four aims that different people
at University of Tasmania Library on March 18, 2010
http://esr.oxfordjournals.org
would give priority. If you had to choose among these four aims, which would be your first choice? And which would be your second choice?
Put the letter of the statement in the appropriate box below.
A. Maintain order in the nation
B. Give people more say in important govern-ment decisions
C. Fight rising prices D. Protect freedom of speech
First choice
«
Second choice
«
A10 Here is another list of four aims. If you had
to choose among these four aims, which would be your first choice? And which would be your second choice?
Put the letter of the statement in the appropriate box below.
A. Maintain a high level of economic growth B. Make sure this country has strong defence
forces
C. See that people have more say about how things are done at their jobs and in their communities
D. Try to make our cities and countryside more beautiful
First choice
«
Second choice
«
A11 And here is a further list. If you had to choose
among these four aims, which would be your
first choice? And which would be your second choice?
Put the letter of the statement in the appropriate box below.
A. A stable economy
B. Progress toward a less impersonal and more humane society
C. Progress toward a society in which ideas count more than money
D. The fight against crime
First choice
«
Second choice
«
Appendix C
Descriptive statistics for dependent and independent variables
Mean Standard deviation
Range N
Dependent variables
Values (OLS) 7.54 59.38 100–100 4,165 Values (Logit) 1.92 0.59 1–3 4,165
Independent variables
‘Control’ sample 0.51 0.50 0/1 4,270 Women 0.53 0.50 0/1 4,224 Age 50.75 16.26 18–99 4,212 Bachelor Degree
or higher
0.22 0.42 0/1 4,144
Church attendance 0.16 0.36 0/1 4,084 Professional occupation 0.19 0.39 0/1 4,270 Missing on occupation 0.10 0.30 0/1 4,270 Income Aus$0–31,999 0.54 0.50 0/1 4,270 Missing on income 0.07 0.25 0/1 4,270 Live inner metropolitan 0.28 0.45 0/1 4,192 Middle or upper class 0.50 0.50 0/1 4,153 Born in the UK 0.09 0.29 0/1 4,217 Born in other countries 0.16 0.37 0/1 4,217
at University of Tasmania Library on March 18, 2010
http://esr.oxfordjournals.org