1
Materials and Methods
REFUGIA project working paper. By Tommy Dalgaard. Aarhus University. June 1, 2011.
1.
Organic farming in Denmark
1.1 Farm types and farming structure
[image:1.595.61.476.207.462.2]The organic farming structure has been analysed for all farms in Denmark 2005-2010.
Table 1. % of farm area 2005
Farm type Organic Conventional
Hobby 11% 15%
Cattle 41% 17%
Cash crops 32% 36%
Pigs and other types 17% 32%
Figure 1: Distribution of organic farming in Denmark 2006 and 2008.
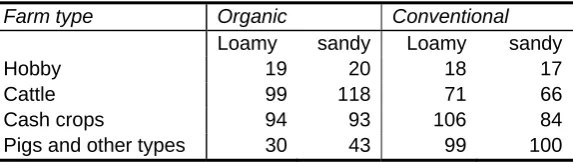
In 2005, the average farm size for organic farms was 50 ha, compared to 40 ha for conventional farms. For organic farms the largest average farm size in on sandy soils and for cattle farms, whereas the for conventional farms, the largest farms are on loamy soils, and cash crop, and pig farms (table2)
Table 2. Avg. Farm Size 2005 (ha)
Farm type Organic Conventional
Loamy sandy Loamy sandy
Hobby 19 20 18 17
Cattle 99 118 71 66
Cash crops 94 93 106 84
Pigs and other types 30 43 99 100
1.2Cropping patterns, rotations and yield levels
Archived
at
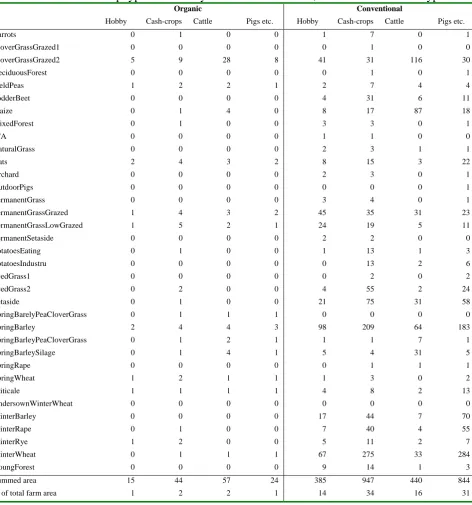
[image:1.595.55.342.585.666.2]2 The distribution on the different crop types handled by the ALMAsSS model, for the different farm types are shown in Table 3.
Table 3. The different crop types handled by the ALMAsSS model, for the different farm types
Organic Conventional
Hobby Cash-crops Cattle Pigs etc. Hobby Cash-crops Cattle Pigs etc.
Carrots 0 1 0 0 1 7 0 1
CloverGrassGrazed1 0 0 0 0 0 1 0 0
CloverGrassGrazed2 5 9 28 8 41 31 116 30
DeciduousForest 0 0 0 0 0 1 0 1
FieldPeas 1 2 2 1 2 7 4 4
FodderBeet 0 0 0 0 4 31 6 11
Maize 0 1 4 0 8 17 87 18
MixedForest 0 1 0 0 3 3 0 1
N/A 0 0 0 0 1 1 0 0
NaturalGrass 0 0 0 0 2 3 1 1
Oats 2 4 3 2 8 15 3 22
Orchard 0 0 0 0 2 3 0 1
OutdoorPigs 0 0 0 0 0 0 0 1
PermanentGrass 0 0 0 0 3 4 0 1
PermanentGrassGrazed 1 4 3 2 45 35 31 23
PermanentGrassLowGrazed 1 5 2 1 24 19 5 11
PermanentSetaside 0 0 0 0 2 2 0 0
PotatoesEating 0 1 0 0 1 13 1 3
PotatoesIndustru 0 0 0 0 0 13 2 6
SeedGrass1 0 0 0 0 0 2 0 2
SeedGrass2 0 2 0 0 4 55 2 24
Setaside 0 1 0 0 21 75 31 58
SpringBarelyPeaCloverGrass 0 1 1 1 0 0 0 0
SpringBarley 2 4 4 3 98 209 64 183
SpringBarleyPeaCloverGrass 0 1 2 1 1 1 7 1
SpringBarleySilage 0 1 4 1 5 4 31 5
SpringRape 0 0 0 0 0 1 1 1
SpringWheat 1 2 1 1 1 3 0 2
Triticale 1 1 1 1 4 8 2 13
UndersownWinterWheat 0 0 0 0 0 0 0 0
WinterBarley 0 0 0 0 17 44 7 70
WinterRape 0 1 0 0 7 40 4 55
WinterRye 1 2 0 0 5 11 2 7
WinterWheat 0 1 1 1 67 275 33 284
YoungForest 0 0 0 0 9 14 1 3
Summed area 15 44 57 24 385 947 440 844
% of total farm area 1 2 2 1 14 34 16 31
3 pig farms and other types of farms (for example poultry and fur animals). Standard rotations are defined for each of these farm types.
Tabel 4. REFUGIA farm type typologi. (Fire forskellige produktionstyper, samt intensiv og ekstensiv økologisk eller konventionel drift. Værdierne Ø1-Ø4 og K1-K4 refererer til forskellige hhv. økologiske og konventionelle standardsædskifter. ”+l” refererer til, at der regnes med en langsom afgrødevækstkurve og dermed et lavt udbytteniveau, mens ”+h” refererer til hurtige afgrødevækstkurver og dermed højere udbytter).
Produktionstype Økologisk Konventionel
Ekstensiv Intensiv Ekstensiv Intensiv
Hobby Ø1+l Ø1+h K1+l K1+h
Planteavl Ø2+l Ø2+h K2+l K2+h
Kvægbrug Ø3+l Ø3+h K3+l K3+h
[image:3.595.53.543.332.741.2]Svinebrug Ø4+l Ø4+h K4+l K4+h
Tabel 5. Oversigt over de 2 x 4 standard-sædskifter i økologisk (Ø1-Ø4) og konventionelt jordbrug (K1-K4), og % areal med hver af de i Tabal 3 definerede ALMaSS typeafgrøder.
Økologisk Konventionel
% areal med:
Hobby (Ø1) Plante (Ø2) Kvæg (Ø3) Svin (Ø4) Hobby (K1) Plante (K2) Kvæg (K3) Svin (K4)
Carrots 0 10 0 0 0 0 0 0
CloverGrassGrazed2 30 20 50 20 10 0 20 0
FieldPeas 10 10 0 10 0 0 0 0
Maize 0 0 10 0 0 0 30 0
Oats 10 10 0 10 0 0 0 0
PermanentGrassGrazed 10 10 10 10 10 0 10 0
PermanentGrassLowGrazed 10 10 0 10 10 10 0 10
SeedGrass2 0 0 0 0 0 10 0 10
SpringBarley 10 10 10 10 30 30 10 30
SpringBarleyPeaCloverGrass 0 0 10 0 0 0 10 0
SpringBarleySilage 0 0 10 0 0 0 10 0
SpringWheat 10 10 0 10 0 0 0 0
WinterBarley 0 0 0 0 10 10 0 10
WinterRape 0 0 0 0 10 10 0 10
WinterRye 10 10 0 10 0 0 0 0
WinterWheat 0 0 0 0 20 30 10 30
Ø1 Vårbyg udlæg – kløvergræs – kløvergræs – kløvergræs – havre – ærter – vårhvede – vinterrug (+ 2 skifter varig græs)
Ø2 Vårbyg udlæg – kløvergræs – kløvergræs – gulerødder – ærter – vårhvede – havre – vinterrug (+ 2 skifter varig græs)
Ø3 Vårbyghelsæd udlæg – kløvergræs – kløvergræs – kløvergræs – vårbyg – vårbyg udlæg – kløvergræs – kløvergræs (+ 1 skifte varig majs og 1 skifte varig græs) Ø4 Vårbyghelsæd udlæg – kløvergræs – kløvergræs – vårbyg – havre – ærter –
vårhvede – vinterrug (+ 2 skifter varig græs)
4 K2 Vinterraps – vinterhvede – vårbyg udlæg – frøgræs – vårbyg – vinterhvede –
vårbyg – vinterhvede – vinterbyg (+1 skifte varig græs)
K3 Vårbyghelsæd udlæg – kløvergræs – vårbyg – vinterhvede – vårbyg udlæg – kløvergræs (+ 3 skifter varig majs og 1 skifte varig græs)
K4 Vinterraps – vinterhvede – vårbyg udlæg – frøgræs – vårbyg – vinterhvede – vårbyg – vinterhvede – vinterbyg (+1 skifte varig græs)
[image:4.595.105.494.240.379.2]The average yield levels for organic versus conventional farm types are indicated in Figure 2.
Figure 2. Det gennemsnitlige kornudbytte for forskellige økologiske og konventionelle produktionstyper de seneste 10 år (www.foi.dk).
1.3 Field sizes
[image:4.595.53.358.542.623.2]The average field size is a bit smaller on organic compared to conventional farms, with the smalles average field size on the small hobby and cash-crop farms.
Table 6. Avg. Field size in 2005
Organic Conventional
Hobby 1,9 2,1
Cattle 4,1 3,6
Crop 4,0 4,4
Pig and others 2,8 4,6
[image:4.595.50.507.664.711.2]All farms 3,6 3,7
Table 7. Avg field size in 2010:
Total area Number of fields Avg. Field size 2010
Conventional 2543168 596559 4,3
5 1.3 Soil types
[image:5.595.51.370.168.250.2]82% of all organic farms are on sandy soils; especially the cattle farms. This is primarily because most of the organic farms are situated in the Western Denmark.
Table 8. % of area on farms with predominantly sandy soils in 2005
Farm type Organic Conventional
Hobby 75% 66%
Cattle 90% 89%
Cash crops 76% 50%
Pigs and other types 79% 67%
Average, All farms 82% 64%
1.4 Conversion age of fields
[image:5.595.69.484.319.576.2]6 2
The organic farms studied in the REFUGIA project
2.1 The case areas, farm types and farming/landscape structure
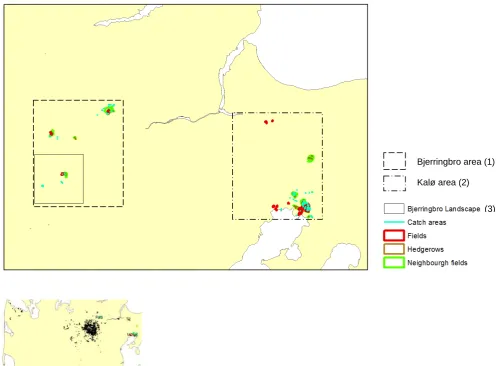
[image:6.595.55.558.298.664.2]In addition to the national datasets above, we have digitized fields and landscape features in study areas around Bjerringbro/Fussingø and around Kalø/Tøjstrup in Mid Jutland, Denmark. The Kalø area is situated to the east, whereas the Bjerringbro and Fussingø study sites are situated to the west (Figure 4). All biotopes (12391 polygons) in the the 10 km * 10 km square around Bjerringbro are digitized for the year 2005, including all 2961 fields on the in total 306 farms which have 1 or more fields within this defined square.
The average size of these fields digitized was 3.83 ha.
Figure 4. Digitized features in the 2 study areas in Mid Jutland. The Kalø/Tøjstrup area (2) is si-tuated to the east, whereas the Bjerringbro and Fussingø study sites are sisi-tuated to the west (1). All biotopes in the 10 km * 10 km square around Bjerringbro (3) is digitized for the year 2005, inclu-ding all fields on farms which have 1 or more fields within this defined square (lower left map).
Bjerringbro area (1)
Kalø area (2)
7 2.2Characteristics of the study areas in Bjerringbro and Kalø
Each of the study areas, Bjerringbro and Kalø, contains both organic and conventional farms. The Bjerringbro area is the most agricultural intensive area, with around 66% of the area covered by agriculture, compared to a national average of 61%. In contrast the coverage with forests,
hedgerows and other small biotopes is lower than the national average. In the Kalø area we have the opposite situation, with only 52% of the area in the form of agriculture, and with more forests and small biotopes than the national average. However, with about 7.6% of the agricultural land organically farmed, Kalø has more organic farming than the national average (5.6%), whereas the Bjerringbro area has a lower proportion of organically farmed areas (4.8%). In contrast the average fields size in Bjerringbro (3.3 ha) is smaller than the national average (3.6 ha for organic farms, and 3.7 ha for conventional farms), whereas the average fields size around Kalø is 3.9 ha. This is related to the farm types, where the Kalø area includes relatively many organic cash crop farms and hobby farmers, whereas both organic and conventional farming around Bjerringbro is dominated by livestock farming (mainly organic cattle farms, and both organic and conventional pig and cattle farms). There is no significant difference between the age of conversion of the fields in the two areas, where the most fields were converted between 1996 and 1999.
The soil type varies between the two areas. The soil at Bjerringbro is dominated by sandy and loamy sandy soils, whereas the Kalø area is dominated by loamy and heavy loamy soils
2.3Scenarios for conversion to organic farming (see also chapter 1.2)
In order to create the scenarios the current form of organic Danish farming was analyzed using a database of EU subsidy-support information (Happe et al. 2011; Dalgaard et al., 2002). Based on the official EU farm typology (McClintock 1989; Statistics Denmark 2010), the farms were classified into four types: ‘hobby’ (<1665 working hours/year), ‘cattle’ (>2/3rds of income from cattle), ‘arable’ (> 2/3rds income from cash crops), and ‘pigs and mixed farms’ (also including other types of specialised farms such as poultry & fur). All four types had organic and conventional variants each with specific mean area coverage for a range of crops (Table 1).
It was considered important to distinguish between extensive and intensive management. However, no clear pattern was detectable in crop choices between intensive and extensive variants, but based on Dalgaard et al. (2011, 2002) fertilizer usage was considered significantly different. Hence, the difference between intensive and extensive variants was limited to a 20% reduction in yield as a result of reduced fertilizer inputs, corresponding to the yield differences documented in official Organic farming statistics 1996-2010 (see for example Statistics Denmark 2010), and all permanent pasture was considered to be extensively grazed in extensive farm types. In ALMaSS, and the real world, there is an estimated 20% reduction in yield in organic crops compared to conventional crops of the same type due primarily to the use of organic fertilizer (Dalgaard et al., 2002). In addition, all model field management is organic, meaning no pesticides are used and mechanical weeding is replaces herbicide. This resulted in 16 farm types with differing crop selections, managements, and yields (see Table 4).
2.4Collection of detailed farm data
8 Table 9. Area (ha) and the distribution on farm types for the 18 farms with detailed information collected (year 2007)
Farm type Organic Conventional
Hobby 76 0
Cattle 332 295
Cash crops 1066 339
Pigs and other types 0 548
Total 1474 1182
From these 18 farms we have specifically digitized 22 fields (with field studies), and 108
neighbouring fields (or areas with other land uses than arable crops), 29 hedgerows, and 15 catch areas for mice (including 119 transect lines).
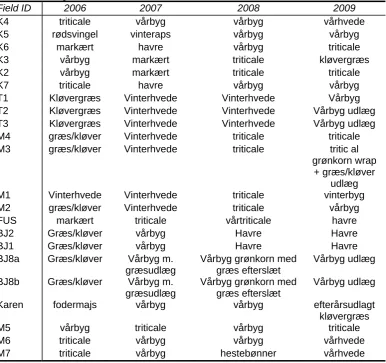
[image:8.595.60.447.330.693.2]2.5Crop types, rotations and farming practices
Table 10. Crop rotation in the fields with detailed data collected
Field ID 2006 2007 2008 2009
K4 triticale vårbyg vårbyg vårhvede
K5 rødsvingel vinteraps vårbyg vårbyg
K6 markært havre vårbyg triticale
K3 vårbyg markært triticale kløvergræs
K2 vårbyg markært triticale triticale
K7 triticale havre vårbyg vårbyg
T1 Kløvergræs Vinterhvede Vinterhvede Vårbyg T2 Kløvergræs Vinterhvede Vinterhvede Vårbyg udlæg T3 Kløvergræs Vinterhvede Vinterhvede Vårbyg udlæg M4 græs/kløver Vinterhvede triticale triticale M3 græs/kløver Vinterhvede triticale tritic al
grønkorn wrap + græs/kløver
udlæg
M1 Vinterhvede Vinterhvede triticale vinterbyg M2 græs/kløver Vinterhvede triticale vårbyg FUS markært triticale vårtriticale havre
BJ2 Græs/kløver vårbyg Havre Havre
BJ1 Græs/kløver vårbyg Havre Havre
BJ8a Græs/kløver Vårbyg m. græsudlæg
Vårbyg grønkorn med græs efterslæt
Vårbyg udlæg
BJ8b Græs/kløver Vårbyg m. græsudlæg
Vårbyg grønkorn med græs efterslæt
Vårbyg udlæg
Karen fodermajs vårbyg vårbyg efterårsudlagt kløvergræs
M5 vårbyg triticale vårbyg triticale
M6 triticale vårbyg vårbyg vårhvede
9 Table 11. Crop yields, field size and farming history in the fields with detailed data collected
Marknavn Udbytte (hKg/ha eller
foderenheder grovfoder/ha) Markstørrelse Driftshistorie/bedriftstype
K4 35 17,80 Økologisk planteavl
K5 35 20,00 Økologisk planteavl
K6 30 19,90 Økologisk planteavl
K3 40 20,10 Økologisk planteavl
K2 40 3,80 Økologisk planteavl
K7 30 22,60 Økologisk planteavl
T1 40 2,36 Økologisk malkekvæg
T2 50 4,26 Økologisk malkekvæg
T3 55 1,74 Økologisk malkekvæg
M4 50 2,76 Økologisk kødkvæg
M3 50 3,63 Økologisk kødkvæg
M1 50 1,54 Økologisk kødkvæg
M2 50 5,40 Økologisk kødkvæg
FUS 40 24,00 Økologisk planteavl
BJ2 35 6,44 Økologisk planteavl/fåreavl
BJ1 35 5,29 Økologisk planteavl/fåreavl
BJ8a 30 hkg + 3000 FE efterslæt 9,00 Økologisk malkekvæg BJ8b 4500 FE incl. efterslæt 9,00 Økologisk malkekvæg
Karen 55 8,60 Økologisk malkekvæg
M5 40 30,10 Økologisk planteavl
M6 30 17,80 Økologisk planteavl
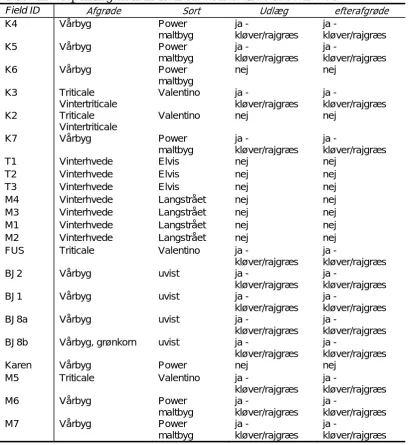
10 Table 12. Crop management in the fields with detailed data collected
Field ID Afgrøde Sort Udlæg efterafgrøde
K4 Vårbyg Power
maltbyg
ja -
kløver/rajgræs
ja -
kløver/rajgræs
K5 Vårbyg Power
maltbyg
ja -
kløver/rajgræs
ja -
kløver/rajgræs
K6 Vårbyg Power
maltbyg
nej nej
K3 Triticale Vintertriticale
Valentino ja - kløver/rajgræs
ja -
kløver/rajgræs K2 Triticale
Vintertriticale
Valentino nej nej
K7 Vårbyg Power
maltbyg
ja -
kløver/rajgræs
ja -
kløver/rajgræs
T1 Vinterhvede Elvis nej nej
T2 Vinterhvede Elvis nej nej
T3 Vinterhvede Elvis nej nej
M4 Vinterhvede Langstrået nej nej
M3 Vinterhvede Langstrået nej nej
M1 Vinterhvede Langstrået nej nej
M2 Vinterhvede Langstrået nej nej
FUS Triticale Valentino ja - kløver/rajgræs
ja -
kløver/rajgræs
BJ2 Vårbyg uvist ja -
kløver/rajgræs
ja -
kløver/rajgræs
BJ1 Vårbyg uvist ja -
kløver/rajgræs
ja -
kløver/rajgræs
BJ8a Vårbyg uvist ja -
kløver/rajgræs
ja -
kløver/rajgræs BJ8b Vårbyg, grønkorn uvist ja -
kløver/rajgræs
ja -
kløver/rajgræs
Karen Vårbyg Power nej nej
M5 Triticale Valentino ja - kløver/rajgræs
ja -
kløver/rajgræs
M6 Vårbyg Power
maltbyg
ja -
kløver/rajgræs
ja -
kløver/rajgræs
M7 Vårbyg Power
maltbyg
ja -
kløver/rajgræs
ja -
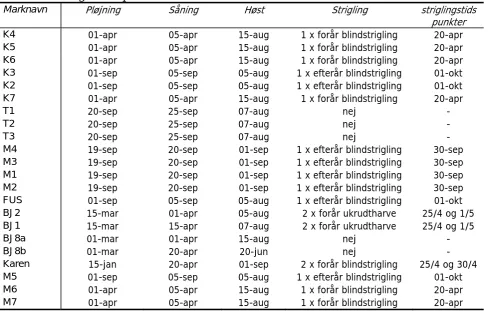
11 Table 13. Management operations in the fields with detailed data collected.
Marknavn Pløjning Såning Høst Strigling striglingstids
punkter
K4 01-apr 05-apr 15-aug 1 x forår blindstrigling 20-apr
K5 01-apr 05-apr 15-aug 1 x forår blindstrigling 20-apr
K6 01-apr 05-apr 15-aug 1 x forår blindstrigling 20-apr
K3 01-sep 05-sep 05-aug 1 x efterår blindstrigling 01-okt
K2 01-sep 05-sep 05-aug 1 x efterår blindstrigling 01-okt
K7 01-apr 05-apr 15-aug 1 x forår blindstrigling 20-apr
T1 20-sep 25-sep 07-aug nej -
T2 20-sep 25-sep 07-aug nej -
T3 20-sep 25-sep 07-aug nej -
M4 19-sep 20-sep 01-sep 1 x efterår blindstrigling 30-sep
M3 19-sep 20-sep 01-sep 1 x efterår blindstrigling 30-sep
M1 19-sep 20-sep 01-sep 1 x efterår blindstrigling 30-sep
M2 19-sep 20-sep 01-sep 1 x efterår blindstrigling 30-sep
FUS 01-sep 05-sep 05-aug 1 x efterår blindstrigling 01-okt
BJ2 15-mar 01-apr 05-aug 2 x forår ukrudtharve 25/4 og 1/5
BJ1 15-mar 15-apr 07-aug 2 x forår ukrudtharve 25/4 og 1/5
BJ8a 01-mar 01-apr 15-aug nej -
BJ8b 01-mar 20-apr 20-jun nej -
Karen 15-jan 20-apr 01-sep 2 x forår blindstrigling 25/4 og 30/4
M5 01-sep 05-sep 05-aug 1 x efterår blindstrigling 01-okt
M6 01-apr 05-apr 15-aug 1 x forår blindstrigling 20-apr
12 Table 14. Fertilisation and irrigation in the fields with detailed data collected.
Filed ID Gødningstype Vandings
mængde Vandingstidspunkt Gødskningsmængde (kg Plantetilgæng. N/ha) Gødningstidspunkt
K4 Kvæg og svinegylle (konventionel)
0 - 42 01-maj
K5 Kvæg og svinegylle (konventionel)
0 - 42 01-maj
K6 Kvæg og svinegylle (konventionel)
0 - 42 01-maj
K3 Kvæg og svinegylle (konventionel)
0 - 56 20-apr
K2 Kvæg og svinegylle (konventionel)
0 - 56 20-apr
K7 Kvæg og svinegylle (konventionel)
0 - 42 01-maj
T1 Bioforgasset Svinegylle 12 t (konventionel)
0 - 38 20-apr
T2 Kvæggylle 37t (økologisk )
0 - 92 10-apr
T3 Bioforgasset Svinegylle 40 t (konventionel)
0 - 126 20-apr
M4 Minkgylle (konventional)
0 - 120 20-apr
M3 Minkgylle (konventional)
0 - 120 20-apr
M1 Minkgylle (konventional)
0 - 120 20-apr
M2 Minkgylle (konventional)
0 - 120 20-apr
FUS Kvæg og svinegylle (konventionel)
0 - 56 20-apr
BJ2 Svinegylle (konventionel)
0 - 49 20-maj
BJ1 Svinegylle (konventionel)
0 - 49 20-maj
BJ8a Dybstrøelse Jan-Feb. 20 t/ha før pløjning.
1-2 gange 12t/ha kvæggylle efter slet (økologisk)
0 - 100 15-jan
BJ8b Dybstrøelse Jan-Feb. 20 t/ha før pløjning.
1-2 gange 12t/ha kvæggylle efter slet (økologisk)
2*30 mm 10/6 og 10/7 100 15-feb
Karen kvæggylle 20-30t + Kvæg dybstrøelse 20-26t+ (økologisk)
2* 30mm 10/6 og 10/7 128 01-maj
M5 Kvæg og svinegylle (konventionel)
0 - 56 20-apr
M6 Kvæg og svinegylle (konventionel)
0 - 42 01-maj
M7 Kvæg og svinegylle (konventionel)
13 2.6Landscape structure
[image:13.595.59.532.140.732.2]The following maps give an indication of the landscape structure around the fields, farms and landscape elements studied.
14 2.6 Soil types
15 In total 81% of the organic farms area are on sandy soil farms, compared to 41% of the
[image:15.595.50.453.155.238.2]conventional farms area studied. This is more or less the same pattern as we see for all farms in Denmark.
Table 15. The distribution of the area of the farms studied on sandy and loamy soils
Farm type Sandy Loamy
Organic Conventional Organic Conventional
Hobby 6% 0% 0% 0%
Cattle 4% 0% 100% 42%
Cash crops 89% 15% 0% 38%
Pigs and other types 0% 85% 0% 20%
[image:15.595.66.434.320.630.2]For the specific fields studied, there is a tendency towards more fields on sandy soils than the average in Denmark (Table 16).
Table 16. Soil types on the specific fields studied
Marknavn Markstørrelse Jordtype
K4 17,80 Sandblandet lerjord
K5 20,00 Sandblandet lerjord
K6 19,90 Lerblandet sandjord
K3 20,10 Lerblandet sandjord
K2 3,80 Lerblandet sandjord
K7 22,60 Sandblandet lerjord/Lerblandet
sandjord
T1 2,36 Humusjord
T2 4,26 Humusjord
T3 1,74 Humusjord
M4 2,76 Sandblandet lerjord
M3 3,63 Sandblandet lerjord
M1 1,54 Sandblandet lerjord
M2 5,40 Sandblandet lerjord
FUS 24,00 Sandblandet lerjord
BJ2 6,44 Grovsandet jord
BJ1 5,29 Grovsandet jord
BJ8a 9,00 Grovsandet jord
BJ8b 9,00 Grovsandet jord
Karen 8,60 Sandblandet ler
M5 30,10 Sandblandet lerjord
M6 17,80 Sandblandet lerjord
M7 14,50 Sandblandet lerjord
2.7 Conversion age of fields
16 2.8 References
Dalgaard, T, Hutchings N, Dragosits U, Olesen JE, Kjeldsen C, Drouet JL and Cellier P (2011) Effects of farm heterogeneity and methods for upscaling on modelled nitrogen losses in
agricultural landscapes. Environmental Pollution (in press).
Dalgaard, T., Rygnestad, H., Jensen, J.D., Larsen, P.E. (2002) Methods to map and simulate agricultural activity at the landscape scale. Danish Journal of Geography 3, 29–39.
Dalgaard T, Heidman T and Mogensen L (2002) Potential N-losses in three scenarios for
conversion to organic farming in a local area of Denmark. European Journal of Agronomy 16: 207-21.
Happe K, Hutchings N, Dalgaard T and Kellermann K (2011) Modelling the interactions between regional farming structure, nitrogen losses and environmental regulation. Agricultural Systems 104(3) 281-291.
McClintock, J. (1989) Farm Accountancy Data network. An A to Z Methodology. Report, 1st edition. Commission of The European Communities, Brussels, 1989.