Improving Cadastral Infrastructure with RTK GPS in Australia
Volker JANSSEN, Thomas GRINTER, Craig ROBERTS and Michael TROTH, Australia
Key words: Cadastre, Infrastructure, RTK, GPS, Geospatial Alliance Project (GAP)
SUMMARY
Cadastral surveying is primarily concerned with the process of gathering evidence in the form of position information that is used to define the location of objects or land boundaries for the purposes of identifying ownership and/or the value of land parcels. The advent of Global Navigation Satellite Systems (GNSS), such as the Global Positioning System (GPS), has revolutionised the way 3-dimensional positions are determined and GPS surveying techniques, particularly Real Time Kinematic (RTK), are increasingly being adopted by cadastral surveyors.
Due to the size of the Australian continent, the density of established (i.e. valid) survey marks varies considerably across the country, and there are areas where a higher density of established marks is desired. This paper presents a methodology for using RTK GPS observations to improve the existing cadastral survey control infrastructure, based on an extensive survey covering Junee Shire Council in NSW carried out as part of the Geospatial Alliance Project (GAP).
A large number of already established survey marks were occupied, facilitating an investigation of the accuracy achieved with the RTK GPS technique. Comparison of the RTK-derived positions of the established marks against their published values showed an accuracy (RMS) of 11 mm in the horizontal and 34 mm in the vertical component (1σ). The
relative accuracy of the RTK GPS results was investigated by performing bearing and grid distance calculations between a subset of established marks. Of particular interest were short distances routinely encountered by cadastral surveyors, i.e. less than 300 m, and it was shown that the results agreed very well with the values derived from the state’s survey control database (SCIMS), easily meeting accuracy specifications and NSW survey regulation requirements.
Improving Cadastral Infrastructure with RTK GPS in Australia
Volker JANSSEN, Thomas GRINTER, Craig ROBERTS and Michael TROTH, Australia
1. INTRODUCTION
Cadastral surveying, or land surveying, is primarily concerned with the process of gathering evidence in the form of position information that is used to define the location of objects or land boundaries in a geographic area for the purposes of identifying ownership and/or the value of land parcels. This information supports a jurisdiction’s land administration, conveyance or land registration system and is critical in order to establish and maintain a digital cadastral database (DCDB).
In NSW, the Survey Control Information Management System (SCIMS) contains coordinates and related metadata information for survey marks established under the direction of the NSW Surveyor General and is maintained by the NSW Land and Property Management Authority (LPMA), formerly the NSW Department of Lands (Lands), for the purposes of cadastral boundary definition, engineering surveys, mapping and a variety of other spatial applications (Lands, 2009b).
[image:2.595.175.421.511.618.2]The terms class and order are familiar to all surveyors and geodesists. The class is a function of the planned and achieved precision of a survey network, dependent on the design, survey practices, instrumentation and reduction techniques used. The order is a function of the class, the conformity with respect to the existing control network and the precision of any transformation process that may be required. Table 1 lists the classes applicable for horizontal survey control in Australia. Classes for vertical control are assigned similarly, distinguishing between levelled and non-levelled marks. Detailed definitions can be found in ICSM (2007).
Table 1: Horizontal survey control mark classes used in Australia (ICSM, 2007).
Point class Typical applications 3A Special high precision surveys
2A High precision national geodetic surveys A National and state geodetic surveys B State survey control networks C Survey coordination projects
D Approximate and lower order surveys E Approximate and lower order surveys U Unknown or unreliable
the density of established survey marks varies considerably across the state and there are areas where a higher density of established marks is desired, particularly in regional urban areas.
The advent of Global Navigation Satellite Systems (GNSS), such as the United States’ Global Positioning System (GPS), Russia’s GLONASS, the European Union’s Galileo and China’s Compass, has revolutionised the way 3-dimensional positions are determined on and above the Earth’s surface. Once initialised, Real Time Kinematic (RTK) GPS becomes a high precision coordinate generator and real world digitiser with the ability to significantly enhance productivity.
Roberts (2005) presented practical considerations for cadastral surveyors using RTK GPS and pointed out the following benefits of the technology:
• Usefulness in finding existing survey marks.
• Positions can be measured in the field in real time and distances derived to compare with
plan distances.
• Ability to brace a traverse in difficult terrain where traversing techniques would require
many setups with short lines to overcome hills or heavy tree cover, potentially improving loop closure accuracy significantly by reducing the number of setups and short lines.
• Ability to connect to existing survey control over distances considered unfeasible using
traversing techniques.
• Ability to easily survey irregular natural boundaries.
LPMA has since revised the Surveying Regulation (Lands, 2006) to permit RTK techniques to be used over short distances by cadastral surveyors. In order to accommodate the coordinate accuracy achieved by GNSS (i.e. 10 mm + 1 ppm), the acceptable accuracy for distance measurements was redefined to 10 mm + 15 ppm at a confidence interval of 67% (1σ). The growing CORSnet-NSW infrastructure (Lands, 2009a) utilises the internet to
broadcast correction data which is accessed by users, e.g., via the Next-G mobile phone network. This is a more reliable communications medium than UHF radio, particularly in metropolitan regions. These developments, coupled with the improved usability of modern GNSS equipment, have seen GPS surveying techniques, particularly RTK, being increasingly adopted by cadastral surveyors.
RTK GPS techniques have also been investigated by LPMA for upgrade of the DCDB to survey accuracy in certain regions. Watkins (2007) conducted a case study in the Penrith area to determine the optimal number of control marks required for a given area in order to produce a survey accurate DCDB.
network design and redundancy are required to achieve an acceptable control survey outcome (ICSM, 2007).
This paper demonstrates how the RTK GPS technique can be utilised to improve the survey control mark infrastructure available to cadastral surveyors by determining high quality 3D positions for an update of the state’s survey control database.
2. STUDY AREA AND OBSERVATIONS
2.1 The GAP Project
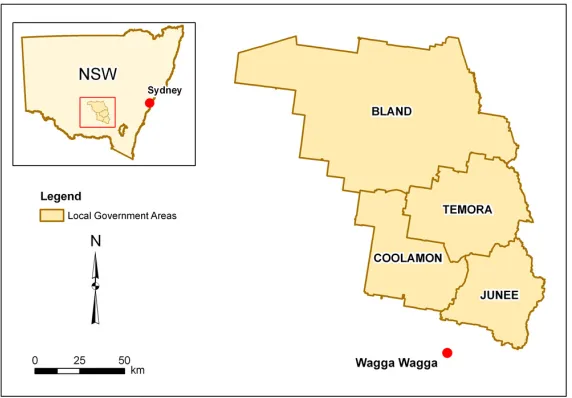
[image:4.595.156.442.332.531.2]In 2005, the Geospatial Alliance Project (GAP) was initiated as a consortium of five councils located in southern NSW, i.e. Bland Shire Council, Coolamon Shire Council, Junee Shire Council, Temora Shire Council as well as Goldenfields Water County Council, which includes the aforementioned council areas (Figure 1). The aim of GAP is to provide best practice spatial information and management services to the alliance members, including spatial data capture, management and maintenance, Geographic Information System (GIS) capabilities, staff training, technical support and building awareness of spatial information.
Figure 1: Local government areas involved in the GAP project.
The already established marks were to be used to investigate the quality of the survey and the methodology adopted for the cadastral infrastructure upgrade.
2.2 Study Area and Observations
This paper presents the results from the GPS survey covering Junee Shire Council (Figure 2), an area of about 2,030 km2, and details the procedure adopted for the SCIMS update process. RTK GPS observations were conducted by a third party after basic training between 15 January and 27 August 2008 using a typical single-base RTK scenario consisting of two (identical) dual-frequency GPS receivers operating at a sampling rate of 1 second and utilising a UHF radio link. The elevation mask for RTK processing was set to 13°, and relative U.S.
[image:5.595.85.513.249.546.2]National Geodetic Survey (NGS) antenna phase centre variation models were applied.
Figure 2: Survey marks occupied with GPS in Junee Shire Council.
km in length. Each point was observed several times (on different days) for at least 180 epochs, while three radiations to urban marks and two to rural marks were attempted. Up to six baselines were connected to each point, providing a high level of redundancy in most parts of the network.
All RTK rover observations were taken with a fixed 2-metre pole attached directly to the antenna, using a bipod for stability. The base station setups consisted of a tribrach and small (15 cm) extension pole on a pillar, with the exception of SS20270 and SS23156 where a tripod was used. Only ambiguity-fixed solutions were recorded. Site calibrations were not performed, allowing the raw data to be used.
3. DATA PROCESSING AND ANALYSIS
This section details the procedure adopted for data processing and analysis in order to determine high quality coordinates for the SCIMS update and to investigate the quality of the GPS-derived results.
3.1 Network Adjustment
The adjustments are based on the baseline vectors exported from the commercial GPS processing software package utilised, rather than the RTK-derived coordinates. The application of local rotations and scale changes during processing was not necessary. The observed ellipsoidal heights were transformed to the Australian Height Datum 1971 (AHD71) by applying the AUSGeoid98 (Featherstone et al., 2001).
3.1.1 Minimally Constrained Adjustment
The GPS dataset consisted of two unconnected sections. Firstly, a minimally constrained adjustment was performed holding only one base station in each section fixed (TS6635 and SS20270). The network was processed using Geolab 2001 version 2001.9.20.0 (Microsearch Corp, 2008) and initially consisted of 269 stations and 776 separate GPS baselines.
The initial observation weightings for the minimally constrained adjustment are summarised in Table 2. Geolab combined these with the RTK baselines’ variance-covariance (VCV) information to produce final baseline component weights.
Table 2: Initial GPS baseline weighting.
STD ppm Centring from Centring to Horiz. component 5 mm 0.7 1.5 mm 1.5 mm Vert. component 5 mm 0.7 2.0 mm 2.0 mm
were analysed and indicated contradictory GPS observations. These flagged residuals were noted and further analysed in the fully constrained adjustment. It should be noted that the standard deviations of the GPS observations used in the minimally constrained adjustment were too optimistic and therefore revised in the fully constrained adjustment.
3.1.2 Fully Constrained Adjustment
In addition to the five base stations (all classified horizontally as 2A0, i.e. Class 2A and Order 0), 141 stations were held fixed in the horizontal component (Table 3). In a first adjustment run, only the stations classified as 2A0 and A1 were held fixed, and the coordinates of a sample group of about 20 points were investigated. In a second run, the stations classified as B2 were also held fixed, and the resulting coordinates of the sample set were compared to their initial values. Since all differences remained below 10 mm, the fixed B2 control was left in the adjustment, allowing it to be highly constrained. Due to the adjustment being based on radiations, this is highly desirable when additional ground observations are to be added. It should be noted that there was no existing C3 horizontal control in the study area.
Table 3: Horizontal constraints.
Point class/order No. of fixed stations
2A0 9
A1 61
B2 76
[image:7.595.221.373.493.576.2]The network contained 184 marks with AHD71 heights of C3 or better, resulting in an orthometric height constraint for 68% of the stations. The weighting of these orthometric heights was based upon the marks’ class and order in SCIMS (Table 4). It is worth noting that the GPS base stations were all classified as LCL3 (i.e. levelled) in the vertical component, except TS6635 which was B3 (i.e. GPS-derived with less than ideal control).
Table 4: Orthometric height constraints.
Point class/order Uncertainty
LAL1 1 mm
LBL4 1 mm
LCL3 1 mm
B2 10 mm
B3 30 mm
C3 30 mm
Table 5: Final GPS baseline weighting.
STD ppm Centring from Centring to Horiz. component 10 mm 1.0 3 mm 5 mm Vert. component 30 mm 3.0 3 mm 3 mm
In order to increase the number of unestablished marks to be upgraded to established marks, additional information obtained from Deposited Plans (DPs) was included to supplement the adjustment (see section 3.1.3).
The fully constrained adjustment passed with a VF of 0.99, however 18 residuals were flagged as outliers. In addition, a further 43 baselines were found to have high residuals of >50 mm. Analysis of the affected baselines identified a problem at one of the base stations. Large variations (>100 mm) were evident in the baseline observations utilising TS10518 as base station on 5-6 March compared to the other days of the survey. Due to a lack of additional information, the source of these variations (e.g. maladjusted tribrach or incorrect setup) could not be determined. Therefore, all baselines from TS10518 on 5-6 March were removed, fortunately amounting to only 39 observations which represents 5% of the survey. In addition, one ground observation obtained from a DP was removed due to large residuals. It is worth noting that it was later found that this particular observation was actually erroneous in the DP.
The final adjustment contained 714 GPS baselines and failed with a VF of 0.67, suggesting that a tightening of the observation uncertainties was required. However, the VFs for ellipsoidal and orthometric height were determined to be 0.91 and 0.81, respectively, and the result was therefore deemed satisfactory. Hence, no scaling of the VCV matrix by the VF was adopted.
Five residuals were flagged in the adjustment but were deemed acceptable since these referred to constrained orthometric heights. In all five cases, at least three GPS observations were made to each mark. The values agree with each other, but disagree with the orthometric height for the mark by up to 125 mm, indicating a possible incorrect orthometric height for these marks. However, further analysis of each mark is required to confirm this.
All of the 13 residuals that were flagged in the minimally constrained adjustment (see section 3.1.1) passed in the fully constrained adjustment due to the larger observation uncertainties applied. However, closer inspection revealed that the GPS observations to each of these flagged marks disagree. The observations were left in the adjustment but the larger residuals were later taken into account when the affected marks were assigned an order (see section 4).
3.1.3 Additional Information obtained from Deposited Plans
In order to add information to the GPS observations in the adjustment, ground observations obtained from Deposited Plans (DPs) were utilised. The observed directions and distances between the marks were reduced to the ellipsoid. One of the purposes of this project is to upgrade unestablished marks to established marks. In order to achieve this using GNSS surveying techniques, three baselines from at least two different base stations must be observed (Lands, 2009c). Adding an observed ground connection between marks to the adjustment, enabled us to upgrade many marks that were only observed twice by GPS.
In total, 88 observations from 31 DPs, connecting 66 points, were added to the fully contrained adjustment. The observation weightings are based on similar adjustments previously performed by LPMA (Table 6).
Table 6: Weighting of ground observations derived from DPs.
STD ppm Centring from Centring to Direction 8” – 2.5 mm 2.5 mm Distance 10 mm 20 2.5 mm 2.5 mm
3.2 Absolute Accuracy: RTK vs. SCIMS on Established Marks
In order to investigate the absolute accuracy of the RTK GPS campaign and the presented methodology for cadastral infrastructure improvement, the calculated coordinates of all established marks in the survey were compared to their published SCIMS values. A constrained adjustment of the GPS network was performed, holding only the five GPS base stations fixed in the horizontal and constrained in the vertical component. The GPS observation weightings listed in Table 5 were applied, and no DP directions or distances were utilised.
As mentioned earlier, 141 of the surveyed marks were already established in both the horizontal and vertical component, while 43 were established only vertically. By running an adjustment that allows these established marks to float, a comparison can be made between the coordinates of these marks determined by the RTK GPS survey and their SCIMS values. Under the assumption that RTK GPS accuracy and the horizontal and vertical datums are relatively uniform across the study area, this will also give an indication of the quality of the presented methodology to upgrade unestablished marks using RTK GPS.
The adjustment achieved a VF of 0.41 and failed the chi-square test, suggesting that the input variances should be tightened. However, as this adjustment is being used for comparison purposes, this result was accepted. Two residuals were flagged but deemed acceptable since they referred to constrained orthometric heights, indicating a possible error in the orthometric height in SCIMS (cf. section 3.1.2).
observations used to establish these marks in the era before satellite positioning, although routine NSW survey control practices were followed at the time. The comparison exceeded expectations with a Root Mean Square (RMS) of 11 mm in the horizontal and 34 mm in the vertical component (1σ), indicating that the RTK GPS technique is well suited to improve
[image:10.595.177.419.177.225.2]survey control infrastructure for cadastral surveyors.
Table 7: Difference between RTK GPS and SCIMS coordinates.
Easting Northing Horizontal Vertical RMS 7 mm 8 mm 11 mm 34 mm Min. -18 mm -25 mm 0 mm -65 mm Max. 29 mm 36 mm 36 mm 137 mm
It should be noted that the difference in the vertical component exceeded +100 mm in seven cases. As previously mentioned, this indicates a possible problem with the orthometric heights of these marks given in SCIMS, as the GPS observations agree well with each other. Most of these marks are clustered in a group of four (B2, based on GPS observations in 1997/98) and a group of two (LAL1, optical levelling based on the same run), while the remaining mark is classified as LBL4 (i.e. optically levelled with less than ideal control). Further research is necessary in order to identify the cause of this discrepancy, which could, for instance, be due to local distortions in the geoid or weak levelling connections. However, this is beyond the scope of this paper. Removing these seven values reduced the RMS in the vertical component to 26 mm.
3.3 Relative Accuracy: RTK vs. SCIMS over Short Distances
[image:10.595.215.378.536.584.2]The relative accuracy of the RTK GPS results was investigated by determining the bearing and grid distance between 50 established marks, based on the initial, unadjusted RTK-derived coordinates as well as the given SCIMS coordinates. In order to pay particular attention to short distances routinely encountered by cadastral surveyors, the selected dataset contained distances ranging from 28 m to 332 m. Table 8 summarises the differences between the RTK-derived and SCIMS-RTK-derived values, based on a total of 51 bearing and distance pairs.
Table 8: Difference between values derived from RTK GPS and SCIMS coordinates.
Grid Distance Bearing
RMS 9 mm 14”
Min. -30 mm -33” Max. 14 mm 33”
It is evident that the values agree very well, with RMS values of 9 mm for the grid distance and 14” for the bearing (1σ). Figure 3 illustrates the entire dataset (absolute differences) as a
of 15” over 100 m, 10” over 200 m and 5” over 300 m result in horizontal position errors of 7.3 mm, 9.7 mm and 7.3 mm, respectively.
0 50 100 150 200 250 300 350
0 10 20 30
RTK-derived Distance vs. SCIMS
A b s o lu te D if f. [ m m ]
0 50 100 150 200 250 300 350
0 10 20 30 40
RTK-derived Bearing vs. SCIMS
Distance [m] A b s o lu te D if f. [ "]
Figure 3: RTK-derived distances and bearings vs. SCIMS (absolute differences).
Linear trend lines are also shown in Figure 3, however it must be emphasised that these are not statistically sound and can therefore only give an indication. The accuracy of the RTK-derived distances is very consistent, reflecting, in part, the local homogeneity of the Geocentric Datum of Australia (GDA94) and the uniform atmospheric conditions encountered in the study area. It should be noted that a similar accuracy can be expected over longer distances calculated in the study area since the differences reflect the quality of the RTK GPS observations, which is influenced by the baseline length between each mark and the base station(s) utilised as well as the network geometry, and not the distance between the two marks involved in the distance calculation. As expected, the quality of the RTK-derived bearings improves over longer distances since errors in the horizontal position have a lesser effect on the calculated bearing.
4. UPGRADE OF CADASTRAL SURVEY CONTROL
The main purpose of this study was to upgrade as many as possible of the observed unestablished marks to established marks in order to improve the survey control infrastructure available in the study area. According to the regulations, it is required that at least three baselines are observed from at least two separate base stations in order to upgrade an unestablished mark using RTK GNSS methods (Lands, 2006; 2007; 2009c).
[image:11.595.150.440.119.351.2](as they were already established in the vertical). However, five of these marks were excluded from the upgrade due to discrepancies in the GPS observations identified during the adjustment (see section 3.1.2). Therefore, 50 survey control marks met the upgrade criteria: 33 both horizontally and vertically, and 17 in the horizontal component.
A further 22 unestablished marks were observed twice with RTK GPS. By adding one or two ground observations obtained from DPs (see section 3.1.3), these also met the criteria to become established. One of these marks was excluded from the upgrade due to previously identified discrepancies in the GPS observations, leaving 21 additional marks to be upgraded to Class C (13 in both the horizontal and vertical components, and 8 horizontally only since they were already established vertically).
The remaining 51 unestablished marks were observed only once or twice with RTK GPS and suitable DP information was not available. The majority of these marks were initially classified as Class U in both the horizontal and vertical components, with eight marks being Class E either horizontally or vertically. Although these marks cannot be upgraded to established marks, it is possible to increase their class and order based on the GPS survey. All of the marks with two RTK GPS occupations were updated to Class D in both coordinate components (making them suitable for DCDB upgrades), while the five marks occupied only once were updated to Class E in both components.
The six unestablished marks that were initially excluded from the upgrade due to GPS observation discrepancies were updated to Class E in both components. Hence, all of the 128 surveyed unestablished marks could either be established to Class C (55%) or at least be updated to Class D or E (45%), resulting in a significant improvement of the cadastral survey infrastructure in the study area.
5. CONCLUDING REMARKS
This paper has presented a methodology for using RTK GPS observations to improve the existing cadastral survey control infrastructure, based on an extensive survey carried out in Junee Shire Council as part of the Geospatial Alliance Project (GAP). Of the 128 unestablished marks surveyed, 55% were able to be upgraded to established marks of Class C, while the quality of the remaining marks was updated to Class D or E. Improvements in the GPS survey design would have enabled an even higher percentage of marks to be classified as established. Ground observations obtained from Deposited Plans (DPs) provided valuable additional information for the adjustment.
The large number of already established marks surveyed enabled a thorough analysis of the accuracy achieved with the RTK GPS technique. The RTK positions of the established marks were compared against their SCIMS values, exceeding expectations with an accuracy (RMS) of 11 mm in the horizontal component and 34 mm in the height component (1σ). In addition,
agreed very well with the values derived from SCIMS, easily meeting accuracy specifications stated in the Surveying Regulation 2006.
The RTK GPS technique is well suited to improving survey control infrastructure for cadastral surveyors and has the potential to detect erroneous DP information. The ongoing expansion and densification of Continuously Operating Reference Station (CORS) networks, such as GPSnet (Hale et al., 2007) and CORSnet-NSW (Lands, 2009a; White et al., 2009) will further improve position accuracy and RTK range capabilities by providing network RTK services (e.g. Janssen, 2009; Norin et al., 2009). This infrastructure will provide cadastral surveyors with increasingly fast and easy access to highly accurate survey control, eliminating the need for surveyors to operate their own base station and thereby improving productivity. The presented methodology for updating existing survey control marks based on RTK GPS observations will also benefit from the increased number of CORS across the state, potentially removing the need for a temporary base station.
ACKNOWLEDGEMENTS
David Green is gratefully acknowledged for assisting with the extensive GPS field work, and Russell Commins is thanked for producing Figures 1 and 2.
REFERENCES
Featherstone, W.E., Kirby, J.F., Kearsley, A.H.W., Gilliland, J.R., Johnston, G.M., Steed, J., Forsberg, R. and Sideris, M.G. (2001) The AUSGeoid98 geoid model for Australia: Data treatment, computations and comparisons with GPS-levelling data, Journal of Geodesy, 75, 313-330.
Hale, M., Ramm, P. and Wallace, J. (2007) Legal positions and Victoria’s GPSnet, Proceedings of SSC2007, Hobart, Australia, 14-18 May, 163-176.
ICSM (2007) Standards and practices for control surveys (SP1), version 1.7,
http://www.icsm.gov.au/icsm/publications/sp1/sp1v1-7.pdf (accessed Sep 2009).
Janssen, V. (2009) A comparison of the VRS and MAC principles for network RTK, Proceedings of IGNSS 2009, Surfers Paradise, Australia, 1-3 December, 13pp.
Lands (2006) Surveying Regulation 2006, http://www.lands.nsw.gov.au/_media/lands/pdf/ legal/Surveying_Regulation_2006.pdf (accessed Sep 2009).
Lands (2007) Control surveys and SCIMS: What is acceptable?, http://www.lands.nsw.gov. au/survey_maps/surveying/survey_information (accessed Sep 2009).
Lands (2009a) CORSnet-NSW, http://corsnet.lpma.nsw.gov.au (accessed Sep 2009).
Lands (2009b) SCIMS online, http://www.lands.nsw.gov.au/survey_maps/scims_online
(accessed Sep 2009).
Lands (2009c) Surveyor General’s Direction No. 9: GNSS for cadastral and mining surveys,
http://www.lands.nsw.gov.au/about_us/publications/guidelines/surveyor_generals_directio ns (accessed Sep 2009).
Microsearch Corp (2008) Geolab software, http://www.msearchcorp.com/Products/GeoLab/
Norin, D., Hedling, G., Johansson, D., Persson, S. and Lilje, M. (2009) Practical evaluation of RTCM network RTK messages in the SWEPOS network, Proceedings of ION NTM 2009, Anaheim, California, 26-28 January, 353-359.
Roberts, C. (2005) GPS for cadastral surveying: Practical considerations, Proceedings of SSC2005, Melbourne, Australia, 12-16 September, 9pp.
Watkins, D. (2007) Optimising survey control using GNSS RTK & CORS networks for spatially upgrading the DCDB – A case study in the Penrith area, Final year thesis project, School of Surveying and Spatial Information Systems, UNSW, Sydney.
White, A., Yan, T., Janssen, V. and Yates, K. (2009) CORSnet-NSW: Delivering a state-of-the-art CORS network for New South Wales, Proceedings of IGNSS 2009, Surfers Paradise, Australia, 1-3 December, 7pp.
BIOGRAPHICAL NOTES
Volker Janssen is a GNSS Surveyor (CORS Network) in the Survey Infrastructure and Geodesy branch at the NSW Land and Property Management Authority in Bathurst, Australia. He holds a Dipl.-Ing. (MSc) in Surveying from the University of Bonn, Germany, and a PhD in GPS for deformation monitoring from the University of New South Wales (UNSW). He worked as an assistant lecturer at UNSW and as graduate surveyor in Sydney before being a Lecturer in Surveying and Spatial Sciences at the University of Tasmania between 2004 and 2009. Volker’s research interests are in the fields of geodesy and geodynamics, with an emphasis on GPS/GNSS studies and CORS networks.
Thomas Grinter is a graduate surveyor within the CORSnet-NSW team in the Survey Infrastructure and Geodesy branch at the NSW Land and Property Management Authority in Bathurst, Australia. He graduated with a Bachelor of Surveying (Honours) from the University of Newcastle in 2008 where he was awarded the University Medal for his outstanding performance.
Craig Roberts is a Senior Lecturer in Surveying/GPS/Geodesy at the University of New South Wales (UNSW), Sydney, Australia. He holds a Bachelor of Surveying from the University of South Australia and a PhD in GPS for volcano monitoring from UNSW. He has worked as a private surveyor in Adelaide, a Geodetic Engineer at UNAVCO, USA involved with GPS for geodynamic studies in Nepal, Ethiopia, Argentina and Indonesia, a Geodetic Engineer at the GeoForschungsZentrum, Germany and lectured at RMIT University, Melbourne. His current research interests involve leveraging CORS infrastructure for practical application to surveying and spatial information.
the Spatial Sciences Institute (2005-07) and currently sits on the State Committee supporting the Local Government representative on the CS2i panel.
CONTACTS
Dr Volker Janssen and Thomas Grinter Survey Infrastructure & Geodesy
NSW Land and Property Management Authority (formerly NSW Department of Lands) 346 Panorama Avenue
Bathurst NSW 2795 AUSTRALIA
Tel. +61-2-6332 8200 Fax +61-2-6332 8479
Email: Volker.Janssen@lpma.nsw.gov.au, Thomas.Grinter@lpma.nsw.gov.au Web site: www.lpma.nsw.gov.au
Dr Craig Roberts
School of Surveying and Spatial Information Systems The University of New South Wales
Sydney NSW 2052 AUSTRALIA
Tel. +61-2-9385 4464 Fax +61-2-9313 7493
Email: c.roberts@unsw.edu.au Web site: www.gmat.unsw.edu.au
Michael Troth
Manager, Geospatial Alliance Project Junee Shire Council
PO Box 93 Junee NSW 2663 AUSTRALIA
Tel. +61-2-6924 8100 ext 128 Fax +61-2-6924 2497