SIXTH FRAMEWORK PROGRAMME
PRIORITY 1.6.2
Sustainable Surface Transport
CATRIN
Cost Allocation of TRansport INfrastructure cost
D8 – Rail Cost Allocation for Europe
Version 3.0
May 2009
Authors:
Phill Wheat, Andrew Smith and Chris Nash (ITS) with contribution from
partners
Contract no.: 038422
Project Co-ordinator: VTI
Funded by the European Commission
Sixth Framework Programme
CATRIN Partner Organisations
VTI; University of Gdansk, ITS Leeds, DIW, Ecoplan, Manchester Metropolitan University, TUV Vienna University of Technology, EIT University of Las Palmas; Swedish Maritime Administration,
CATRIN
FP6-038422
Cost Allocation of TRansport INfrastructure cost
This document should be referenced as:
Phill Wheat, Andrew Smith and Chris Nash (ITS), CATRIN (Cost Allocation of TRansport INfrastructure cost), Deliverable 8 - Rail Cost Allocation for Europe. Funded by Sixth Framework Programme. VTI, Stockholm, 2009
Date: 06/05/2009 Version No: 3.0 Authors: as above.
PROJECT INFORMATION
Contract no: FP6 - 038422
Cost Allocation of TRansport INfrastructure cost Website: www.catrin-eu.org
Commissioned by: Sixth Framework Programme Priority [Sustainable surface transport] Call identifier: FP6-2005-TREN-4
Lead Partner: Statens Väg- och Transportforskningsinstitut (VTI)
Partners: VTI; University of Gdansk, ITS Leeds, DIW, Ecoplan, Manchester Metropolitan University, TUV Vienna University of Technology, EIT University of Las Palmas; Swedish Maritime Administration, University of Turku/Centre for Maritime Studies
DOCUMENT CONTROL INFORMATION
Status: Draft/Final submitted
Distribution: European Commission and Consortium Partners
Availability: Public on acceptance by EC
Filename: CATRIN Deliverable 8 060509.doc
Quality assurance: Jan-Eric Nilsson
Co-ordinator’s review: Gunnar Lindberg
Project summary
CATRIN is a Research project to support the European Transport Policy, specifically to assist in the Implementation of Transport pricing. CATRIN will increase the probability that new progressive pricing principles can be implemented which facilitate a move towards sustainable transport. CATRIN is both intermodal and interdisciplinary, emphasizes the need of new Member states, understands that different organisational forms require different recommendations, that recommendations need to be given in short and long-term perspective and that they have to be thoroughly discussed with infrastructure managers.
CATRIN will clarify the current position on allocation of infrastructure cost in all modes of transport. Pricing principles will be dealt with under the knowledge that they varies with the organisational structure of a sector. CATRIN will establish the micro-aspects of cost recover above marginal costs, including the results of applying a club approach and the implication of who bears the costs for cost recovery under alternative allocation rules, using game theoretic analytical tools.
1 Executive Summary ... 6
1.1 Background ... 6
1.2 Overview of research undertaken ... 6
1.3 Key findings from the wear and tear marginal cost research ... 7
1.4 Generalisation ... 8
1.4.1 Method ... 8
1.4.2 Recommended usage elasticities ... 9
1.4.3 Differentiating charges by vehicle type ... 10
1.5 Further infrastructure wear and tear marginal cost research issues ... 11
1.6 Recommendations on allocation of capacity costs ... 12
2 Introduction ... 14
3 Existing Best Practice ... 15
3.1 Overview ... 15
3.2 Vehicle simulation and asset degradation modelling ... 16
3.2.1 Track deterioration ... 16
3.2.2 Vehicle modelling ... 17
3.2.3 Combination of damage mechanisms ... 17
4 Econometric evidence on marginal infrastructure wear and tear costs ... 19
4.1 Introduction ... 19
4.2 Methodology ... 19
4.3 Overview of studies ... 21
4.4 Costs considered in each study ... 26
4.4.1 The cost base and valid comparisons across studies ... 27
4.5 Results: Usage elasticities ... 28
4.5.1 Comparison framework ... 28
4.5.2 Maintenance only cost: Total Usage Elasticities ... 30
4.5.3 Maintenance only cost: Passenger and Freight Usage Elasticities ... 35
4.5.4 Maintenance and renewal costs ... 36
4.6 Results: Marginal costs ... 37
4.6.1 Comparison framework ... 37
4.6.2 Maintenance only cost: marginal cost for all traffic... 38
4.6.3 Maintenance cost only: Marginal cost for passenger and freight ... 42
4.6.4 Maintenance and renewal cost ... 42
4.7 Context of CATRIN results vis-à-vis existing literature ... 42
4.8 Summary ... 43
5 Engineering evidence on marginal infrastructure wear and tear costs ... 44
5.1 Description of Track Sections ... 44
5.2 Results ... 45
5.2.1 Results by vehicle type ... 45
5.2.2 Results for passenger and freight ... 47
5.3 Summary and implications ... 49
6 Allocation of Capacity Costs ... 50
6.1 Introduction ... 50
6.2 Estimating the opportunity cost of slots ... 51
6.3 Charging according to capacity consumed ... 54
6.4 Avoidable cost of capacity ... 56
6.5 Summary ... 59
7 Recommendations ... 60
7.1 Introduction ... 60
7.2.1 Generalisation framework ... 60
7.2.2 Recommended usage elasticities ... 62
7.2.3 Differentiating charges by vehicle type ... 63
7.3 Recommendations on methodological best practice ... 64
7.4 Further infrastructure wear and tear marginal cost research issues ... 65
7.5 Recommendations on allocation of capacity costs ... 67
References ... 69
1 Executive Summary
1.1 Background
This deliverable reports on the work undertaken in Work Package 5 on rail cost allocation. This is one of four modal work packages in CATRIN; the others being air transport, water transport and road transport.
The work package objectives are:
To increase the understanding of the marginal infrastructure cost in the rail sector and examine the cost structure in the Case Studies based on D2.
As part of this process, to develop new methods as well as new data sets.
To conclude on the most important vehicle characteristics that influence rail damage and to estimate the magnitude of their influence based on existing knowledge.
To better integrate econometric and engineering research in this area.
To examine methods for the allocation of capacity costs to services/types of traffic This research builds on the research undertaken in the GRACE project. A review of this and other research was undertaken in Deliverable 1 (Link et al, 2008) of the CATRIN project. The review identified several outstanding research issues that related to both methodological inconsistencies across studies and some findings which did not seem plausible. All in all this limited the strength of recommendations drawn from this research.
For this Work Package we have undertaken case studies for countries which include the countries that previously have undertaken research in this area (Great Britain, Sweden, Switzerland and France), as well as for new countries. This allows us to revisit the previous research in a coordinated fashion as well as gain wider insight into the issues by expanding the number of countries considered.
1.2 Overview of research undertaken
We have built on the research in GRACE but also introduced new methodological coordination and innovations. The key research that has been undertaken within the Work Package is:
New econometric case studies for Great Britain, Austria, Sweden, Switzerland and France and an econometric study pooling data from Great Britain, Austria, Belgium, Netherlands, Ireland and the US. These are aimed at developing better understanding of infrastructure wear and tear marginal costs. All studies have adopted similar methodologies and ex post analysis of the results to make them as comparable as possible. New data sets have been used (Great Britain and pooled international case studies) while data sets for other studies have been refined.
An engineering case study examining the relative damage of different vehicle types. This provides useful information on the likely variation of marginal costs with vehicles and is a level of detail that is not feasible in econometric analysis.
Three case studies examining methods of allocating capacity costs to individual services. Two case studies are for Great Britain, one on determining avoidable cost, a long run concept, and the other on determining the opportunity cost of individual pathing slots, a short run concept. The link and node based charging system adopted in Italy is also reviewed.
1.3 Key findings from the wear and tear marginal cost research
The infrastructure wear and tear marginal cost research undertaken in CATRIN has applied new methods and provided new evidence on marginal costs for the case study countries. We have undertaken research which represents a clear step forward from that undertaken in the GRACE project. In particular we find:
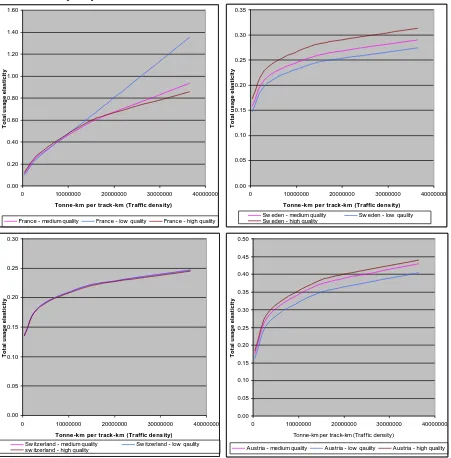
By decomposing marginal cost into average cost and the usage elasticity we can see the reasons for the large variation in marginal costs across countries and within countries. Average cost differs considerably between and within countries driven by differences in infrastructure quality and traffic density. In contrast usage elasticities do differ by traffic density but in a much more predictable manner;
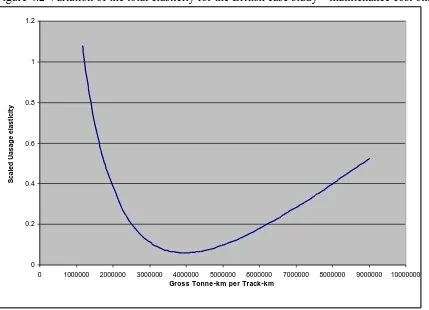
Unlike what we found in GRACE, usage elasticities seem to be increasing with traffic density, all other things equal. This has been found through adopting the more flexible Box-Cox models. Thus marginal costs do not necessarily fall indefinitely with traffic density;
The engineering case study has demonstrated clear differences in the damage per gross tonne-km for different vehicle types for the track sections considered. We have also had more success in incorporating passenger and freight measures into our econometrics. However for both these innovations it is difficult to generalise much from the specific results given that these results will be affected by the network maintenance policy, exact traffic composition and track characteristics. Further development of these methods is desirable;
In drawing conclusions from and comparisons across models we have controlled for infrastructure variables which has aided our understanding of the underlying cost variation; and
We have provided new evidence on renewal marginal costs for Switzerland and Great Britain.
We have developed clear recommendations on the range of elasticities to be applied in specific circumstances. Thus we now have a better understanding of why usage elastciities differ between countries;
In CATRIN we have introduced several methodological innovations over and above what was implemented in the GRACE project. These include the
Wide use of the flexible Box-Cox model;
Analysis of the composition of costs in each country to aid comparison of results across countries;
Harmonisation of method;
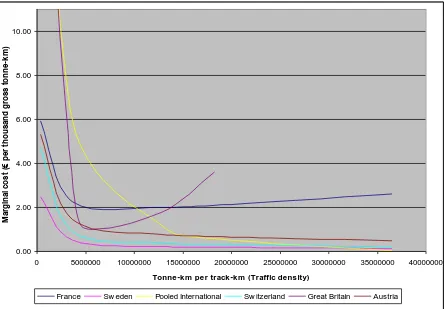
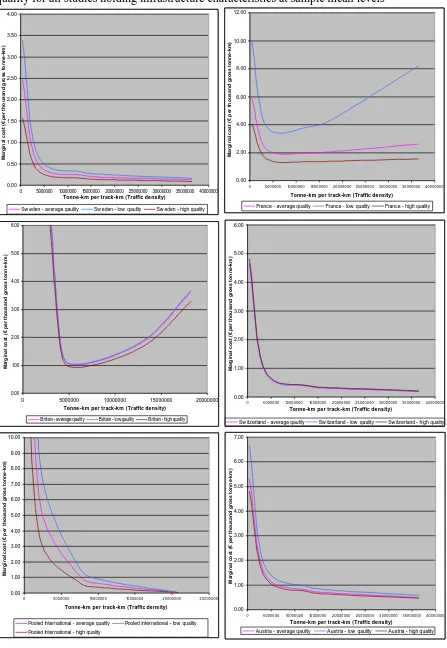
Use of simulation to plot marginal cost and usage elasticities with traffic density and infrastructure quality holding all other things equal;
1.4 Generalisation
1.4.1 Method
The methodological innovations have resulted in us knowing more about marginal cost and its variation both within and across countries. This allows us to easily generalise our findings and issue strong recommendations. A key finding of our research is that even when evaluated at country specific mean network measure, marginal costs vary considerably between countries. Also marginal costs vary considerably within countries. These differences are driven by many factors such as infrastructure quality and traffic density. As such it is difficult to generalise our results on marginal cost. Instead we note the relationship:
Marginal cost = (Average cost) x (Usage elasticity)
Inspection of the underlying data of the first component of marginal cost, average cost, reveals that average cost is very variable both between and within case study countries. This is intuitive as we would expect average cost to be impacted strongly by the infrastructure quality and traffic density differences across countries.
However we estimate much less variation in the usage elasticities across countries and within countries. It is important to note that we have utilised sophisticated econometic models which potentially allow the usage elasticity variation to be considerable, however we do not find this in our modelling. Thus the models have found less variation in usage elasticities (relative to marginal costs) across countries as opposed to the model structure imposing such a finding. As such we advocate recommending estimates of usage elasticities rather than specific marginal costs. These can then be multiplied by country specific average cost estimates to yield estimates of marginal cost. We do still find some variation in usage elasticities within countries, but there is a more systematic pattern which allows us to make recommendations for usage elasticities based on traffic density of the network.
Our research has clearly demonstrated that marginal costs differ considerably by traffic density and infrastructure quality. This supports charging different routes, each with different traffic density and infrastructure quality characteristics, within countries different marginal costs. This will be more cost reflective although there is the obvious trade-off between cost reflectiveness and complexity. Our proposed generalisation approach allows for this flexibility. This can be undertaken by the country simply providing average cost by route and choosing a suitable elasticity for each route from our research.
To summarise, we recommend generalisation as follows:
1. Country provides average cost either at the network wide level or for specific routes which have discernable traffic density and infrastructure quality characteristics;
2. The country should choose an appropriate usage elasticity for the network as a whole or for specific routes by reference to the traffic density the infrastructure in question; 3. For the network as a whole or for each specific route, the average cost and chosen
may be better to use these country specific estimates. However, we consider that the estimates in 7.2.2 are generally robust and so there maybe cause for concern should any country specific estimates differ substantially from those presented in 1.2.2.
Before our recommended values are presented it should be noted that it is important that the definition of average cost covers the cost elements to which the recommended usage elasticites apply to. In particular for maintenance only cost average cost should include the following elements:
Permanent way costs
Signalling and telecoms costs Electrification and plant costs
Network wide overheads should be excluded. For renewals, our recommended elasticities are less precise given the limited number of studies available for consideration. However we recommend that the average cost for maintenance and renewal includes all the elements of maintenance cost described above and also includes as many elements of renewal costs except for network wide overheads1.
1.4.2 Recommended usage elasticities
Table 1.1 outlines our recommended usage elasticities for maintenance costs. The elasticities are given by different traffic densities. We do not provide elasticities that vary with infrastructure quality since these differences tend to be relatively minor for the reasonable tonnage density levels considered in Table 1.1.
Table 1.1 Recommended usage elasticities by traffic density
Traffic density classification Low Medium High Traffic density range
(tonne-km / track-(tonne-km per annum) < 3,000,000
3,000,000-10,000,000 > 10,000,000 Recommended Usage
Elasticty 0.2 0.3 0.45
These values have been determined through comparison of the results of the six maintenance cost studies undertaken in CATRIN. We have made substantial progress in making the results comparable across countries and as such we have reasonable confidence that our recommended values are robust given the information available. There is still uncertainty associated with each recommend value and as such actual values maybe slightly different from those above (especially for the high traffic density value). What is important is that the usage elasticity is increasing with traffic density.
specific study to understand why the country in question differs from the benchmark values. Care should also be taken that the usage elasticities from any country specific studies are comparable with those in Table 1.1 in terms of the elements of costs considered in the study vis-à-vis those considered in the CATRIN study (see section 1.2.1).
We do not provide elasticities by passenger and freight traffic since we have no clear evidence that passenger traffic is more or less damaging per gross tonne-km than freight traffic. The engineering study found that passenger did slightly more damage than freight and this was supported by the econometric studies, however there was little consensus in relative magnitudes of the marginal cost for the two traffic types with some of the econometric results looking unrealistic. Further the engineering research indicated that freight could feasibly be more damaging than passenger traffic depending on the exact vehicle mix. We also note that any difference in the usage elasticity for each traffic type depends not just on differences in relative damage but also the share of total traffic of each traffic type.
For renewals costs we have a limited number of studies which can help in determining this usage elasticity. Further we are unable to give specific values for the usage elasticity by different traffic density (and infrastructure quality combinations).
As such we recommend that if countries want to charge for maintenance costs and renewals, they compute separate marginal costs for maintenance and renewal component. For the maintenance component, a country would use the usage elasticities in Table 1.1 multiplied by the appropriate average cost to come up with measures of marginal cost for the whole network or for specific routes within the network. For the renewal component we recommend that the country compute a network wide renewal marginal cost calculated as renewal average cost multiplied by an elasticity of 0.35. However there is a large degree of uncertainty for this estimate, partly because of the small number of supporting studies that have looked at renewal costs but also because of the disparate range of their results. As such this should be seen as a starting value which maybe improved upon should any country specific evidence be available.
1.4.3 Differentiating charges by vehicle type
The engineering research clearly demonstrated that there are large differences between the damage on the infrastructure for some vehicle types even per gross tonne-km. Therefore costs would be better reflected by differentiating the charges by vehicle type. This could be undertaken in a number of ways. One way is to come up with a charge per vehicle-km for every vehicle using the network. The advantage is that there are clear incentives to operators to run less damaging vehicles and demand such vehicles from operators. However, this would require a lot of work since a bespoke engineering study would be needed to determine the relative damages of the specific vehicles on the track.
If this approach was desired, the results econometric from CATRIN could be used to determine the actual amount of cost variable with traffic possibly differentiated by routes2, while a bespoke engineering model could then allocate this variable cost to vehicles. Thus the econometric results from CATRIN can be used but bespoke engineering models have to be developed separately.
A less resource intensive and complex method of differentiating charges is to adopt a bonus/minus system where the most damaging vehicles pay a higher charge per gross tonne-km and the least damaging vehicles pay a lower charge. All other vehicles pay a medium charge per gross tonne-km. This is likely to be less resource intensive as the engineering models only needs to identify the group of vehicles that are most and least damaging, rather than the exact relative damage of each vehicle.
1.5 Further infrastructure wear and tear marginal cost research
issues
In this deliverable we have made a large step forward in our understanding of how marginal costs vary across and within countries. Part of the success has been that we have undertaken a coordinated approach in statistical method, understanding the data and post processing of the model results. A further success factor has been the involvement of engineering experience and research in the project. This has helped us to evaluate the results of the econometrics and provide new evidence on the relative differences in damage of different vehicle types.
We consider that the outstanding research issues for the econometric models are:
1. The need to incorporate panel data techniques into models which use the Box-Cox functional form. This is potentially very important as the Box-Cox model seems to explain the data better than the equivalent double-log model, however we are currently unable to use panel data techniques to control for unobserved heterogeneity in these models;
2. Both pooling and country specific modelling approaches should be taken forward within future research. There are both relative advantages and disadvantages of each approach and both yield interesting insights into the differences in marginal costs across countries;
3. The pooling approach can be best developed through: a. Incorporation of more infrastructure variables; b. Incorporation of more years of data;
c. Further harmonisation of data definitions (particularly cost definitions)
4. To continue to develop further measures of usage elasticities and marginal cost which better harmonise for the actual quality of the infrastructure. This could involve specification of actual levels of each infrastructure quality variable for each study which is comparable with the levels used in all other studies, as opposed to defining them relative to sample reference points as adopted in this project. This is an onerous task but with suitable engineering advice may be achievable. Harmonising the infrastructure quality variables available for use in each study would obviously help this process.
5. Even when we control for infrastructure quality, we still find that track sections with low tonnage density have very high estimates of marginal cost. This could be because the models do not predict the marginal cost levels very precisely for these extreme observations, however this should be investigated further. In particular it would be useful to compute confidence intervals/prediction intervals for these observations/predictions.
panel. Further the further use of survival analysis should be considered. However both techniques require a long time series of data.
7. The quality and comparability of data across countries is critical for making valid comparisons and recommendations. Great effort has been taken to control for as many factors as possible in this research however we suspect that datasets are still not totally consistent between countries. This is partly because datasets are generally collected for purposes other than for econometric analysis. It would be better if the EC could urge member states to be more forthcoming with respect to data collection for future research purposes. There is a need to understand the composition of costs better and in particular eliminate any arbiter allocation of costs to observations as this can distort estimated results.
We consider that the primary outstanding research issue for the engineering analysis is to find ways to be able to better generalise the results of specific case studies. In CATRIN we only undertook case studies for two track sections in Sweden and it is not clear how transferable the results are to other track sections both within and outside Sweden. Therefore there is clearly the need to undertake more case studies across various countries.
To undertake a case study requires detailed information on traffic composition and characteristics as well as infrastructure characteristic data. They also take a long time to numerically compute and the results can be sensitive to fairly subtle differences in traffic and infrastructure composition. As such once a reasonably large number of case studies have been undertaken we could undertake statistical analysis on the outputs, relating damage to a simple set of variables describing traffic and infrastructure characteristics. This may provide a suitably simply means of generalisation of the engineering results.
1.6 Recommendations on allocation of capacity costs
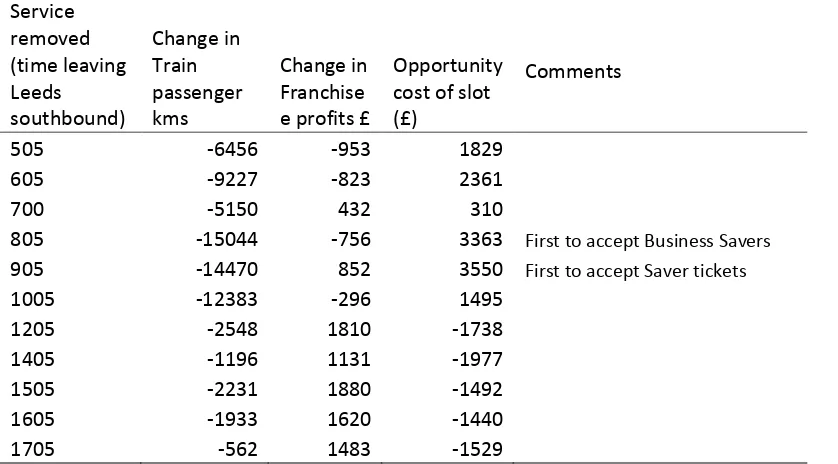
Wherever capacity is scarce, there is a strong argument for charging reservation fees to reflect the opportunity cost of slots, in terms of net revenue, unpriced user benefits and net external benefits. Ideally this would represent the net benefit of the second best use of the slot, which can only be known when all possible uses have been examined and the optimum determined. This is hardly practical as a way of setting tariffs when future demand for slots may come from unknown new entrants. More practical is setting a tariff according to the opportunity cost of the slot to the existing dominant operator. This is particularly the case when, as is the case on almost all routes in Britain, the dominant operator is a franchised passenger operator, with long term franchise and access agreements and for which detailed information on costs and demand is available to the franchising authority and the regulator. In other circumstances calculation of the charge will be more rough and ready, but – as long as care is taken not to set the charge so high as to lead to capacity being left unused – introduction of such a charge, reflecting the opportunity cost of taking slots away from the dominant operator, is likely to have a socially beneficial effect on timetable planning and the use of scarce capacity. An example derived from Britain illustrates how a relatively simple pattern of peak and off peak charges per slot may be derived, whilst Italian practice illustrates how a weighting may be applied to reflect the fact that trains travelling at a speed different from the optimal for the route in question consume more capacity than a single train of the dominant type.
of capacity in the long run. In this case the long run avoidable cost of the capacity in question should be reflected in a fixed charge to the customer concerned. Where open access competition exists, such a fixed charge might be problematic in terms of affecting the terms of competition between the incumbent and new entrants. But in the case of a monopoly franchise there is no such complication. Such a charge would be particularly relevant where a regional authority is responsible for franchising passenger services, whilst the national government subsidises infrastructure in general. Without such a charge, the regional authority has no reason to consider the costs of providing capacity when setting out its long term plans for the services in question.
Both the above developments in track access charging would increase the revenue of the infrastructure manager, reducing the burden on national taxpayers and easing the financial problems that infrastructure managers have when funding from the state is inadequate for its needs.
2 Introduction
This deliverable reports on the work undertaken in Work Package 5 on rail cost allocation. This is one of four modal work packages in CATRIN; the others being air transport, water transport and road transport.
The work package objectives are:
To increase the understanding of the marginal infrastructure cost in the rail sector and examine the cost structure in the Case Studies based on D2.
As part of this process, to develop new methods as well as new data sets.
To conclude on the most important vehicle characteristics that influence rail damage and to estimate the magnitude of their influence based on existing knowledge.
To better integrate econometric and engineering research in this area.
3 Existing Best Practice
3.1 Overview
Existing best practice in measuring rail infrastructure marginal wear and tear cost has been reviewed in Deliverable 1 of the project3. Previous studies in rail infrastructure costs can be
categorised into top-down and bottom-up studies. Top-down studies consider elements of total cost and use statistical or judgemental techniques to determine what elements or proportions of elements are variable with traffic. Bottom-up approaches utilise established engineering relationships to model directly the extra damage caused by more traffic and then apply unit costs of remedial work to determine the marginal cost.
Prior to the CATRIN research, there have been a number of detailed top-down econometric studies from both the academic and consultancy sectors in recent years attempting to quantify the marginal wear and tear cost of rail traffic covering a wide range of European railways. They find that average marginal costs differ considerably across countries ranging from 0.15 to 1.78 € per thousand gross tonne-km (TGTKM) for maintenance only cost and 0.79 to 4.99 € per TGTKM for maintenance and renewals. However there is more accord between the estimates of the proportion of costs variable with traffic across studies. This measure, also corresponding to the elasticity of cost with respect to traffic (herein called the usage elasticity) ranges from 0.07 to 0.26 for maintenance costs and 0.27 to 0.30 for maintenance and renewals costs4,5.
The review identified several outstanding research issues from the econometric studies to date. While the studies have provided fairly consistent estimates of the overall elasticity of maintenance costs with respect to traffic a number of outstanding issues were identified:
- Why do estimates of usage elasticity differ so much between countries?
- Why do estimates of marginal costs differ so much (and even more so than for the
elasticity estimates) between countries?
- Do usage elasticity and marginal cost fall indefinitely with traffic levels or is that result
purely due to limitations in model specification and data availability?
- Usage and elasticity and marginal cost estimates need to be obtained as a function of
vehicle characteristics and type of traffic;
- More systematic account needs to be taken of infrastructure characteristics, capability and
condition measures;
- Further studies on renewals costs should be carried out.
The review considered the bottom-up engineering models proposed and/or used in Great Britain and Sweden. In particular it showed how engineering relationships can be used to
3 Link, H., Stuhlemmer, A. (DIW Berlin), Haraldsson, M. (VTI), Abrantes, P., Wheat, P., Iwnicki, S., Nash, C., Smith, A., CATRIN (Cost Allocation of TRansport INfrastructure cost), Deliverable D 1, Cost allocation Practices in the European Transport Sector. Funded by Sixth Framework Programme. VTI, Stockholm, March 2008
allocate costs to specific vehicle types since the engineering models are sensitive to different vehicle characteristics.
The disadvantage of the engineering approach is that it models elements of work in a piece meal fashion and may miss important linkages within the system. As such it may under estimate marginal cost. It also relies on the availability of robust measures of unit costs for remedial work. Finally the engineering models themselves may rely on judgement which limits their applicability. Ultimately undertaking robust engineering bottom-up modelling of the railway system is a time and resource consuming task.
This contrasts to the econometric approach which uses realised cost data. As such it ‘lets the data speak’. However the econometric approach to date has been unable to disaggregate marginal cost between vehicles to any large degree. Also the econometric approach is not insusceptible to the influence of researcher judgement or the quality and consistency of the underlying data.
With the advantages and disadvantages of each approach in mind, we consider that there are two ways of developing the previous research in this area. First the results of either approach can be used to validate the results of the other. This addresses the concern that both approaches are not insusceptible to judgement or problems with data quality. Second the two approaches could be combined so that the econometric approach is used to determine what amount of cost is variable with traffic with the engineering models then allocating this cost to different vehicles depending on the damage characteristics of each.
In the remainder of this section we provide further details of engineering modelling approaches; in particular focusing on vehicle simulation models coupled with asset life models which constitute the methodology for the engineering case study within this Work Package.
3.2 Vehicle simulation and asset degradation modelling
3.2.1 Track deterioration
A number of modelling techniques have been developed in recent years and several powerful computer simulation packages are now available which allow accurate prediction of the levels of track damage caused by running individual vehicles on specific routes, and how these influence the rate of wear and other forms of damage to the various components making up the track. In assessing this degradation two key modes of maintenance activity are usually considered: (1) rail damage which is caused by the action of the wheel on the rail, and includes wear and fatigue of the rail surface; and (2) track settlement which is caused by the load of vehicle passages and results in uneven settlement of the track in the ballast. Rail damage is usually corrected by grinding (mainly using large automated grinding vehicles) and track settlement has to be corrected periodically by tamping, again usually using large dedicated vehicles.
then used to interpret whether the vehicle is damaging the track due to wear, rolling contact fatigue (RCF) or more commonly, a combination of both.
The vehicle damage in terms of track settlement has been studied by many researchers and particularly the Technical University of Munich analysed the ballast settlement under controlled laboratory condition and developed from this work equation to calculate the settlement rate. The following equation has been derived prediction of the mean ballast settlement:
Smed = 1.89 p lnN + 5.15 p1.21 lnN
Where:
N = number of axle passes
N = number of axle passes<10000 p = ballast pressure
Smed = mean ballast settlement
3.2.2 Vehicle modelling
The engineering analysis of railway track degradation described above requires the following input data:
Track characteristics Vehicle characteristics Traffic details
The track quality data and topographic route information are the input data to calculate the time response of a vehicle. Vehicle models are constructed using a dynamic analysis package (in this work the Vampire package has been used) and include details of masses, geometries, suspension components, number of axle and axle load. The damage for each type of vehicle is then grouped, considering the actual traffic scenario, to establish the weighting of predicted maintenance work required for freight and passenger vehicles separately.
3.2.3 Combination of damage mechanisms
The relation between track damage and cost is difficult to establish by engineering methods as it depends not only on the track condition and vehicle behaviour but on the decisions regarding maintenance and renewal. If historical information on maintenance costs is available and can be separately categorised into the different modes of deterioration then this can be used to allocate a weighting to the results from the engineering analysis.
infrastructure. TSPA has also been included in a new decision support tool known as VTISM (Vehicle Track Interaction Strategic Model). In the future TSPA or VTISM could be used to provide the overall cost framework within which the engineering analysis provides the specific vehicle contributions.
4 Econometric evidence on marginal infrastructure wear
and tear costs
4.1 Introduction
In this section we will summarise the results of the econometric case studies undertaken under Work Package 5. A full write up of each case study is provided in Annexes 1A-1F. We draw out useful results on usage elasticities and marginal costs and discuss how these vary with traffic.
The section is structured as follows. Section 4.2 describes the methodology adopted by the case studies. Section 4.3 gives an overview of each case study and section 4.4 compares the costs considered in each country. Section 4.5 reports on new evidence on usage elasticities and section 4.6 reports on new evidence on marginal costs.
New econometric case studies have been undertaken in five countries: Sweden
Switzerland Austria Great Britain France
A further case study was undertaken which pooled data over six infrastructure managers, namely Network Rail (Great Britain), OBB (Austria), Prorail (Netherlands), Amtrak (US), Irish Rail (Ireland) and Infrabel (Belgium). As described below, the purpose of this study, inter alia, was to consider the impact of estimating elasticities and marginal costs from a pooled, international sample of countries, as compared with analysing each country individually. However, it was not possible, owing to confidentiality agreements, to pool the individual datasets used in the CATRIN project. The sample used for this element of the analysis is thus based on a dataset generated as part of a separate project (see Annex 1F), but which includes two of the countries involved in the CATRIN project (Great Britain and Austria).
4.2 Methodology
Within the CATRIN research we have applied a consistent and coordinated approach to the econometric case studies. This includes following common methodology and analysing the results of the models in a similar way. In this sub-section we discuss the econometric method used in all studies; while sub-sections 4.5 and 4.6 describe, as a preamble to the actual results, how we coordinated analysing the results of the models.
Where
C is the maintenance and, if applicable, renewal cost per annum for section or zone i; i Q is outputs for section or zone i ; here in terms of traffic with vehicles of different i
types (A and B). In the above formulation a squared term is also included; and
Ii is a vector of fixed input levels for section or zone i – these include the
infrastructure variables (e.g. track length and track quality).
Given that we succeed in the estimation of the function in (1) the marginal cost can be derived as the product of the average cost (AC) and the cost elasticity ε. In the example above we included the square of the traffic variable QA which means that the elasticity with respect to
traffic type A is non-constant if β11 is non-zero.
) Q ln( 2 Q
ln d
C ln d dQ
Q C dC
A 11 1 A A
A
A
(2)
In the remainder of this report we refer to this elasticity as the usage elasticity with respect to traffic A. The average cost is simply the cost C divided by the relevant output variable Q. However, the average cost will depend on the traffic volume Q. Therefore the marginal cost will usually depend on the traffic volume.
A A
A Q
C Q Q
C AC
MC 1211ln( ) (3)
Two additional observations should be highlighted.
First, while the theoretical specification above includes different outputs in terms of different vehicle types, the reality is more problematic. This is because in reality, the correlation between different outputs is so strong that the econometric model has difficulty in distinguishing between the effect from different vehicle types. This issue has been re-examined in the CATRIN econometric studies
Secondly, input prices are often assumed to be constant between sections or areas and thus are not included in the studies.
In addition to the double log functional form, case studies have considered using the Box-Cox functional form. This is given by replacing the log (ln) transformation of variables by the Box-Cox transformation given by:
) 1
( w
w (4)
) C /( ) Q ( ˆ Q ln d
C ln d dQ
Q C
dC ˆ ˆ
A 1 A A
A A
(5)
This functional form nests several functions as special cases. It lets the data determine the appropriate functional form without (necessarily) having to rely on second order approximations as with the Translog function which requires more parameters to be estimated. Thus the Box-Cox is potentially very flexible while still relatively parsimonious which has the benefit of fitting the data well and yielding relatively precise parameter estimates.
As with the double log models, marginal costs are computed as the product of the estimated elasticity and fitted average cost.
Before proceeding further, it is useful to clarify the terminology used for different functional forms in the subsequent discussion. In particular we define:
Double log functional form to be any functional form where the dependent and the explanatory variables are in logarithms. This may include first order terms and second order terms (including interaction terms) in explanatory variables;
Cobb Douglas functional form is a special case of the double log functional form as it only includes first order terms;
Translog functional form is also a special case of the double log functional form as it includes all first and second order terms (including interactions);
Box-Cox functional form. This is not nested within the double log functional form (some specifications of the double log are nested within the Box-Cox). In this functional form, the dependent variable and a selection of explanatory variables are transformed by the Box-Cox transformation.
4.3 Overview of studies
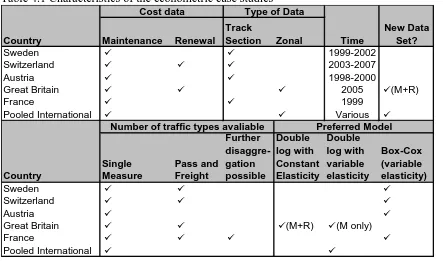
Table 4.1 summaries the characteristics of each of the case studies. In the table, the term “zone” relates to some geographical area or region within a country at which maintenance cost data can sensibly be analysed. Zones comprises a number of track sections, and thus track section data is more disaggregated than zonal data. The studies have utilised both new and existing data sets.
Where existing data sets have been used, the emphasis was to undertake a coordinated and robust re-examination of the data. This included the use of Box-Cox models and where possible inclusion of separate passenger and freight traffic variables. Coordination of the case studies was via specification of which models were to be estimated and then what outputs are needed from each study in order to better compare the results. Where new datasets were available, these were first cleaned and then a similar coordinated methodological approach was applied to data analysis.
Table 4.1 Characteristics of the econometric case studies
Country Maintenance Renewal
Track
Section Zonal Time
Sweden 1999-2002
Switzerland 2003-2007
Austria 1998-2000
Great Britain 2005 (M+R)
France 1999
Pooled International Various
Country
Single Measure
Pass and Freight
Further disaggre-gation possible
Double log with Constant Elasticity
Double log with variable elasticity
Box-Cox (variable elasticity)
Sweden
Switzerland
Austria
Great Britain (M+R) (M only)
France
Pooled International
New Data Set? Cost data Type of Data
Number of traffic types avaliable Preferred Model
Sweden (Annex 1A)
For Sweden, the same dataset as that used in GRACE was used. However new functional forms were applied to the data and the issue of disaggregating traffic measures into passenger and freight was revisited, following poor results in the GRACE project. In addition, various sensitivities are applied to the data in line with our approach to achieve greater comparability between country case studies.
The available data set consists of some 185 track sections with traffic (freight and/or passenger) that we observe over the years 1999 - 2002. A track section is a part of the network, normally a link between two nodes or stations that varies in length and design. Each track section observation has information on annual maintenance costs , traffic volumes (gross tonnes) for freight and passenger trains as well as a range of infrastructure characteristics, inter alia track length, track section length-to-distance ratio, length of switches, average rail age, number of joints (joints) and average quality class. Maintenance costs are derived from Banverket’s financial system and cover all maintenance activities. Both corrective and preventive maintenance is included, but winter maintenance (snow clearing and de-icing) is not included. Major renewals are also excluded, but it does include minor replacements considered as spot-maintenance. Infrastructure characteristics are taken from the track information system at Banverket and traffic volumes from various Swedish train operating companies.
models are found to be preferred following the rejection of the double log restrictions. However concerns are raised as to the sensitivity of the Box-Cox model when interaction terms are introduced between traffic and infrastructure variables. For freight only lines a double log model is used.
Switzerland (Annex 1B)
The data used is based on the whole railway network of Switzerland including all main lines. This network can be divided into almost 500 sections. Most of these sections are maintained by SBB, some by other licensed railway companies. For every section a record of data was gathered for the years 2003 to 2007. A section is not strictly homogeneous, that is, between its endpoints it can vary in terms of rail and sleeper types, ballast, curvature, slope etc. The Swiss national rail network comprises approximately 4,900 kilometres of track, of which 56 percent is double track. Not all of the track sections in the data base can be used for various reasons including ownership and remapping over the period. This results in 366 observations (track sections) per year to analyze with complete information.
Traffic data includes average daily data on number of trains, axle load and gross-tons per track, as well as yearly data on train kilometres, axle load kilometres and gross-tonne-kilometres per track for the main lines. Importantly this is available for passenger and freight traffic separately. The analysis focused on the use of gross-tonne-kilometres and train kilometres as main cost drivers. Infrastructure variables includes track length, switches, bridges and tunnels, radius and slope, noise and fire protection, rail age and sleepers age as well as maximum line speed.
The modelling considered both double-log and Box-Cox models and found the Box-Cox model was preferred and in addition a small set of interaction terms were also found to be advantageous.
Austria (Annex 1C)
The study had access to a three years cross-sectional data set at the level of track sections which was also used in an earlier Austrian study6 (see Munduch et al. 2002). It contains for
each of the years 1998, 1999 and 2000 observations for 220 track sections of the ÖBB network. For each track section, the costs of maintenance and renewals, the gross-tonne kilometres, train-kilometres as well as loaded and empty wagon-axle kilometres is reported. Data was not available for passenger and freight traffic separately. Data on infrastructure characteristics (track length, track class, length of single and double track tunnels, bridges, gradients etc.) and on infrastructure condition (age of tracks) was available. The cost data were deflated at 2000 prices7 and are expressed in Euro. The original dataset was corrected by
excluding implausible observations (such as share variables of more than 100%), coding errors and incomplete observations across the three years for some of the sections. The dataset finally used for this case study contains 211 sections, e.g. 633 observations.
The study estimates both double log and Box-Cox models and the Box-Cox model was found to be preferred. This is because the Box-Cox model has better fit and the nested double log model can be rejected.
While this study does not consider new data, this data has been analysed in a coordinated fashion with regards to the other case studies and passenger and freight traffic distinction has been re-examined.
France (Annex 1D)
The data available for France is a cross section from 1999 for maintenance costs. There are approximately 1500 track sections in the data set, although this dataset had to be reduced to under 1000 (exactly 928) to remove track sections with zero observations for some traffic types. In this sample, 95% of maintenance costs are recorded at track section level, but no renewal costs.
Traffic data is available for four categories: freight, Paris regional & suburban, passenger regional and passenger intercity. While data is available for both tonne-km and train-km it was decided to utilise the tonne-km data as this had performed well in past studies and aids correspondence with other studies. There is also a raft of infrastructure data available for the study and this includes “State variable” (Switches per segment, length in meters, power type and type of traffic control) and “Quality variables” (age of rail, age of sleepers, maximum line speed, share of concrete sleepers).
Both the double log and Box-Cox functional forms were tested and the sensitivity of the functions to the inclusion and exclusion of state and quality variables was examined.
In addition to the study on maintenance costs, a further study examining the variability of operations costs (train pathing and day-to-day signalling operations) has been undertaken. This was at a regional level and is reported in detail in Annex 1Diii. We do not report the results in this main body, given that there are no comparable studies.
Great Britain (Annex 1E)
This study is a direct update of the study undertaken by Wheat and Smith for the GRACE project and reported in Wheat and Smith (2008). Here this is updated from considering maintenance expenditure only to considering maintenance and renewal expenditure. In addition, various sensitivities are applied to the data in line with our approach to achieve greater comparability between country case studies. Cross section data from Network Rail for 51 Maintenance Delivery Units (MDUs) for 2005/06 is used. 67% of total maintenance expenditure is available at the MDU level. The remaining expenditure (33% of the total maintenance budget) includes maintenance of electrification and plant equipment and other expenditure and can not be allocated to individual MDUs. The cost categories allocated to MDU consist of signalling and telecoms (15% of total maintenance), Permanent way (34% of total maintenance) and General MDU expenditures. In addition we have available track renewal data which comprises renewal expenditure related to the Permanent Way.
Information on the infrastructure includes data on length by track type, maximum line speed and axle load, signalling equipment, rail age and length of electrification. Of these variables length of track, proportion of track length with maximum axle load greater than 25 tonnes, with maximum line speed greater than 100 mph, with continuous welded rail (CWR) or proportion with rail age above 30 years and a labour price index, were included in the final model.
Both the double log and Box-Cox functional forms were tested although the final model was relatively simplistic, being a double-log constant elasticity model. This reflects the difficulty in doing analysis of renewals costs with a cross section of data.
Pooled International Study (Annex 1F)
To date econometric infrastructure wear and tear marginal cost studies have been conducted through analysis of cost, traffic and infrastructure data on a country-by-country basis (see Deliverable 1 (Link et al, 2008) for a survey). However, each study utilises data with subtly different definitions and the datasets tend to contain a different mix of infrastructure variables. Also the statistical methods applied and specification used in each study differ from case study to case study. This presents a challenge for making recommendations from the results of such studies, since it is not clear whether differences in results between studies are genuine differences between countries or are simply artefacts of the data and method differences. As noted earlier, one of the main aims of this work package of the CATRIN project has been to achieve greater comparability between studies by imposing commonality across case studies as far as possible (for example, common functional form). However an alternative approach to the problem is to pool data across several counties and analyse this data through one statistical model.
The study utilises a bespoke dataset on six countries (five of which are in the European Union) for which data collection has been undertaken over a number years in cooperation with infrastructure managers. The data was initially used as part of the 2008 Periodic Review of Network Rail undertaken by the Office for Rail Regulation (ORR) in Great Britain (Smith, Wheat and Nixon, 2008)8. For that study, the primary use of the data was to assess the efficiency of Network Rail and other infrastructure managers. However the dataset is also suitable for measuring marginal costs.
It should be noted that the pooled sample used in this paper is not a pooling of all of the data for the individual CATRIN case studies (Sweden, Switzerland, France, Great Britain and Austria). Such an approach would have been highly desirable, but was not possible due to confidentiality agreements / understanding between the individual CATRIN partners and the data providers. However, the sample used in this paper includes data for two of the countries covered by the CATRIN case study (Great Britain and Austria) and so comparisons can be made for those countries. The other countries covered in this study are the US (Amtrak), Belgium (Infrabel), Ireland (Irish Rail) and The Netherlands (ProRail).
tonne-km measure (the sum of passenger and freight gross tonne-tonne-km) and infrastructure data on track length and proportion of track length electrified is available. The total number of observations for analysis over the 6 countries is 96 (an unbalanced panel).
The data is analysed using panel data techniques and a double-log functional form. The pooled international study found that estimates of the usage elasticity and marginal costs which are comparable to previous studies. However, the model seems quite imprecise (in the sense of overall fit and variance of parameter estimates), which perhaps is the biggest limitation of using a pooled model in this case, where the sample size was relatively small, and the panel was quite unbalanced. However, in principle, if it had been possible to pool all of the data from the CATRIN partners, then the sample size would have been much larger. The study also examined and produced some useful results concerning the impact of using datasets based on different levels of aggregation (i.e. zonal versus track section data). As such we conclude that this approach should be developed in tandem with the country specific studies in future.
4.4 Costs considered in each study
Before the results of the studies are described it is useful to consider what elements of maintenance (and renewal costs if applicable) are considered in each study. This will be important when comparing the results of studies because different elements of cost will have different variation with traffic.
A broad description of the cost elements considered in each study is given in the study’s respective Annex. Given the abundance of case studies that have looked at maintenance only costs, there is a strong need to compare the results against each other in a robust manner. To do this we review the components of each study’s cost measure. We define four categories of maintenance cost:
Permanent way maintenance – maintenance of the rails, sleepers and ballast;
Signalling and telecoms maintenance – maintenance of signalling and any line side telecommunications
Electrification and plant maintenance – maintenance of contact electrification apparatus, plant (such as pumping stations, signal power supplies and point machines) and distribution equipment (such as cables and transformers)
Other maintenance – that can be reasonably allocated to track section level including inspections and maintenance of noise protection and environmental management Table 4.2 shows which categories are considered in each study and the resulting proportion of total maintenance cost considered in each study9. Most studies have considered the whole of
maintenance cost while the study in Great Britain, and to a lesser extent the Pooled International study, have examined a more restrictive definition.
Table 4.2 Cost considered in each country10 Country
Permanent Way
Signalling and Telecoms
Electrification and plant Other
Sweden 100%
Switzerland (All of Contracting A) 100%
Austria 100%
Great Britain (Part) 67%
France 100%
Pooled International (Part) 90%
Maintenance category Proportion of total maintenance cost considered in the study
Renewal costs are considered in Switzerland and in Great Britain only. In Great Britain this relates to track renewal only (renewal of rails, sleepers and ballast). The definition in Switzerland is broader as it covers all line side work.
4.4.1 The cost base and valid comparisons across studies
The difference in the cost considered between studies raises the question as to whether it is valid to compare the results between studies. In this deliverable we consider two results from the studies; usage elasticities and marginal costs. In this sub-section we discuss any adjustments necessary to each of these results to make valid comparisons across studies due solely to differences in the cost base for each study. Sections 4.5.1 and 4.6.1 consider other issues that are necessary to consider for comparing usage elasticities and marginal costs respectively across studies.
Marginal Costs
For the maintenance only studies, it is not considered that any adjustment needs to be made to the marginal costs for each study, due to differences in the cost base, in order to make valid comparisons across studies. This is because we believe that for the British and Pooled International case studies (i.e. those studies that include less than 100% of maintenance costs) it is reasonable to assume that all the excluded cost is not subject to usage related damage. In particular all studies consider permanent way costs which will have the most usage related damage associated with it. Also the excluded costs are simply overheads (Britain and Pooled International), signalling and telecoms (Britain only) and electrification11 and plant (Britain only). All of these cost elements are likely to have minimal usage related variability. Thus, apart from sampling error, the marginal costs derived from a model which considered 100% of cost should be the same as those derived from the (available) restricted set of costs.
The case of comparing the marginal costs from the two maintenance and renewal studies is more problematic. For the Great British renewal cost study, it is no longer the case that we would expect the excluded cost not to have any usage related damage. In particular, cost elements such as renewal of electrification equipment are excluded from the cost base which would be expected to have some usage related damage. However without undertaking econometric analysis of this cost category, it is difficult to specify any quantitative adjustment
for the marginal costs. Any adjustment would be upward for Britain, since it only includes track renewals.
Usage elasticities
For the maintenance only models there is a need to scale the estimated usage elasticity by the proportion of costs considered in the study. In the discussion of marginal cost adjustments, we assumed that any excluded cost is not subject to usage related damage. Put another way, this assumes that the excluded costs are not variable with traffic. As such, all other things equal, the usage elasticity will fall as more of the excluded costs are subsequently considered. More formally, the elasticity is equal to the ratio of marginal cost to average cost. As we include more of the originally excluded costs into the cost base marginal cost will (by assumption) stay constant, but average cost will fall. In particular the relationship between average cost under the restricted cost base (AC ) and average cost under the 100% of the cost base (R AC ) F is given by
p AC
ACF R (6)
Where p is the proportion of cost considered in the study. This in turn implies: p
p AC
M C AC
M C R
R F
F
(7)
When we consider maintenance and renewal costs it is no longer possible to assume that the excluded cost elements will not be variable with traffic. All we can say is that the actual elasticity will lie between that estimated directly from the model and that given in equation (7) above12.
4.5 Results: Usage elasticities
4.5.1 Comparison framework
As described in section 4.2, the usage elasticity shows the proportionate change in cost in response to a proportionate change in an output. Alternatively the usage elasticity can be thought of as the proportion of costs that are found to be variable with traffic. In this sub-section we present the results from each case study regarding estimated usage elasticities. A key aim of this project is to compare the usage elasticities across countries and discover how these change with traffic density and infrastructure quality. As such it is first necessary to consider the appropriate way to compare such results. Two questions arise from this task.
First, what summary measure is most appropriate for comparing usage elasticities across countries? Second, how can we compare the variation in usage elasticities within individual countries (with respect to traffic density and infrastructure quality) across the different countries included in this project? The latter is not straight forward becuas ethe relationship between the usage elasticity and traffic is complicated by the fact that other variables (such as infrastructure quality and other characteristics) also change with usage.
When deciding on the appropriate summary measure there are several possible candidates. We discuss each in turn below.
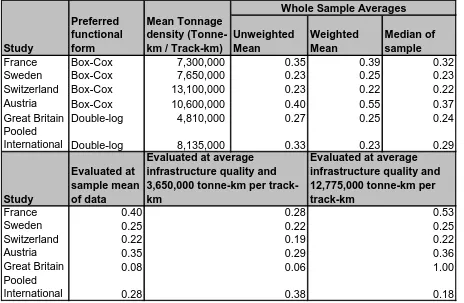
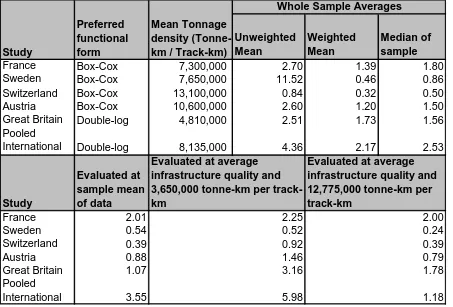
Whole sample averages
A simple summary measure of the usage elasticity for an individual country is to take an average of those estimated for each observation of the model. The average could be a simple mean of all observations or an average weighted by gross tonne-km. The latter assigns more weight to those observations with more traffic and can be thought of as an average elasticity from a random sample from all the gross tonne-kms on the network. These measures have been reported in studies to date (for example those in GRACE).
The measures may have relevance when we need to know likely cost recovery ratios in individual countries. However they are of limited use when comparing results across countries, with a view of forming recommendations on what value of the usage elasticity is appropriate in certain circumstances, for the following reasons. First, the measures utilise the entire sample in their computation and thus are impacted by the tails of the distribution, which are likely to be imprecisely estimated by the model. This problem is more acute in the weighted average measure, which weights the observations in one tail much higher than in the other. Therefore, these measures (and in particular the weighted average measure) are likely to be affected by the degree of skewness in the distribution of usage elasticities and this maybe a reason for suspecting a priori that these measures would not be the same across countries. Second, in computing average elasticity measures there is no attempt to adjust for systematic infrastructure quality and traffic density differences across countries.
An alternative measure is the median usage elasticity. This is less susceptible to the skewness of the distribution and the inaccuracies of the estimates in the tails. However it still suffers from the short coming that there is no attempt to adjust for differences in the average values of traffic density and infrastructure quality between countries.