This is a repository copy of
Improved real-space genetic algorithm for crystal structure and
polymorph prediction
.
White Rose Research Online URL for this paper:
http://eprints.whiterose.ac.uk/4047/
Version: Submitted Version
Article:
Abraham, N. L. and Probert, M. I. J. orcid.org/0000-0002-1130-9316 (2008) Improved
real-space genetic algorithm for crystal structure and polymorph prediction. Physical
Review B. 134117. pp. 1-6. ISSN 2469-9969
https://doi.org/10.1103/PhysRevB.77.134117
[email protected] https://eprints.whiterose.ac.uk/
Reuse
Items deposited in White Rose Research Online are protected by copyright, with all rights reserved unless indicated otherwise. They may be downloaded and/or printed for private study, or other acts as permitted by national copyright laws. The publisher or other rights holders may allow further reproduction and re-use of the full text version. This is indicated by the licence information on the White Rose Research Online record for the item.
Takedown
If you consider content in White Rose Research Online to be in breach of UK law, please notify us by
promoting access to White Rose research papers
White Rose Research Online
Universities of Leeds, Sheffield and York
http://eprints.whiterose.ac.uk/
This is an author produced version of a paper published in Physical Review B.
White Rose Research Online URL for this paper:
http://eprints.whiterose.ac.uk/4047/
Published paper
Abraham, N.L. and Probert, M.I.J. (2008) Improved real-space genetic
algorithm for crystal structure and polymorph prediction, Physical Review B,
Volume 77 (13), 13417.
An Improved Real–Space Genetic Algorithm for Crystal Structure and Polymorph Prediction
N.L. Abraham and M.I.J. Probert
Department of Physics, University of York, Heslington, York, YO10 5DD, United Kingdom
Existing Genetic Algorithms for crystal structure and polymorph prediction can suffer from stagnation during evolution, with a consequent loss of ef£ciency and accuracy. An improved Genetic Algorithm (GA) is intro-duced herein which penalizes similar structures and so enhances structural diversity in the population at each generation. This is shown to improve the quality of results found for the theoretical prediction of simple model crystal structures. In particular, this method is demonstrated to £nd three new zero–temperature phases of the Dzugutov potential that have not been previously reported.
PACS numbers: 02.70.-c, 61.50.Ah
I. INTRODUCTION
Genetic algorithms (GAs) are emerging as a useful tool in the theoretical prediction of crystal structures (see Abraham and Probert1, and references therein)2–4. During a GA calcu-lation it is possible that the system will stagnate. When stag-nation occurs, one or more local minima dominate the search and the method is unable to £nd the global minimum solu-tion. In this communication we improve the convergence to the global minimum solution of the CASTEP–GA1 through the use of a £tness function which is able to differentiate struc-tures during the course of a GA minimization.
Binary–encoded GAs such as the method of Hart et al.5, Blum et al.6 are able to directly compare the binary strings that make up their population members and determine if two populations members are the same. In this way it is possi-ble to remove any highly prevalent local minimum from the population, and prevent its creation in future mating opera-tions. While this method is not possible in the frame–work of the CASTEP–GA, we have developed an alternative approach that signi£cantly reduces the stagnation rate and also forces the system to explore new minima. This alternative approach is also broadly transferable to a wide range of other GAs.
II. METHOD
Our GA method1 is a real–space encoded technique for crystal structure prediction which takes advantage of the pe-riodicity of the simulation supercell to improve the speed and accuracy of convergence to the global minimum free-energy crystal structure. There is a population of structures (or
mem-bers) which are bred together to produce new members, such
that with each subsequent generation the population evolves in an attempt to determine the global minimum structure. The
£tness function of the GA is used to determine how good
(“£t”) a structure is and this is then used to weight the prob-ability of survival of that structure and its probprob-ability to pro-duce offspring.
While this method has been very successful in the past, we wanted to reduce the stagnation rate and thereby improve the quality of the solutions produced during a GA structure search. Since this is a real–space based approach it is not pos-sible to directly compare the atomic co–ordinates of two
pop-ulation members to determine if they are the same structure. In our previous work1, the enthalpy of the structure was used to calculate the £tness. In this work, we propose augment-ing this £tness function with an additional function which is able to determine the similarity of two structures. We shall illustrate the effectiveness of this new approach by £rst study-ing the Lennard–Jones crystals for comparison with our previ-ous results and then the high pressure phases of the Dzugutov potential7.
The enthalpy–based £tness function is
(1)
with the variable
being de£ned by
! "
! #%$& '!
" (2)
where! #%$ is the enthalpy of the highest enthalpy member
of the population,! "
is the enthalpy of the lowest enthalpy member and
is the enthalpy of the member( being
consid-ered. The £tness of each member( is
and this is a function which varies between zero and one. Population members with a £tness close to zero are less “£t”, and members with a £t-ness close to one are more “£t”. Population members are then selected (using roulette–wheel selection) for reproduction or are removed from the population based on this £tness value.
This should mean that only £t members are selected to re-main in the population, or are allowed to breed (crossover). It is often very likely that during the course of a calculation mul-tiple copies of population members are made. In a bit–string represented GA duplicate members are very easy to spot but in a real–space encoded GA it is very hard to tell if two members are the same during the course of a calculation, since the crys-tal structure may be orientated or translated in any way within the simulation cell (due to use of periodic boundary condi-tions). This is even harder if the simulation cell parameters are also allowed to vary during the course of a calculation.
2
Since we are using this routine to differentiate between like and unlik)
e structures, rather than any form of comprehensive structural analysis, we can simplify this comparison some-what. If we are performing a calculation in which we allow the number of atoms to vary, then we can make an educated guess that two structures with different numbers of atoms are different (or rather in this case any offspring produced in the crossover procedure will have a greater number of degrees of freedom to explore the potential energy surface), so we will have no need to compare these structures. We also do not need to compare each structure with all other structures, since we are merely trying to prevent stagnation rather than give a de£nitive structural comparison, and so we can simply com-pare all structures with the minimum enthalpy structure which has the same number of atoms as itself that exist in the current generation. We will de£ne a comparison function between structures which returns zero if the structures are the same and one if the structures are suitably dissimilar. We also want to keep the fact that lower enthalpy structures are “better” than higher enthalpy ones, so we further weight the value that any given structure has by the value of
of the £ttest member in that “set” which is made up of members with the same num-ber of atoms. Here we de£ne our improved £tness function as * ,+ .-/ * 10 -* 2354,6 (7 (98 :
;<>=@?AB (DC7 (98
(3)
where the left–superscript E above denotes comparing
be-tween groups with the same number of atoms only,
is as de£ned in equation 1,F is a weighting value between zero
and one and :
;G>= ? is a function which compares
mem-ber( of the set of atomsE with the £ttest member in that set (as
de£ned by equation 1). This means that the £tness of the £ttest member of each group (
*
2@4
) will be unchanged from its en-thalpy value, and all other values in the group will be scaled accordingly. If the value of the £tness weight,F , is set to
then the maximum value of
*
+
that any member could have is the same value of the £ttest member of the group,
*
234
. IfF is
set to zero then this function reduces to that given in equation 1. The comparison function:
;<H=? is : ;<>=?B I@JLK ; + H=?M G;<H=? K I3J ; + >= ? (4)
where consideration of the spherically averaged scattering in-tensity leads to
;<>=@? ONQP RTS "@UWV +P XW 0 (5) S "@UYV S DZ " +P 5XY3 +P
[,\] ^ _`a=? Kcb
"
b K
which is positive–de£nite (and is based on the Debye scat-tering formula8) . In equation 5, there areR
ions within the simulation cell which has a volumeN
,
+
5XW is the scattering
factor of ionX which has the atomic real–space co–ordinate
d%eBfhgi!jkml nogi jkl
i!jkqpsr tuv wyxz wyxw w {yx| {yx} {yxz {yxw { { ~yx ~ ~yx {
Figure 1: (Color online) Comparision of the Lennard-Jones and Dzugutov pair-potentials.
[image:4.595.327.552.52.186.2]16 5.82 1.1 1.87 1.28 0.27 1.94
Table I: Table of parameters used in the Dzugutov potential (equation 6).
ofb
"
, and\]Y5 is a Bessel function. The function;<>=? of
a population member( of each groupE is tested against the
function;
+
>=? of the £ttest member in the groupE
contain-ing the same number of atoms as member(. Equation 4 is
then used to compare these two functions and returns a single number between zero and one. In a variable–supercell calcu-lation it is possible for this function to become greater than one when the structures are highly dissimilar, in which case we set the value of:
;<>=? to one.
III. RESULTS
The results presented here will use two different empirical potentials, the Lennard–Jones potential9,10 and the Dzugutov potential7which is de£ned as
: * V : * 0 P : * (6) where
V
:D * , c # : * : * (7) P q o¡ : *¢ : *£¢ (8)
with the constants de£ned in table I. A comparison of these two potentials is shown in £gure 1. The Dzugutov potential was originally formulated to simulate liquid systems, however it has also been shown to have some interesting solid phases11, and can also be used to form quasi–crystals7.
The Dzugutov potential is designed such that the force on, and energy of, an atom moving within the potential go to zero at¢%¤¥
[image:4.595.321.563.497.605.2]3
¦§ ¨ª© «ª© ¬@s®H¯y°
±³²´c®H°µmµ@¶M°5²¯y·9´ ¸¹ º »¼ ½¾¿ ÀÁ ºÂà ÄÅÆÇ ÈÉ Ê Ë
ÌsÍÌsÌ ÌyÍ«sÎ ÌsÍÎyÌ ÌsÍÏyÎ ÐÑ ÍÎsÎ ÐÑ Í Ñ Î ÐÑ ÍÏsÎ ÐÑ ÍÒsÎ ÐÑ ÍÓsÎ
Figure 2: (Color online) Summary of the enthalpies of the different Lennard-Jones structures found for different £tness weights, which controls how much the comparison factor is considered during selec-tion for update and crossover. The values forÔÕ×ÖØÖ are those from
Abraham and Probert1. All points are averaged over 15 independent calculations. Ù Ú Û³Ü Ý³Ü Þßsà9ásâ
ã³äåqàHâ5æmæ@ç1â5äáyè9å éêëì íî ì ïêðñ ê ì òê
óyôósó ósôÝsõ ósôõsó ósôösõ Ýsósó
Ûsõsó
Ûsósó
õsó
ó
Figure 3: (Color online) Summary of the convergence times for the results shown in £gure 2. The values forÔ÷ÕÖØÖ are those from
Abraham and Probert1. All points are averaged over 15 independent calculations.
A. Results from the Lennard-Jones potential
The use of the comparison factor in the selection procedure has a marked effect on the quality of the results produced as seen in £gure 2. While the global minimum structure is hexag-onal close packed (HCP) this structure is nearly degenerate with the face-centred cubic structure (FCC) (with an energy difference of less thanùø
ûú
12). There are also a number of
other stacking–fault structures which exist in-between FCC and HCP. The use of the comparison factor encourages the system to explore and hence escape from these local minima and £nd the HCP structure. With a £tness weight ofF
øü³ý
£nding a HCP structure is much more likely.
The effect on convergence is interesting as seen in £gure 3. There is little increase in the mean number of generations required for convergence, although there is a greater spread in the values.
Figure 4 shows the results from a calculation performed withF
ùøüªý
. We have included these results in particu-lar because it shows the system going from an FCC structure to a HCP structure through two intermediate stacking–fault
þ,ÿ "!$#&%&#&%$#&% ' !&#&%$#($#&% ) !$#&%$($#($% * !$#+(,%&#($%
-. /10243 56 7 89 :;< => 7? @ ABC D EF G H IJ KL KI KNM KO KJ ML P IRQLLJ P IRQLLTS P IRQLLO P IRQLLU P IRQLLM P IRQLLK P IRQLLI þ,ÿ
-. /10243 56 7 89 :;< => 7? @ ABC D EF G H IJ KL KI KNM KO KJ ML P IRQLLJ P IRQLLTS P IRQLLO P IRQLLU P IRQLLM P IRQLLK P IRQLLI VXW"Y VXY"Y Z"Y ["Y \Y W"Y Y ] [_^Y"Y ] [_^W"Y ] [_^\ Y ] [_^["Y ] [_^Z"Y ]` ^Y"Y VXW"Y VXY"Y Z"Y ["Y \Y W"Y Y ] [_^Y"Y ] [_^W"Y ] [_^\ Y ] [_^["Y ] [_^Z"Y ]` ^Y"Y
Figure 4: (Color online) Plot showing convergence to HCP mini-mum structure for a Lennard-Jones calculation withÔÕGÖØXa&b . The
stacking patterns of the minimum enthalpy solutions are shown next to their appearance during the course of the simulation. The system converged to a HCP structure in 55 generations, and by thec$d$a
th
generation all members were the same.
Fitness Weight
Pure HCP Intermediate HCP–FCC
Pure FCC
ÖØÖ@Ö Ö e Ö
ÖØXd&b f f Ö
ÖØXbÖ f e Ö
[image:5.595.66.289.51.182.2]ÖØXa&b e f Ö
Table II: Table comparing the number of each ordered structure type of the lowest enthalpy structure found (i.e. ignoring higher–enthalpy structures found during the course of a GA minimization) for differ-ent values of the £tness weighting factorÔ . Numbers given are out
of a total of 15 calculations.
structures.
These results are summarized in table II. The results from
F
ùø
are those presented in Abraham and Probert1.
B. Results from the Dzugutov potential
For results obtained using this potential an additional mod-i£cation was made to the GA in the crossover step. Previously the atom–number could either be kept £xed or be allowed to vary in an unconstrained manner. For these Dzugutov calcu-lations a third option was added, which is to allow the atom number to vary within an allowed percentage of the original number of atoms within the simulation supercell.
[image:5.595.316.560.52.233.2] [image:5.595.65.290.273.401.2]4
Figure 5: The unit cell of the Dzugutov potentialg –phase looking
down thehÖ3Öjic2k direction.
Number of Each Phase Found
Lowest Higher Lower
Pressure Enthalpy Enthalpy Enthalpy (MPa) Phasel Phase BCC g FCC Phasem
0 BCC 13 8 1 0 0
50 BCC 2 16 1 0 3
100 g 1 9 11 0 1
150 FCC 1 0 0 15 6
l Data taken from Roth and Denton 11.
m Where the term “Lower Enthalpy” refers to having lower enthalpy
[image:6.595.66.289.52.270.2]than the phase in column 2.
Table III: Summary of results for 62–atom variable–cell, constrained variable–atom–number calculations. 22 independent GA calcula-tions were performed at each pressure.
cell to grow to accommodate them. In this way the calculation would increase in size and take a longer and longer time for each minimization step. This percentage cut–off keeps the ad-vantages of a variable atom–number calculation without these problems.
It is already known that the Dzugutov¥ –phase has a
com-plicated 30–atom unit cell (see £gure 5) and so all calculations had to have at least this many atoms. To prevent any bias of the £nal results, we started each run with 62 atoms in the unit cell and allowed the number of atoms to vary, in order to have an unbiased search of a large enough phase space.
A summary of the Dzugatov results is given in table III. Calculations were performed at four pressures, 0 MPa, 50 MPa, 100 MPa and 150 MPa which allows each of the three structures suggested by Roth and Denton11to be the most sta-ble at at least one point during the experiment.
As can be seen in table III a number of GA minimizations
n_o$oqpRrtsvuNwyxz{
|
pRrtsvuNwyxz{ }$o$oqpRrtsvuNwyxz{ ~wytpRrtsvuNwyxz{ yw" pRrtsvuNwyxz{ ~rNNpRrtsvuNwyxz{
rw"svyr.+
¡
¢
£
¤y¥
¦
¥
§
¥
¨"¥
©
¥
ª
¥
«
¥
¥
¨y¬¥ ª¬¥ ¥y¬¥
ª¬¥
¨y¬¥
¦¬¥
® ¬¥
Ǵy´
Figure 6: (Color online) Convergence plot of a variable–atom, variable–cell calculation, starting from 62 atoms. This gives rise to a previously unknown phase (labeled as phase “
” in £gure 8). The inset shows the complete calculation. The minimum–enthalpy struc-ture found has 65–atoms and is shown in £gure 7.
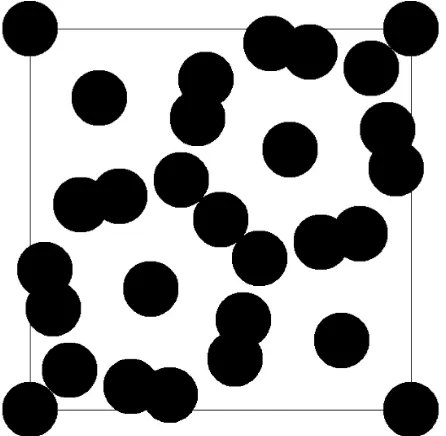
Figure 7: The structure of the new phase “¯ ”, a 65–atom phase found
in generation 64 of the calculation shown in £gure 6.
found structures with a lower enthalpy than the previously reported minimum enthalpy structure. In total three distinct new structures were found. A plot showing the progress of a GA minimization down to the new lowest–enthalpy structure found is shown in £gure 6 with the structure itself shown in £gure 7.
A plot comparing the radial distribution functions of all the known and unknown phases of the Dzugutov potential is shown in £gure 8, as well as the HCP phase. The three new phases found are all signi£cantly different from the es-tablished phases of this potential. Examination of these phases suggests that the simulation cells correspond to primitive cells and not supercells, but attempts to further characterize these structures by space group have so far been unsuccessful. The atomic co–ordinates of these structures are available online13 as supplementary material.
[image:6.595.326.551.255.467.2] [image:6.595.59.307.321.462.2]5
°²±t³µ´R¶
³µ·¸
¹º¼»
¹
½º»
½
¾º»
¸¿ÀÁ1Â&ÃRÄŶ
ÀÆÁÇÂÃRÄÉȶ
ÀÆÁÇÂÃRÄÉʶ
ÀÆÁÇÂÃRÄÉËŶ
ÌÎÍÏÀƶ
ÐÑÍͶ
ÒÏÍÏͶ
Figure 8: (Color online) Comparison of the radial distribution func-tion, ÓÑÔÕ×Ö, for the distinct lower–enthalpy structures found with
BCC, FCC, HCP and theg –phase. The Dzugutov Potential is also
shown.
of the Dzugutov potential found in the course of this study is shown in £gure 9. Phase “ ” is the most stable phase at all
positive pressures.
IV. CONCLUSIONS
In this paper we have developed a novel £tness function that combines a traditional approach to £tness based upon
en-thalpy, with a simple structural comparison factor to £nd new, more stable crystal structures within a GA for crystal struc-ture prediction. This method penalises the presence of similar structures within the population which prevents the GA stag-nating in some local minimum. The GA method itself was also extended to allow both the simulation supercell and the
ØTÙtÚ"ÛvÜÝÞNß ØTÙtÚ"ÛvÜÝà¼ß ØTÙtÚ"ÛvÜÝá¼ß âRã$ãä åã$ã
æèçéêtëÜì"í,îXç"ëðïñí+òvó ôõö÷ø
ù
úûüý
þ
ÿ
ö
Figure 9: (Color online) Energy–Volume curve for the Dzugutov po-tential showing the three new phases calculated at zero pressure. The curves for theg –phase and structures “
”, “
” and “
” were calcu-lated assuming an isotropic expansion.
number of atoms within that supercell to vary. The number of atoms must only be varied within £xed limits to prevent the system size becoming too large or too small.
Studies using the Lennard–Jones potential showed the cal-culation progressing through the FCC local minimum and two other stacking–fault local minima before £nding the HCP global minimum enthalpy structure. This was shown to be repeatable and ef£cient.
When this new GA was used to study phases of the Dzugutov potential at different pressures all the previously re-ported zero–temperature phases were found, along with three new phases, one of which is the most stable phase at all pos-itive pressures. These new structures are markedly different from the three previously–known phases. This clearly illus-trates the power of this GA to £nd new crystal structures that were hitherto unexpected.
V. ACKNOWLEDGMENTS
Calculations were performed on our departmental Beowulf cluster, EPSRC grant R47769 from the Multi-Project Re-search Equipment Initiative. NLA is grateful to the EPSRC for £nancial support. The authors acknowledge useful discus-sions with Peter Main.
1
N. L. Abraham and M. I. J. Probert, Physical Review B (Con-densed Matter and Materials Physics) 73, 224104 (2006).
2
[image:7.595.68.288.47.471.2] [image:7.595.324.553.124.252.2]6
3
C. W. Glass, A. R. Oganov, and N. Hansen, Computer Phys. Comm. 175, 713 (2006).
4 R. M. Briggs and C. V. Ciobanu, Physical Review B (Condensed
Matter and Materials Physics) 75, 195415 (pages 7) (2007).
5
G. L. W. Hart, V. Blum, M. J. Walorski, and A. Zunger, Nature Materials 4, 391 (2005).
6 V. Blum, G. L. W. Hart, M. J. Walorski, and A. Zunger, Phys. Rev.
B 72, 165113 (2005).
7
M. Dzugutov, Phys. Rev. Lett. 70, 2924 (1993).
8 P. Debye, Annalen Der Physik 46, 809 (1915).
9
S. D. Stoddard and J. Ford, Phys. Rev. A 8, 1504 (1973).
10
J. E. Lennard-Jones and A. E. Ingham, Proc. Royal Soc. A107, 636 (1925).
11
J. Roth and A. R. Denton, Phys. Rev. E 61, 6845 (2000).
12
G. Kane and M. Goeppert-Mayer, J. Chem. Phys 8, 642 (1940).
13 N. L. A. Abraham and M. I. J. Probert, New Dzugatov
struc-tures (December 2007), URLhttp://www.cmt.york.ac.