COMMISSION
OF
THE
EUROPEAN COMMUNITIESThe
Energy Situation
in
the
Community
Situation
I97
3
THE ENERGY SITUATION IN THE COMMUNITY
Situation 1973 • Forecasts 1974
C
0
N T E: N T SIntroduction
I. The trend of economic activity
II. The trend of demand
1.
Situation in1973
2. Outlook for
1974
III. The market situation in
1973
and its consequencesA. Petroleum
B. Coal
c.
GasD. Electricity
E. Nuclear Fuels
-0-1
2
4
4
5 6
6
20
25
30
The Outlook for
1974
The outlook for
1974
is clouded by uncertainties, amongst whichthe biggest doubts relate to the prolongation of the oil supply cuts,
the severity of the reductions themselves and their impact upon the
general level of economic activity Moreover, the full significance
of the recent gargantuan crude oil prices rises on the economies of the
consumer countries has yet to be assessed
In brief, the oil crisis could have serious effects on the economic,
social and monetary life of the Community In view of the considerable
interdependence of the Member States, a serious shortfall in oil supplies,
for whatever reason, which resulted in grave economic difficulties in any
one or more of the member couniries, ,coul~ lead quite rapidly to an
extension of the effects throughout the Community It may be noted
that more than 50% in value of the foreign trade of the Member States is
intracommunity In 1972 intracommunity trade represented about 10% of
the gross product of the enlarged Community For individual Member
States income from abroad represented between 6 and
3o%
of Gross NationalProduct
In view of the uncertainties relating to
1974,
this report dealsprincipally with events and developments in 1973 which appear to have
importance for the years ahead .• However, in some cases, estimates of
anticipated growth before the oil supply crisis are quoted to give an
indication of expected developments under "normal circumstances" ...
Nevertheless, any such indications provided for
1974
must obviously betreated ~dth great reserve in the present vortex of energy shortages
-2-THE ENERGY SITUATION IN -2-THE COMMUNITY
Situation
1973 -
Outlook1974
I, The trend of economic activity
During most of
1973
economic activity developed at a very highrate within the Community. There was a marked degree of utilisation of
available capacity and delays in the d.eli very of goods and equipment were
often experienced .. For the year as a \~~Thole, the gross national product
of the Enlarged Community is estimated to have increas~d by
5.8
per centover
1972
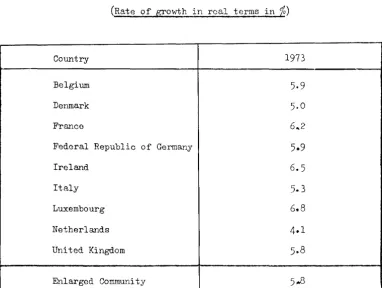
TABLE I
Evolution of Gross National Product
(Rate of growth in real terms in
%)
Country
1973
Belgium
5·9
Denmark
5.0
France
6"'2
Federal Republic of Germany
5.9
Ireland
6.5
Italy
5.3
Luxembourg 6.8
Netherlands
4·1
United Kingdom
5·8
Enlarged Community
5.-8
[image:5.483.54.436.311.598.2]countries shov-Jed a notable increase. The tendency of exports to the
United States to be stabilised was more than offset by the marked growth
of sales to other European countries and to the developing countries ..
Moreover, ir.tra-Community trade, which was stimulated by the reduction of
20%,
from lst April,1973,
of customs tariffs betv.reen the six originalmembers of the Community and the three new member countries, continued to
provide a very pronounced stimulus to economic activity.
The acceleration in the rise in prices observed in the member
countries in the second half of
1972
was intensified in most of them during1973.
Inflation has reached a disturbing rhythm in the \ihole of theCommunity, in spite of the efforts undertaken at both Community and
national levels to deal with the problem, In the course of the last
t-vmlve months, the annual rate of inflation has reached betv-~een 6 to
11%
among the member countries, as compared \vi th 5. 5 to 8% a year ago.
~ernal factors as much as internal ones have contributed to this
alarming evolution.
After a year of exceptional gro\~h in
1973,
economic activity hadbeen expected to remain buoyant in
1974,
although some slowing down of therate of growth was envisaged for most of the industrialised countries.
However, in view of the current oil supply situation and the extreme
uncertainties relat~ to the probable course of events in the forthcoming
year, it is particularly difficult to estimate the pace of economic
development in
1974.
Clearly the tempo of economic activity in theyear ahead will be significantly influenced by the duration and severity
-4-II. The trend of demand
1) Situation in
1973
In
1973
the demand for energy is estimated to have increased byabout
7%.
Energy demand continued to rise under the stimulus ofeconomic gro~rth and despite rising prices of energy. Hov1ever, the
poli~ical crisis in the Middle East in October, resulting in cut-backs in
oil production by the Arab producing states, the embargo on oil exports to
the Netherlands and the u.s.A., and the unilateral increases in the posted
prices of crude oils, were developments that soon made themselves felt in
the consumer countries including the Community, and resulted in measures
to curtail the consumption of oil products. It is too early to assess the
impact of these developments on the total consumption of energy and on the
relative shares of the different sources of energy within the Community in
the year ahead.
Latest available estimates indicate that total requirements of energy
in
1973
reached1035
million toEf(1475
million tee). Oil was again thelargest component of Community energy supplies, providing
645
million toe(920
million toe) in1973,
or approximately62%
of total consumption. Thebalance of energy requirements was made up by the various other sources in
a similar pattern to that of the previous year.
Again approximately two-thirds of total requirements were met by
imported energy, oil representing
95%
of these imp~rts ( about635
milliontoe). The high rate of growth in energy demand in
1973
served to focusattention, quite apart from the effects of the oil supply crisis, on the
imperative need of the Community to secure its energy supplies for the
fUture to meet its growing requirements pari passu with the rising needs
of other consumer countries such as the United States and Japan.
Moreover, the large rise in the cost of oil imports, with the likelihood
of further price increases to come, indicate that tho Community will have
to be prepared to meet considerably higher costs for its imported energy
requiremen+-s in the years ahead.
2) Outlook for
1974
In view of the great uncertainties relating to the level of oil
imports in
1974,
earlier estimates for the Community's energyrequire-ments in the year ahead must be regarded as tentative and liable to
change depending on how circumstances develop. Nevertheless, on the
assumption of some slowing down in economic grovnh in
1974
to about4i%
in Gross National Product in real terms as compared with 6% in
1973,
energy demand might be expected also to expand at a somewhat similar rate.
It must be emphasised that this is a highly tenuous estimate, the actual
rate of growth in demand obviously being governed by the development of
the oil supply situation and the high level of oil prices and their
-6-III. The market situation in 1973 and its consequences
A. Petroleum
1. Oil market bgfore the Arab/Israeli conflic1
The year 1973 was dominated by an exceptionally favourable
inter-national market situation for sellers; this situation developed
progressively in the course of the year to roach its culminating point in
the Arab/Israeli conflict in October,l973.
In the course of the first eight months of 1973, conditions in the
petroleum market were modified under the influence of the following
factors:
(i) a tightening in the supply conditions which Here already
in existence in December, 1972;
(ii) an increase in demand greater than was foreseen for certain
oil products;
(iii) by fluctuations in exchange rates and by the general
inflation in industrialised countries.
The following f8atures may be distinguished:
1) Elements of a character which are more or less permanent nnd which
have led to a levelling, reduction and orientation towards new
markets, of the production of certain producing countries:
(i) a volm1t~ry limitation of production by Kuwait and a
reduction in Libya in order to conserve resources,
whether for economic, technical or political reasons
( ii) an absence from the :&..U.ropean market of 3. part of the
crude~ used by the producer co~~tries for bilateral deals
with the countries of Eastern Europe, Japan, India and
Brazil.
2) Various factors of a technical character which have resulted in
delays in the development of the theoretical capacity of
production installations, of coastal transport and of crude o51
loading facilities in certain producer countries:
(i) a relative insufficiency, in 1972 and at the beginning
of 1973, of investment for the development of production,
arising from delayed investment decisions by the oil
companies owing to, on the one hand, the uncertainty
which existed in 1970 and 1971 as to the evolution of
production conditions resulting from the enforcement of
the "participation" agreements and, on the other hand,
the disproportionate production effort required in Saudi
Arabia and Iran to compensate for the loss of production
capacity which took place elsewhere. It is thus that,
relative to the first half of 1972, the production of
crude oil in the course of the first six months of 1973
increased by more than 32% in Saudi Arabia and 20% in
Iran to compensate not only for the reductions of 7.4%
in Kuwait, 0.4% in Libya, and 2.1% in the United States,
but also for the insufficient growth of production in
certain other countries,in particular Nigeria.
(ii) the delays of some months in the realisation of
-8-of exploitation equipment.
Demand
--~---1) In the course of the first half of 1973, vror1d requirements in
total increased more rapidly than uas fo:--:-eseon, in particular in
Japan and tho United States. Faced w~.th the serious shortfo.ll
in internal resources and an insuffici0~ny of refinery co.po.city,
the Government of the United States c,u·chorised a significant
increase in imports of crude oil and of refinod products, at a time
when the supply situation in tho 1·:orld market was relatively woak.
2) As a result of the constraints iri.'_)oscd by regula·cions designed to
protect the environment, this cup)lo:'c~-:tary dnma:n.d uo..s focalised
almost exclusi vcly on a small par-t of tho r:1".rl:et, na~ely: the lovJ
sulphur crude oil from Africa ( Algeria, LibJra and Nigeria) and
on the light products and middle distillates. In the European
market, a certain tightness had meanwhilo boon apparcnt in tho
motor gasoline and gas oil markets.
General Market Situation
In brief, a number of unfavourable circ~~stances developed and
resulted in delays in rcspect of certain deliveries, and created
tightness in the market for certain qualities of crude oil and refincd
products.
1) If the balance bctwecn global demand and supply for tho first half
of the year seemed to indicate a theoretical surplus of supply
estimated at only 1. 5%, as compared vli th 15 to 20% in tho past,
disequilibria in respect of the production of low sulphur crude oils and
light refined products, with the grotrlh of demand being concentrated in
this particular part of the market:
(i) the rate of growth in the production of free world cruda oil
increased by about
9.5%
in the course of the first half year,clearly surpassing the rate of development recorded in recent
years and confirming the strength of demand which, without
doubt, was stimulated by the build up of petroleum stocks,
notably in Japan. Production in the United States declined
slightly. Western Hemisphere production accounted for rather
more than 30% of the world total, vvhilst the Near East alone
produced more crude oil than the l"lhole of the ~-/estern Hemisphere
with a rate of growth above 20% in relation to 1972.
(ii) at the same time, total free world denand increased by
8%
over1972. The rate of growth in demand was approximately 15% in
Japan and
4·5%
in theu.s.A. -
where the consumption of gas oiland of motor gasoline was, ho\"lever, held back ot-ring to the
insufficiency of refinery capacity and the weakness in the
availability of world supplies in relation to needs. For the
Enlarged Community of Nine, total demand increased by about
6%;
-i>h.o -'n'Owth in demand for gas oil was more than 12% over 1972.
2) To these quanti ta'ti-.reo:- elements were added the impact of fluctuations
in the dollar exchange rate and the influence of the phenonomen of
world inflation which, coincidhlg with the weakness in the supply/
demand relationship, led to some very significant rises in the prices
-
10-(i) a large increase in petroleum product prices took place
in the "spot markets". At Rotterdam particularly, the
price of motor gasoline sold by cargo lots was
progressively increased as from the fourth quarter of
1972 to reach ~102 MT in July, 1973, representing an
increase of 150% as compared with the same period a year
ago. The price of gas oil increased by almost 200%, and
the difference between the prices of low sulphur and high
sulphur heavy fuels rose from less than ~2 in January,
1972, to more than
¢8
in July,1973.(ii) as from August 1973, a certain slackening took place in
the spot market of Rotterdam, particularly with regard to
motor gasolines and to a lesser extent for fuel oils,
whilst gas oil, for which demand remai~ed strong, continued
TABLE II
Quotations of prices for petroleum products on the spot
market in Northern Europe in ¢h~T
Jan.12 Jul~
12
Jan. I~ Jul~13
Se]2t·13Motor gasoline
super 32,19 40,87 50,90 102,47 83,88
Motor gasoline
regular 23,25 31,13 42,55 93,06 75,40
Gas Oil 26,98 24,13 37,63 72,43 71,39
Fuel Oils
- max. 1%
s.
14,14 17,58 22,76 26,82 22,87- bunker
(iii)
c
12,67 14,12 15,94 18,42 16,73Various price increases were also recorded in the world
market for crude oil. These have exceeded the rise in
royalties paid to the producer countries in line with the
agreements concluded at Teheran, Tripoli and Geneva. The
prices of crude oil have reflected not only the increases
in line with the terms of these agreements, but they have
also incorporated the cost of "participation11 and an
increase in the margins of the oil companies:
-for Saudi Arabia the sale price rose from ¢13.78/per ton
f.o.b. Ras Tanura in January,l972, to ¢16.85/per ton in
-
12-for Libya, prices have very largely covered the effects
of the devaluation in the dollar; quotations were recorded
of more than ~26/per ton f.o.b. Es Sider in April, 1973
against ~20.33/per ton in December,l972.
(iv) Although the price rises recorded on the spot market for motor
gasolines and the increases in the cost of crude oil were only
weakly reflected in internal market prices for liquid fuels,
prices to consumers of gas oil for central heating and for fuel
oils increased in the course of the first eight months of 1973,
following a reduction in the rebates traditionally provided by
the oil companies.
3) The market situation in the course of the first eight months of
the year confirmed the change from a buyers' market to a sellers'
market. If the
u.s.
consumer has, as a result of the protectionof the domestic market, paid more in the past for his oil than in
the world market, he has contributed towards the rise in supply
prices in recent months through direct competition. Although
the very considerable rise in prices of petroleUQ products in
the spot markets was reflected only weakly in prices to the
consumer, the independent European distributors have found
difficulties to ensure their supplies at high price levels in
a situation in which the great international companies have
reduced their customary rebates to consumers of gas oils and
fuel -oils.
There is no rloubt that the tightness of supply which was
devaluations of the dollar and to inflation, provided the Arab producers
of oil with the opportunity to change the conditions of the world
petroleum market at the time of the Middle R~st conflict.
2. Situation in the petroleum market since the Arab/Israeli conflict
Since the Arab/Israeli conflict the international petroleum market
has been in a chaotic state. The contractual arrangements
resulting from the Teheran and Tripoli Agreement have been
shattered. The international oil companies are no longer
assured of their supplies nor of the prices which they are
obliged to p~. The structure of crude oil prices, which was
dependent on the quality of the product and its geographical
location, has been profoundly changed; the different producing
countries tend to impose their ovm regulations which give rise
to abnormal price disparities. The situation appears even
more difficult for the independent companies without their own
resources or no longer having direct access to oilfields, and
who are now obliged to purchase their crude oil at the highest
price levels.
The decisions taken by the Arab producing countries at the
time of the Arab/Israeli conflict have had profound repercussions,
which at first had an impact on the price of crude oils and
subsequently on the quantities available.
3. Effects on crude oil prices
Further to the decisions taken in Resolution 90 of the OPEC
countries, meeting in Vienna on the 12th October,l973, the
producing countries of the Persian Gulf met again at Kuw~it on
-
14-fix new conditions governing the p~i~e of crude oil:
( i) The new posted prices i·Jhich will serve as a basis for
the calculation of royalties, n~e fixed in the ratio of
1.4 times the market prices Hhich are themselves fixed
on the basis of ¢3.65 per barrel for Snudi Arabian light
crude oil.
(ii) On the assumption that the oil compa~ies might refuse to
produce crude oil under these new conditions, the producing
countries would dispose of the oil on the open m3rket at
a price of ¢3.65 per barrel f.o.b. Ras Tnnurn.
(iii) The f.o.b. costs of crude oil extracted by the major
international companies, on this basis, increased by
¢1.273 per barrel or more than ¢9.5 per metric ton, which
corresponds to a rise of about 70% in relation to the level
of costs before 16th October,l973.
TABLE I I I
Posted Prices and F.O.B. costs for tge major international production companies
a) Posted Prices and F.O.B. costs for the major companies ~~E"!:'.~r:~~.!
Posted Prices_{!l Costs for major companies $/barrel - M b a r r e l
c2r--16 Oct. lst Oct. Inc. 16 Oct. 1st Oct. Inc. ~---. ._.__...~~ Arabian light 340 5,119 3,011 2,099 3,149 1,876 1,273
Iranian light 34° 5,091 2,995 2,096 3,140 1,869 1,271 Kuwait 31° 4,903 2,884 2,019 2,999 1,775 1,224 Iraq Ea. '3rah 35° 5,061 2,977 2,034 3,122 1,859 1,263 Libya 8,925 4,605 4, 320
"
II II(1) "Posted prices" serve as a basis of calculation for production
[image:17.484.50.430.388.604.2]to the market price fixed for light Arabian Crude oil at ¢3.65
per barrel.
(2) "Tax Paid Cost" is equivalent to technical costs plus taxes and
royalties paid to the producing countries. These costs do not
include the costs of "participation" which were approximately
~.15 per barrel at 16th October,l973
TABLE IV
b) F.O.B. Costs Persian Gulf in %/MT for the major international production companies (1)
16 October 1st October Increase
~
~
~{!Ti!
Arabian light
34.
23,58 14,05 + 9,53 + 67,8Iranian light 34° 23,57 14,03 + 9,54 +
68,-Kuwait 31° 22,11 13,08 + 9,03 +
69,-Iraq Basrah 35° 23,38 13,30 + 10,08 + 75,7
( 1) "Tax Paid Costs"
2) The independent companies should, in principle since 16th Otober,
1973, buy their crude oil at the market price, which in the case of
Arabian light was fixed at ¢3.65 per barrel or ¢27.33 per metric ton
(i) Whilst before the 16th October marginal quantities of crude oil
delivered to the spot market were quoted at between ¢3.25 and
¢3.80 per barrel f.o.b. Persian Gulf, the major part of the
[image:18.482.55.437.219.452.2]-
16-to the inde~ndents were- concluded at al:>out ¢2.80 _per barrel or
¢20.97 per ton.
With regard to this selling price of ¢2.80 per barrel, the
independent companies since 16th October,l973, have had to
meet a minimal increase in the price of their crude oil of
¢0.85
per barrel (¢3.65 - ¢2.80) or¢6.36
per metric ton.(ii)Since- the 16th October, 1~73, .sales of crude oil by the large
companies to the spot market have ceased, not only because of
the reduction in the availability of crude oil, but equally
because of the production companies' expectation to reflect the
increased costs of crude oil in their selling prices to the
independents. With posted prices, which serve as a basis of
calculation for royalties, depending upon a fixed market price
since the 16th October,l973, it is clear that any level surpassing
the reference price (¢3.65 per barrel) would be followed by new
decisions to increase this base price which in turn wuuld give
rise to general increases in the price of crude oil.
(iii)On the other hand, sales of "participation"crude oil seem to have
been realised in certain markets in relatively small quantities
but at higher prices.
(iv) On the 22nd and 23rd December,l973, the Middle East producing
countries, meeting in Teheran, decided to raise posted prices to
¢11.651 per barrel as from the 1st January,l974,for Saudi Arabian
light crude oil. The market price related to this posted price
is equivalent to ¢8.32 per barrel. The f.o.b. costs of crude
oil of the large international oil companies which had increased
by ¢9.53 per metric ton on 16th October,l973, was thus due to
total increase in the f. o. b. cost at th~ lst J:-1.:>-mary v-.·~-s thus
equivalent to $39.62 per metric ten as compared with t~e oituation
at the beginning of October,l973.
Tli.BLB V
Posted prices and f.o.b. costs for the lt..rRe international
oor:panies
Saudi Arabian Light Crude Oil 34° API
Posted Prices Oosts for the lo,rca 1nternational in $/bbl(l)
Z'/bbl
com~anies (2) jliMT
1st October 1973 3.011 1.()76 14.0~
+
9·~
16th October 1973 5.119 3.149 23.58 + 39.62 + 3.09
1st January 1974 11 .. 651 7.165 53·~
(1) Posted prices: See Table III for definition
(2) Tax paid costs: See Table III for definition
Further increases in the posted prices of crude oil to truce effect
from lst January,l974, were introduced by Libya, Nigeria and Venezuela.
Libya set its new posted price at ~15.76 per barrel as compared with
$8.925 per barrel at 16th October,l973. Nigeria raised its posted price
from $8.3 to ¢14.69 per barrel and Venezuela increased its posted price
from ¢7.74 to ¢14.08 per barrel. Other nations also increased their
posted prices for crude oil at the same time. The outlook for the
consumer countries at the beginning of 1974, as a result of these huge
increases in the price of crude oil, appeared to pose very serious economic
problems.
4· Effects on the quantities of crude oil
The Arab oil producing countries - Kuwait, Iraq, Syria, Egypt, Libya,
Algeria, Saudi Arabia, Abu Dhabi, Qatar and Bahreim - decided t0
-
18-to the United States and the Netherlands. Great uncertainties exist
as to the precise significance of the shortfall in supply in relation
to requirements, but already these measures have had important
repercussions on the availability of petroleum products in the
world and in particular in Japan and the Community.
5.
Consequences and Perspectives1) A certain number of consuming countries have already incorporated the price increases at the production level into their market
prices. In Germany and Belgium in particular, market prices have
tended to reflect the ne\-.r price levels; France and the Netherlands,
which apply particular formulae in respect of the allocation of costs,
have opted for higher supplementary charges for motor gasolines and
distillates. Residual fUel oil, which seems to be available in
most markets, has remained at a very advantageous price in relation
to other products.
2) At the present time, with the world supply and demand situation for
crude oil reflecting the degree of dependence on the industrialised
countries on external sources for their supply of energy, the
producing countries have arbitrarily raised crude oil prices to
exceedingly high levels. The future level of crude oil prices is
of critical importance to the economic well-being of the consumer
countries. As to future availability, the production strategy
which the producing countries intend to follow,whether they choose
to conserve their oil resources for whatever reasons, will also have
significant implications for tho industriE!.lised v1orld.
6. Naphtha
In the course of
1973,
naphtha has been in short supply; spot pricesin vie\'17 of the continuing increo.ses in crude oil prices, may be
expected to rise in the future. The shortage of n~phtha has
created particular problems for the chemical industry. Naphtha
requirements for the production of ethylene within the Community
were estimated to rise to about
39.65
million tons in1974
and43.10
million tons in1975.
However, if the shortfall in crudeoil supplies to the industrialised countries persists, it is
difficult to enyisage an easing in the naphtha supply situation in
-
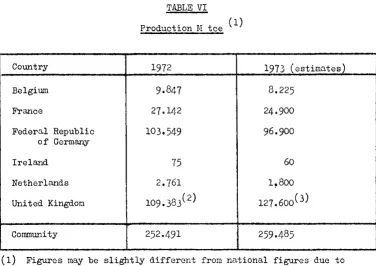
20-1. Production and situation in the collieries
In 1973 the production of coal within the·Community i& estimated to
have reached approximately 260 million tee. (Estimate made prior
to the industrial trouble and resulting decline of production in the
coal industry in November/December in the U.K.) This figure
represents a marginal increase on the previous year's production,
which however reflected the production losses due to the strike in
the United Kingdom in 1972. It is quite conceivable that coal
production in 1974 may show some increase in the new energy situation
arising out of the oil supply crisis~ depending upon its severity and
duration; however, the effect on production of the industrial trouble
in. the U.K. is difficult to assess at the current time.
Country
Belgium
France
Federal Republic of Germany
Ireland
Netherlands
United Kingdoo
Community
TABLE VI
Production M tee (l)
1972 9.847 27.142 103.549 75 2.761 109.383( 2) 252.491
1973 (estimates)
8.225
24.900
96.900
60
1!'800
127 .. 600( 3)
259.485
(1) Figures may be slightly different from national figures due to
[image:23.479.53.429.337.603.2](2)
Loss of production due to strike estimated at21 M
tee.(3) Estimate made prior ~o industrial trouble in November/December.
At the end of October
1973,
stocks at the mines in Germany amountedto
10
million tons of coal and8
million tons of coke-oven-coke, and inthe U.K. were
13.5
million tons of coal. In the other producingcountries coal stocks at the pithead do not exceed the technical level
necessary for efficient use.
Average output per miner (working below ground) rose by
4%
in1973,
a larger increase than in
1972.
This growth of productivity reflectedessentially developments within the U.K. In
1972,
as a result of thestrike, there was only a very weak improvement in productivity of the
order of
0.2%
in the U.K.'riil>LE VI I
Average output per miner and per shift and production cost
In kg.per
1973/72 1972/71
shift
1973
West German Republic
4-400
+ 3,6%
+ 5,2%
Belgium
2.540
-3,7%
+ o,6%
France
2.780
+2,6%
+ 3,2%
Netherlands
3.480
+6,2%
-·.2, 2%
Great Britain
3.600
+4,0%
+ 0,2%
r.J,1otal
3.720
+3,9%
+ 2,6%
(1) Not av~lable.
Production
1973/72
+ 6,5%
+17
,at#>
+13,5%
+14,0%
N,A.(l)
..
-
22-With regard to developments in the wages sector in the Member States
in
1973,
information is still not complete. However, from what is knownabout wage agreements it appears that w~gcs increased significantly more
than productivity. The rise in the cost of production accelerated as
compar-ed with previous years. Revenues in the coal industry did not
increase in any Member Country of the Community as rapidly as did the
costs of production. In the U.Ko and Germany there were price increases
following the summer of
1973
of the order of7.5%
and5%
respectively.Viewing the year
1973
as a whole, there was a deterioration in thefinancial situation of the coal industry within tho Community as compared
with
1972.
This was reflected by the increase in aid for the coalindustry. In
1973
average aid to the industry in the original Communityof Six increased from
4,81
ua per ton(1972)
to5,75
ua per ton. Thefact that the British coal industry was joined in
1973
to the industry inthe Community of Six, and that it received aid of only 2 ua per ton,
accounts for the siutation that average aid per ton in the enlarged
Community was only
3,90
ua per ton. This figure is below the averageaid of the Community of Six in
1972.
2. Imports
Imports of coal into the Community from third countries were
maintained at a level of about
32
million tons in1972/73,
equivalentto
12%
of internal requirements. The level of imports for1974
had beenestimated at
35
million tons but in the light of the present energycrisis could reach a higher figure. Additional requirements from
external sources may arise from coking-coal needed for the manufacture
of metallurgical coke, and for steam coal used in the industrial sector
and in particular in the power stations. However, the growth in imports
Imports of coal coming from the Unitod States already show a decline and
have been surpassed in quantity by imports from Poland, a country from
which increased purchases are being made and which supplies more than
one-third of the total coal imports of the Community.
3. Prices
The entry of the United Kinga.on into the Community led to National
Coal Board prices taking effect as from 1st January,l973 within the
enlarged Community. These prices were at a level below those of
continental producers, a difference which was accentuated in the course
of the year by the evolution of exchange parities between the respective
currencies. However,there have been no significant consequences as yet
in the coal market of the Community.
In the Community as a whole, the evolution of prices in 1973 has
been marked by rises, the greater part having taken place at end-Spring
and early-Summer. This rise in prices which.reflected rising costs, was
generally within a range of 5 to 10%; several price increases, however,
were outside of this range.
The rise in prices did not of itself lead to a corresponding
improvement in earnings. Until the Autumn, the level of prices of
competing energy ( fuel oil, Polish coal, and notably u.s.coal) had
continued to result in price alignments in the different sectors of
consumption. As from November 1973, the new situation in the energy
market should lead to an improvement in earnings of the coal producers.
For certain products, which had not reflected previous price increases,
price rises were announced in November.
With regard to coking-coal and coke, they reflected increases in
coal prices of third countries which had taken place since the end of
-
24-currencies also worked in favour of Community producers. Moreover, the
evolution of oil product prices is again stimulating the consumption of
coal, the increase of which so far has been relatively slow owing to
production and quality constraints.
In the course of the year
1973,
the rise in maritime charter rates,which had begun in the second half of
1972,
continued. As far asEurope is concerned, the very high rates reached in
1970
have beenlargely surpassed. These extreme rates, relating solely to spot
charters, affected only a limited part of the transport of coal.
Nevertheless, the rise in charter rates and in transport costs have both
c.
~1. Natur~l gas reserves
At 31st December,l972, proven and probable recoverable reserves of
natural gas of the enlarged Community were estimated at 4.870
milliard m3 representing an increase of 670 milliard m3 in relation
to end 1971, and despite output Hhich roached some 128 r.1illiard m3
during the period. This improvement resulted from e fuller
appreciation of previous discoveries and of new discoveries in tho
northern part of the North SeJ, and in the Adriatic. For tho first
time Denmark has contributed to the increase in the reserves, to the
extent of 14 milliard m • 3
In the course of 1973 discoveries wore developed in the North Sea,
particularly in the Norwegian zone, thus contributing to a
strengthening in the security of supply of Europe.
2. Trend of tho market for natural gas
(a) Production, intra-Community trade, imports
In 1974 the production of natural gas in tho Community could exceed
175 milliard m3, equivalent to an increase of 25 milliard m3 over
1973.. The annual rate of grovrth could thus rise from 15 to more
than 13%. This acceleration is nttrib1;,tablG to the Netherlands
and the United Kingdom wher8 production should increase by about 25%,
whilst in the other member countries the rate of grot~h is inferior
to the Community averagG; in France production continues at a high
level.
The exports of the Netherlands 1rill represent 49% of the production
of the country as conparod .vi th 47;:s in 1973 and 43~~ in 1972. The
Netherlands contributes 55% of tho combined natural gas requirements
-
26-These exports amol.Ulted to 44 milliard m3 or
85~~
of the maxirJ.umamount envisaged by the Netherlands Government to cover tho
external contractual arrangements of Gasunie.
Imports from third countries in 1974 should represent about
103,000 Teal, or 6.5% of the resources of the Community as com~ared
l-d th 5·4% in 1973. This element is expected to grow considerably
in the future, the end of 1972 and the year 1973 having been
marked by the conclusion of new very important contracts; 13
I:J.illiard m3/year of Algerian gas for a consortium covering the
German Federal Republic, France and Belgium; 15 milliard m3/year of
gas from the Frigg field (Anglo-Norvregian zone of the North Sea)
for Great Britain; 12 milliard n3jycnr of gas from the Ekofisk field
(Norwegian zone of the North Sea) for a consortium made up by the
German Federal Republic, Belgium, France and the Netherlands. These
two last contracts could bo substantially increased because of
extensions which have been discovered to the Frigg and Ekofisk
fields. In line with an agreement signed with the Soviet Union, 3
France will receive 2,5 milliard m a year of Soviet gas as from
1976.
Two agreements were signed in October,l973 for the supply of 10
milliard m3 of Algerian gas to the German Federal Republic with nn
option for a supplementary amount of 2 milliard m3,
ana
for the supply of 11 milliard m3/year of Algerian gas to ItC!.ly. Thoseagreements will come into force over a period of three years, from
1976 to 1979. A Belgian requirement from the Soviet Union should
bo taken into consideration for 1980; until then, available
reserves for exports of Soviet gas have already been taken up by
The totality of contracts concluded so far by the member states from
third countries amounts to 91.5 milliards m3
*
divided as followsaccording to sources; U.S.S.R., 20.5 milliard m3/year during 20
years, including an option of 5 milliard m3; Algeria, 41 milliard m3/
.,
year, including an option of 2 milliard mJ, Anglo-Norwegian North
Sea, 27 milliard m3/year; Libya, 3 milliard m3/year. This amount
is almost equivalent in calorific value to estimated Netherlands production in 1980 and represents one-third of the available gas to
the Community in that year.
Mention must be made of the offer from Iran to guarantee a supply of
40 milliard
m
3/~ear
to the countries of Western Europe.The year 1973 would thus appear to have been a decisive one for the
future of natural gas within the Community; the totality of supplies
foreseen for the next decade should permit a doubling of demand by
1980 and the contracts concluded during the year defer beyond 1990
the shortage whiuh will result from the exhaustion of the fields
currently being exploited within the Community.
(* about 100 milliard m3/year in Groningen equivalent).
3. Consumption
An increase in consumption of 19% is estimated for 1974 as compared
with 1973. The rate of growth of ~onsumption is weak in France,
Belgium and Luxembourg; in other countries it is above the Community
average; the U.K. heads the list with a growth rate of 25%. The
development of the domestic market is very different among the
consuming countries ( + 39% in the German Federal Republic as
compared with+ 5% in Italy.) In the power station sector, the
-
28-in
1974
as compared with + 12% in1973).
In the German FederalRepublic the power station. sector represents 29% of internc. .. l consumption, as compared with
27%
in the Netherlands and25o5%
inBelgiumo By contrast, it is 16% of total consumption in Luxembourg,
11% in France,
7%
in Italy and below5%
in the United Kingdom.In the industrial sector, the impossibility of equating supply to
demand has obliged companies to adopt restrictive measures; the
duration of contracts has been restored to one year or more, the
greater part of supplies having been placed under interruptibility
clauses; new agreements have been averted and in the United Kingdom
important contracts have not been renewed on expiration.
4• Prices of Natural Gas
In the international market there have been significant and general
price increases. All contracts recently concludedincorporate price
escalation clauses, the object of which is to protect producers from
the effects of the erosion of currencies and the inflation of costs,
and they tend to align the price of natural gas to that of competing
forms of energy.
In the market of final consumers, there were moderate price increases
in
1973 (
about5%
in the German Federal Republic and in France, and2.5%
in Belgium) whilst in Great Britain prices have remained stable.In the Netherlands, where natural gas prices are closely linked to
the price of fuel oil, there has been a largo increase in prices to
industry (+ 20%), except for companies consuming more than 10 million m3 per year and which undertake to enter into interruptible contracts.
At constant prices, the price of natural gas in
1973
has made it theCommunity. With regard to 1974, too many imponderables affect the
outlook. It may be noted that the Netherlands has already
announced a rise in prices of 20% in industrial tariffs from the
-~-D. Electricity
Electricity supply in the Community had to meet an overall demand of
about 1000 T\ih in 1973, equivalent to an increase of
8.5%
as comparedwith 1972 and notably above the long-term average rate of growth.
In recent years domestic and tertiary demand, almost without
exception, showed considerably higher increases than consumption
by industry. It may be noted, however, that in Belgium and Ireland,
industrial consumption of electricity has recently been increasing at
10% and more per annum. In 1973 the same was true for the United
Kingdom, but only because of the exceptionally low demand early in
the preceding year as a consequence of the miners' strike.
Electricity demand was estimated to increase by 7.4% in 1974 but the
oil supply crisis could lead to increased demand for electricity.
However, the extent to which oil supply difficulties may influence
the demand for electricity is subject to so many imponderables as to
make any forecast extremely tenuous.
Generation of primary electricity showed little progress in 1973
for the Community as a whole. Hydrological conditions were even
more unfavourabls during the first half of 1973 than in 1972 ( 14
and
8%
respectively below average level). Commissioning of newnuclear plant promises production increases in 1974 but these will
make themselves felt too late in the year to push the nuclear part of
total Community generation above the 6% mark already approached in
1972.
The Community's primary electricity generation plus net imports
amounted to 176 TtVh in 1973 as compared with 171 TWh in 1972, covering
by conventional thermal plants and to a very small degree (not
exceeding 1%) by pumped-storage power stations.
Conventional thermal generation will still have to keep pace with the
rate of increase of electricity demand in general, so long as the
expansion of nuclear generation does not compensate for the relative
decline of hydro-electricity. The 83% share of conventional thermal plants in total generation will remain almost unchanged in
1974,
raising the volume of electricity thus generated from
868
Trfu in1973
to
926
TWh in1974.
The corresponding input of solid,liquid andgaseous fuels should increase by
24.3
million tee in1973
and by17.2
million tee in1974,
provided that hydraulic conditions andtemperatures during the forthcoming year are normal and no restrictions
are imposed on demand. Total power station annual fuel demand would
then reach
325
million tee per year. These indications for1974
assmne "normal development" and do not take into account the possible
effects of the oil supply crisis on the economic situation and general
industrial activity. On the assumption that the supply of liquid
petroleum products is likely to fall short in
1974
and assuming thatalternative fuels are available throughout the year, the maximum
switch in the electricity generating sector in favour of coal could
be 12% and in favour of natural gas 6.4%.
The reduction in fuel oil needs could reach a maximum of 30 million
tons in the current year. This reduction could result, not only
from recourse to alternative fuels in the dual-fired power stations,
but also from the reduction - temporarily - in the utilisation during
the year of certain single-fired power plants, compensated for by a
-
32-The structure of the production park could mean that France, Italy,
and the Netherlands especially, should be able to take advantage of
the flexibility of a Hmulti-fired"park, whilst tho U.K. could turn
towards a different load factor modulation of the power stations.
The production of electricity from coal could thus increase notably
in Denmark, Germany, France, Italy and the U.K., whilst the
con-tribution from natural gas could increase above all in the
Nether-lands, and to a lesser extent in Germany and Belgium.
l'li th regard to nuclear power, there was only a minor additional
contribution to the electricity grid of the Community in 1973. The
nuclear plant at Borsele (Netherlands), a light-water pressuriscd
reactor of 390 MWe, is gradually reaching its nominal poll.rer. On the
other hand, the first Belgian plant at Docl, also a light-water
pressurised reactor of 390 MWe, did not come into operation during
the year, contrary to forecasts. The development of two prototypes
of fast breeder sodium-cooled reactors of 250 MWe each will be
completed within a few months of each other; the Phoenix plant
(France) having reached criticality at the end of August was due to
be linked to the grid by the end of 1973, and the P.F.R. at Dounreay
(U.K.) is, on the other hand, at the point of criticality. These two
developments are of considerable importance. In effect, on their
performance depends the coming into operation in France and in the
United Kingdom - and indirectly in Germany- the first commercial
fast breeder of such a size, and consequently the entire programme
for fast breeders in the countries concerned.
For the Community as a whole ( and including Dounreay}, the nuclear
11,000 MJ~e in the preceding year. Production exceeded 57,000GWh,
corresponding to an input of 11.5 million tons of fuel oil.
The year 1974 could witness, if there are no serious delays in the
development of projects, a marked increase in the nuclear park of
the Community. Some 4000 MWe are in the course of development,
including the first plant to exceed one thousand megawatts (Biblis A
- 1146 MWe). If all plants are in operation by the end of 1974,
the nuclear park should reach 16,000 MWe, and production should
amount to some 66,000 GWh, equivalent to an input of more than 13
-
34-E. Nuclear Fuels
1. Natural uranium
According to the O.E.C.D.(l~) and A.I.E.A. Report of August 1973,
the reasonably assured world resources of natural uranium were
estimated at 1st January,l973, at 866,000 tons in the range of
prices below ¢10 per lb. of u3o8, and 680,000 tons in the price
range of ¢10 to ¢15 per lb. of u
3o8• For the Community the respective estimates are 43,000 and 20,000 tons.
At present the market for natural uranium is giving some indications
of supply difficulties; in the long-term, the security and contin~y
of supply cannot be assured, since on the one hand the present level
of prices is unlikely to encourage producers to invest in the search
for new reaources and, on the other hand, relatively long delays
transpire between the start of prospection and the development of
production ( about 8 years).
Contracts concluded in the course of 1973 show that prices expressed
in constant money terms have not risen to any marked degree.
Moreover, it should be noted that the u.s. embargo on imports of
natural uranium from other countries, is still in force.
2. Enriched Uranium
The year 1973 was marked by various developments, representing a
continuation of trends over preceding years, with a view to
providing the Community with its o"m enrichment capacity. Thus,
following the proposals presented by the Commission in 1972, and
20th March,l973, the Council of Energy on the 22nd May, 1973,
/
created a "Permanent Committee for the Enrichment of Uraniu.rn",
composed of representatives of public authorities and interested
task of undertaking studies of the market for enriched uranium, of
analysing the fundamental characteristics of the various
technolo-gies, of examining ways of promoting the development of the
necessary industrial capacity in the Community and of facilitating
the co-ordination of initiatives between the interested parties.
The Committee transmitted its report to the Commission at the end
of Octobnr, and the Commission presented, on this basis, its
proposals to the Council on the 14th November,l973.
Moreover, the study group for the construction of a multi-national
enrichment plant by gas diffusion (EURODIF), created in February
1972, witnessed the withdrawal of three members (Germany,
Nether-lands and the U.K.) at the beginning of 1973. Its work has
nevertheless continued and the group was transformed into a company
in the course of October and reached a decision in principle by the
end of 1973.
It may be recalled that the two pilot plants for the enrichment of
uranium by ultracentrifugation ( at Capenhurst in Great Britain and
Almelo in the Netherlands) continue with their production. An
increase in production is foreseen and it should reach 400 tons UTS
per year by the end of 1976.
With regard to supplies from the United States, the American
Government has established new criteria for access to the available
capacity of the USAEC. These criteria envisage two types of
contract - long term (maximum duration of 30 years) and short term
(maximum duration of 3 years). The conclusion of contracts for the
long term should be realised eight years before the first delivery
-~-for a period of at least 10 years. Moreover, the ceiling of
215 tons of u
235 contained in the agreement linking the Community to the USAEC has been raised and fixed at a quantity of uranium
corresponding to the needs of the 35,000 MWe installed in the
Community.
Another important factor in the evolution of the market for
enriched uranium, which is not unconnected with the new American
conditions, has been the conclusion of enrichment contracts to
order with the Soviet Government for the benefit of various
consumers within the Community.
3.
PlutoniumThe activity which manifested itself in the plutonium sector in
the course of
1972
was followed up in1973,
although it ispremature to speak in terms of a true market; nevertheless, some
important transactions have been concluded between producers and
OFFICE FOR OFFICTAL PUBLICATIONS OF
Cose postole 1003 - Luxcmbourg