OFFICE STATISTIQUE DES COMMUNAUTES EUROPEENNES - STATISTICAL OFFICE OF THE EUROPEAN C O M M U N I T I E S - STATISTISCHES t T DER EUROPAISCHEN GEMEINSCHAFTEN - ISTITUTO STATISTICO DELLE COMUNITÀ EUROPEE - BUREAU VOOR DE STATISTIEK DER EURO PESE GEMEENSCHAPPEN - DET STATISTISKE DEPARTEMENT FOR DE EUROPAEISKE FAELLESSKABER - OFFICE STATISTIQUE DES C O M M U NAUTES EUROPEENNES - STATISTICAL OFFICE OF THE EUROPEAN COMMUNITIES - STATISTISCHES AMT DER EUROPAISCHEN GEMEINSCH AFTEN - ISTITUTO STATISTICO DELLE COMUNITÀ EUROPEE - BUREAU VOOR DE STATISTIEK DER EUROPESE GEMEENSCHAPPEN - DET ST | ATISTISKE D E P A R T E M E N T FOR DE EUROPAEISKE FAELLESSKABER - OFFICE STATISTIQUE DES COMMUNAUTES EUROPEENNES - STATISTI CAL OFFICE OF THE EUROPEAN COMMUNITIES - STATISTISCHES AMT DER EUROPAISCHEN GEMEINSCHAFTEN - ISTITUTO STATISTICO DEL LE COMUNITÀ EUROPEE - BUREAU VOOR DE STATISTIEK OER EUROPESE GEMEENSCHAPPEN - DET STATISTISKE DEPARTEMENT FOR DE UROPAEISKE FAELLESSKABER - OFFICE STATISTIQUE DES C O M M U N A U T E S EUROPEENNES - STATISTICAL OFFICE OF THE EUROPEAN CO MMUNITIES - STATISTISCHES AMT DER EUROPAISCHEN GEMEINSCHAFTEN - ISTITUTO STATISTICO DELLE COMUNITÀ EUROPEE - BUREAU | VOOR DE STATISTIEK DER EUROPESE GEMEENSCHAPPEN - DET STATISTISKE D E P A R T E M E N T FOR DE EUROPAEISKE FAELLESSKABER OFFICE STATISTIQUE DES COMML \~
DER EUROPAISCHEN GEMEINSCH, ESE GEMEENSCHAPPEN - DET S NAUTES EUROPEENNES - STATI HAFTEN - ISTITUTO STATISTICO Dl TATISTISKE DEPARTEMENT FOR O] ICAL OFFICE OF THE EUROPEAN LE COMUNITÀ EUROPEE - BUREA| £UROPAEISKE FAELLESSKABER MUNITIES - STATISTISCHES AMT D OOR DE STATISTIEK DER EUROPE] FICE STATISTIQUE DES C O M M U N «
EUROPAEISKE FAELLESSKABER - OFFICE STATISTIQUE DES C O M M U OMMUNITIES - STATISTISCHES A M T DER EUROPAISCHEN GEMEINSCt AU VOOR DE STATISTIEK DER EUROPESE GEMEENSCHAPPEN - DET S OFFICE STATISTIQUE DES COMMUNAUTES EUROPEENNES - STATIST T DER EUROPAISCHEN GEMEINSCHAFTEN · ISTITUTO STATISTICO DEL ESE GEMEENSCHAPPEN - DET STATISTISKE DEPARTEMENT FOR DE 1 * U T E S EUROPEENNES -STATISTICAL OFFICE OF THE EUROPEAN C O M ΓΕΝ - ISTITUTO STATISTICO DELLE COMUNITÀ EUROPEE - BUREAU V STISKE DEPARTEMENT FOR DE EUROPAEISKE FAELLESSKABER - OF ÉL OFFICE OF THE EUROPEAN COMMUNITIES -STATISTISCHES t R EUROPAISCHEN G E M E I N S C H A F T
GEMEENSCHAPPEN - DET STATIS Π S EUROPEENNES - STATISTICAL O F
ISTITUTO STATISTICO D E L L E COMUNITÀ EUROPEE - BUREAU VOOR DE STATISTIEK DER EUROPESE GEMEENSCHAPPEN - D E T STATISTISKE DEPARTEMENT FOR DE EUROPAEISKE FAELLESSKABER - OFFICE STATISTIQUE DES C O M M U N A U T E S EUROPEENNES - STATISTICAL OFFICE OF THE EUROPEAN COMMUNITIES - STATISTISCHES A M T DER EUROPAISCHEN GEMEINSCHAFTEN - ISTITUTO STATISTICO DELLE COMUNIT A EUROPEE - BUREAU VOOR DE STATISTIEK DER EUROPESE GEMEENSCHAPPEN - OET STATISTISKE DEPARTEMENT FOR DE EUROPAEISK E FAELLESSKABER OFFICE STATISTIQUE DES C O M M U N A U T E S EUROPEENNES STATISTICAL OFFICE OF THE EUROPEAN COMMUNITIES -STATISTISCHES A M T DER EUROPAISCHEN GEMEINSCHAFTEN - . ISTITUTO STATISTICO DELLE COMUNITÀ EUROPEE - BUREAU VOOR DE STA TISTIEK DER EUROPESE GEMEENSCHAPPEN - DET STATISTISKE DEPARTEMENT FOR DE EUROPAEISKE FAELLESSKABER - O F F I C E STATIST IQUE DES COMMUNAUTES EUROPEENNES - STATISTICAL OFFICE OF THE EUROPEAN COMMUNITIES - STATISTISCHES AMT DER EUROPAIS CHEN GEMEINSCHAFTEN - ISTITUTO STATISTICO DELLE COMUNITÀ EUROPEE - BUREAU VOOR DE STATISTIEK DER EUROPESE GEMEENSC HAPPEN - DET STATISTISKE D E P A R T E M E N T FOR DE EUROPAEISKE FAELLESSKABER - OFFICE STATISTIQUE DES C O M M U N A U T E S EUROPE
=a
eurostat
DE EUROPÆISKE FÆLLESSKABERS STATISTISKE KONTOR STATISTISCHES AMT DER EUROPAISCHEN GEMEINSCHAFTEN STATISTICAL OFFICE OF THE EUROPEAN COMMUNITIES OFFICE STATISTIQUE DES COMMUNAUTÉS EUROPÉENNES ISTITUTO STATISTICO DELLE COMUNITÀ EUROPEE
BUREAU VOOR DE STATISTIEK DER EUROPESE GEMEENSCHAPPEN
Luxembourg. Centre Européen, Bolle postale 1907 - Tél. 47941 Télex: Comeur Lu 3423 1049 Bruxelles, Bâtiment Berlaymont, 200, rue de la Loi (Bureau de liaison) - Tél. 7358040
To obtain this bulletin regularly please apply to:
EUROSTAT Publications B.P. 1907 Luxembourg
EUROSTAT NEWS
8/9-1976
TABLE OF CONTESTS
Page
PART 1 - HEWS ITEYS
5 Statistical programme of the European Communities, 1977-1979 6 Wages of permanent workers in agriculture in 1974
10 Labour costs in industry 1972-1975 14 Balances of payments 1975
PART 2 - EUROSTAT PUBLICATIONS 20 Annual publications
- 5
STATISTICAL PROGRAMME OP THE EUROPEAN COMMUNITIES, 1977-1979
At the end of July the Commission approved a programme of statistical work covering the period 1977, 1978 and 1979, drawn up by the Statistical Office. It has been sent to Council with a request that Council should give its decision on the general lines of the programme. Simultaneously it has been sent, for information, to the Parliament and to the Economic and Social Committee.
This programme is the second in a series begun in July 1974 by the publication of a memorandum by the Statistical Office of the European Communities (EUROSTAT) setting out a work programme for the years 1975-1978. The first programme was circulated for information only.
The programme is divided into two parts. The first part describes the objectives and the general lines of the programme, the major sectors of activity in the next three years, the priorities and the resources. To underline the dynamic nature of these programmes, an indication is given of those projects, which on current form are likely to be the subject of proposals for development or revision in the next programme in the series. Finally, in order to set the present programme in a slightly longer—term context and to facilitate the discussion of the planning of the future workload of the statistical services of the Community, there is an indicative timetable for the
major Community statistical surveys as far ahead as I98I.
The second part takes the form of an annex which sets out the detailed elements of the EUROSTAT programme - nearly 25O separate projects are listed. Many of these are inter—related and are summarised in some 30 principal themes. Alongside these details of the work of EUROSTAT there is information about projects of other Directorates General which are of statistical interest. The annex also includes an indicative programme of the statistical publications planned by EUROSTAT for the years 1977-1979.
6
-Wages of permanent workers in agriculture in 1974
There are some 590 000 permanent workers in agriculture in the European Economic Community as a whole (l). This is one of the principal findings of a Community survey carried out for the first time in 1974 to obtain comparable information on the effective earnings of these wage-earners (?).
If the average hourly earnings of these workers are expressed in a common monetary unit, the Eur (3), a clear difference is apparent between the level of such earnings in the Federal Republic of Germany, the Netherlands and Denmark (2.03 to 2.33 Eur) and in France, Italy and the United Kingdom (l.08 to 1.24 Eur). The level in Belgium takes up an intermediate position (I.70 Eur), while in Luxembourg it is only 0.75 Eur (cf table l) but the number of workers in Luxembourg is very small indeed.
(1) Permanent workers are defined as manual employees who are not members of the family and who are employed on a permanent basis on the holding, i.e. who can expect to be retained, full-time, continously and regularly for the whole year.
(2) See Eurostat publication "Earnings of permanent workers in agriculture 1974" (Social statistics Nc 5/1975).
Table 1
Number employed, hourly earnings and number of hours paid of permanent workers in agriculture in 1974 *
Federal Republic of Germany France
I t a l y
Netherlands * * Belgium Luxembourg United Kingdom Denmark Number employed 44.863 179-647 126.981 19.275 4.731 372 178.360 16.161
Average hourly earnings in n a t i o n a l
currency
6,53 DM 6,48 P f r
931 Lit 7,16 Fl 82,64 Fb 36,67 Fix
66 C 16,93 Dio-in Eur 2,03 1,08 1,15 2,13 1,70 0,75 1,24 2,23 Average monthly number of hours
paid ?01 204 I87 ?01 177 229 207 18?
* in April, except in the case of Germany and Italy where the data are for September
** skilled workers only
For a correct appreciation of these discrepancies, it must be remembered that the structural characteristics of this type of labour may differ considerably from one country to another, and that the calculations into Eur had to be made on the basis of official exchange rates. Nevertheless, the information available on parities in terms of purchasing power for 1975 makes it reasonable to suppose that if it had been possible to include theee in the 1974 calculations, the results and the con-clusions would not have been fundamentally different.
It is also possible to compare within one and the same country the earnings of these agricultural workere with those of workers in industry (l), comparing as far as possible like with like (sex, size of holdings and undertakings, exclusion of benefits in kind). Compared in this way, the effective earnings of permanent workers in agriculture amount to 70 to 90 $, depending on the country, of the earnings of workers in industry (cf.Table 2 ) .
8
Table 2
Hourly earnings of manual workers
in agriculture and in industry in 1974
*
F e d e r a l Republic
of Germany
France
I t a l y
Netherlands
Belgium
Luxembourg
United Kingdom
Denmark
Industry
i n n a t i o n a l
currency
9,84 DM
10,00 Ffr
1.315 Lit
8,67 Fl
120,49 Fb
140,32 F i x
(98 £) **
25,26 Dkr **
A g r i c u l t u r e
in n a t i o n a l
currency
8,0° DM
8,20 P f r
1.010 Lit
7,82 Fl
93,23 Fb
72,14 F i x **
68 £
21,98 Dkr
as % of t h e hour
l y earnings of t h e
worker in i n d u s t r y
82,2
82,0
76,8
90,2
77,4
51,4
(70) ♦*
87,0
* Wages of male manual workers employed in holdings or industrial under
takings with at least 10 wageearners; the figures are for April 1974
except in the case of Germany and Italy where they are for September/
October.
** Agricultural holdings with at least 3 wageearners.
** Estimate.
** Average hourly earnings of workers (men and women) in undertakings
employing at least six wageearners.
There are a number of other interesting findings from the survey, such as,
for example :
relatively few women are found in this type of work (between 4
%
in
Denmark and 13
%
in the Federal Republic of Germany) and in almost all
cases the difference in wages between men and women of equivalent
qualifications is less than 13
%;
-
the level of remuneration increases with the size of the holding (number
of wageearners employed), and the difference varies between 10
%
- the hourly earnings of workers employed exclusively on animal breeding or the growing of special crops are higher than those of workers employed in general agriculture or in mixed activities;
- the maximum earning level is achieved between the ages of 30 and 44 and begins to decrease from this age onwards.
10
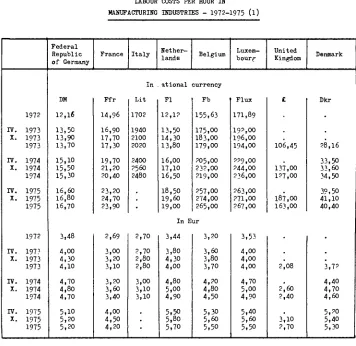
-LABOUR COSTS IN INDUSTRY 1972-1975
The Statistical Office of the European Communities, with the assistance of national statistical services, has recently completed calculations for 1973 to 1975 to update the results of the Community survey on labour costs which was held in 1972
(1973 in Denmark and the United Kingdom) (l).
Tables 1 and 2 show the development in Community countries of labour costs per hour for all employees in manufacturing industries. The data in national currencies indicate the development of costs vithin each country. For comparisons of earnings between the countries, the data were converted into a single monetary unit, in this case the "unit of account of the European Communities (Eur)" (2); since establish-ments do compete with each other in the market for their products, and the official exchange rates are used in trade transactions, it is appropriate to use the same exchange rates for labour costs, which represent a more or less considerable part of production costs.
Analysis of the data shows that in the Federal Republic of Germany labour costs rose considerably less than in the other Community countries. Between 1973 and I975 (the period for which comparisons with the United Kingdom and Denmark are possible) the annual increase was only 10 % in the Federal Republic of Germany, compared with between 17 7° (Netherlands and Luxembourg) and 24 % (United Kingdom) in the other countries.
Looking at the situation in the original six Member States from 197p to 1975, it will be seen that labour costs increased most in Belgium (70 $>), which is equivalen' to a mean annual increase of 19 %, compared with 17 % in France, 16 % in the
Nether-lands and Luxembourg and 11 % in the Federal Republic of Germany. It is a1so clear that since 1973 the rate at which labour costs have increased has accelerated in all countries except for the Federal Republic of Germany.
(1) Detailed results of this survey are published in Eurostat, Social Statistics Nc 6/1975 - "Labour costs in industry 1972-1975"
11
To a certain extent, the increase in labour costs is obviously linked with price increases. If one compares the indexes for the increase in labour costs per hour with the price indexes for the gross domestic product at market prices, it will be seen that prices have increased over this three—year period by 20 % in Germany and by 30 - 50 % in the other countries, and that if the labour costs indexes are deflated by the price indexes, the real increase in labour costs was greater in Belgium (25 %) than in the Netherlands (21 # ) , France (20 %), Germany (15 f°) and Luxembourg (l4 %)·
Table 2 shows that the figure for labour costs per hour in the Federal Republic of Germany, which was still the highest in October 1973, was overtaken in A-iril 1?74 by that for the Netherlands, in October 1974 by that for Luxembourg and in
April 1975 by those for Belgium and for Denmark. The competitiveness of German labour costs in industry has therefore improved compared with all other Community countries except Italy, where the drop in the exchange rate of the lira has led to an appreciable drop in the relative export prices of goods and services. The position of France has also improved over that of several countries, particularly the Benelux countries.
- 12
Table 1
LABOUR COSTS PER HOUR IN
MANUFACTURING INDUSTRIES - 1972-1975 (1)
IV. X. IV. X. TV. X. TV. X.
rv.
X. IV. X. 1972 1973 1973 1973 1974 1974 1974 1975 1975 1975 1972 197? 1973 1973 1974 1974 1974 1975 1975 1975 Federal Republic of Germany DM 12,16 13,50 13,90 13,70 15,10 15,50 15,30 16,60 16,80 16,70 3,48 4,00 4,30 4,10 4,70 4,80 4,70 5,10 5,20 5,20 France Ffr 14,96 16,90 17,70 17,30 19,70 21,20 20,40 23,20 24,70 23,90 2,69 3,00 3,20 3,10 3,20 3,60 3,40 4,00 4,50 4,20 Italy In Lit 1702 1940 2100 2020 2400 2560 248O•
2,70 2,70 2,80 2,80 3,00 3,10 3,10 Nether-lands ational Fl 12,12 13,50 14,30 13,80 16,00 17,10 16,50 18,50 19,60 19,00 In E 3,44 3,80 4,30 4,00 4,80 5,00 4,90 5,50 5,80 5,70 Belgium currency Fb 155,63 175,00 183,00 179,00 205,00 232,00 219,00 257,00 274,00 265,00 ur 3,20 3,60 3,80 3,70 4,20 4,80 4,50 5,30 5,60 5,50 Luxem-bourg Flux 171,89 192,00 196,00 194,00 229,00 244,00 236,00 263,00 271,00 267,00 3,53 4,00 4,00 4,00 4,70 5,00 4,90 5,40 5,60 5,50 United Kingdom£
106,45 137,00 127,00 187,00 163,00•
2,08 2,60 2,40 3,10 2,70 DenmarkDkr
•
28,16 33,50 33,60 34,50 39,50 41,10 40,40•
3,7? 4,40 4,70 4,60 5,20 5,40 5,3013
-T a b l e 2
DEVELOPMENT OF LABOUR COSTS PER HOUR
IN MANUFACTURING INDUSTRIES
IV. X.
rv.
X. IV. X. IV. X. TV. X.rv.
X. 1973 1973 1973 1974 1974 1974 1975 1975 1975 1972 1973 1973 1973 1974 1974 1974 1975 1975 1975 Federal Republic of Germany 111 114 113 124 127 126 137 138 137 100 100 100 100 100 100 100 100 100 100 France 113 118 116 132 142 136 155 165 160 Feder 77 75 74 76 68 75 72 78 87 81Italy Nether
lands Belgium
1972 100 (l)
114 123 119 141 150 146
•
111 118 114 132 141 136 153 162 157 112 118 115 132 149 141 165 176 170 Luxem bourg 112 114 113 133 142 137 153 158 155al Republic of Germany ■ 100
78 68 65 68 64 65 66
•
99 95 100 98 102 104 104 108 112 110 92 90 88 90 89 100 96 104 108 106 101 100 93 98 100 104 104 106 108 106 United Kingdom 100 129 120 176 154 51 54 51 60 52 Denmark 100 119 126 123 140 146 143 91 94 98 98 102 104 102- 14
BALANCES OF PAYMENTS I975
The Statistical Office of the European Communities has recently published the yearbook "Balances of payments - Global data. 1961-1975" which supplies the most up-to-date annual data available for each of the Member States and for all of them together (EUR 9 ) , as well as for the United States and Japan.
These figures - expressed in an identical unit of account and presented in a balance of payments scheme derived from that of the IMF — revealed a trend in I975 representing a clear impro\ement on that of the previous year, which had been affected by the sluggishness of the economic situation in the Community countries and by the general increase in the price of oil decided on by the producer countries.
Unfortunately, the improvement in the balance of payments in 1975 ¿id not reflect an economic recovery, but rather the general stagnation in production which in particular slowed down imports.
The principal headings of the balance of payments give rise to the following remarks :
"Current" operations (goods, services and transfers)
The balance of thèse operations for EUR 9 as a whole, moving from -9754 mill Eur in 1974 to 1330 mill Eur in 1975, showed a spectacular recovery of a magnitude — more than 11 000 mil Eur - without precedent in Community history. This improvement is due in virtually its entirety to the development under the heading "Merchandise", as the exchange of services worsened by around 48O mill Eur during 1975 and the balance under the heading "Transfers" - its pattern negative for the Community zone - was only slightly reduced.
- 15
Capital of non-monetary sectors
Even though almost all the balances of the Member States in 1975 showed a deterioration under this heading by comparison with the preceding year, the Community zone still remained a net importer of capital. This was largely due to the fact that Germany, having in 1974 recorded significant net outflows of capital (in particular at short term) returned to being a magnet for foreign capital as it had been since the beginning of the 70's.
Capital and gold of the monetary sector
The remarkable recovery over 1974 in the balance of "current" operations had direct repercussions on the balance of movements of capital and gold of the monetary sector, where a 6 822 mill Eur net increase in assets for the whole Community was recorded in 1975·
The EUROSTAT publications are delivered
by the following sales agents:
Belgique - België
Moniteur beige Belgisch Staatsblad Rue de Louvam 4 0 - 4 2 Leuvenseweg 4 0 42 1000 Bruxelles 1000 Brussel Tél. 5 1 2 0 0 26
CCP 0 0 0 2 0 0 5 5 0 2 - 2 7 Postrekening 0 0 0 - 2 0 0 5 5 0 2 27 Sous-dépôt Agentschap Librairie européenne Europese Boekhandel
Rue de la Loi 244 Weistraai 244 1040 Bruxelles 1040 Brussel
D a n m a r k
J H. Schult/ - Boghandel Møntergade 19 1116 Kobenhavn K Tel 14 1 1 95 Girokonto 1 195
BR Deutschland
Verlag Bundesanzeiger
5 Köln 1 Breite Straße Postfach 108 0 0 6 Tel. 102211 2 1 03 48
(Fernschreiber: Anzeiger Bonn 08 882 5951 Postscheckkonto 8 3 4 0 0 Köln
France
Service de vente en France des publications des Communautés européennes Journal officiel
26. rue Desaix 75 732 Pans Cedex 15
Tel 11) 5 7 8 6 1 39 CCP Pans 23 96
Ireland
Stationery Office Beggar's Bush Dunlin 4 Tel 68 84 33
Italia
L ibreria dello Stato Piazza G Verdi 10 0 0 1 9 8 Roma Tel (6) 8 5 0 8 Telex 6 2 0 0 8
CCP 1 2 6 4 0 Agenzie: 0 0 1 8 7 Roma
2 0 1 2 1 Milano
Via XX Settembre (Palazzo Ministero del tesoro) Galleria Vittorio Emanuele 3 Tel 8 0 64 06
G r a n d - D u c h é de Luxembourg
Office des publications officielles des Communautés européennes S rue du Commerce
Boîte postale 1003 Luxembourg Tél. 4 9 0 0 8 1 CCP 191 9 0 Compte courant bancaire : BIL 8 - 1 0 9 6 0 0 3 ' 3 0 0
Nederland
Staatsdrukkerij en uitgeveri/bedri/f Chnstoffel Planti|nstraat. s Gravenhage Tel (070Ì 81 45 1 1
Postg.ro 42 53 0 0
United Kingdom
H.M. Stationery Office PO. Box 569 Loodon S E I 9NH Tel. 101) 9 2 8 6 9 7 7 . ext 365
United S t a t e s of A m e r i c a
European Community Information Service 2 1 0 0 M Street Ν W
Suite 707
Washington D.C 20 03 7 Tel. 2 9 6 51 31
S c h w e i z - Suisse - Svizzera
Librairie Payor 6. rue Grenus
1211 Genève Tel 31 89 50 CCP 12 236 Geneve
Sverige
Librairie CE Fritze 2. Frerlsgatan Stockholm 16
Post Giro 193 Bank Giro 73 4 0 1 5
Espana
Libreria Mundi Prensa Castellò 37 Madrid 1 Tel 275 46 55
O t h e r countries
19 -SUMMART
Published : Page June 1976 :
Balances of payments - Geographical breakdown (1970-74) 20 Regional statistics : population, employment, living conditions 21 Regional statistics : the Community's financial participation in
investments 22 Earnings in agriculture 1974 p:> Special edition of the monthly external trade bulletin
-Annual external trade figures 1958-1975 25 Survey of the structure and distribution of earnings in industry
in I972 - Volume 4 A and Β - Belgium ?7
July 1976 :
Basic statistics I975-76 20 Balances of payments - Global data (196I-I975) 2I
Some figures 1 Public expenditure on Research and Development
in the Community countries, 1974-75 27 Selling prices for vegetable products (1969-74) 23 Selling prices for animals and animal products (1969—74) 23
August 1976 :
Survey of the structure and distribution of earnings in industry
in 1972 - Volume 5 A and Β - Netherlands '7 Analytical tables of EC external trade - NIMEXE - 1974
Survey of the structure and distribution of earnings in industry in 1972 - Volume 6 A and Β - Germany
"5
To be published shortly :
Regional accounts : main economic aggregates - 1970
Agricultural prices -Fruit, vegetables and potatoes - 1975 24
Feed balance sheets : Resources 24 Community survey of orchard fruit trees 24 Utilization of nuclear power stations, 1975 24
27
Price ι £
DK
US s
Fb
1,10
15,70
2,4ο
100
PO
-ANNUAL PUBLICATIONS
irange series : Basic statistics
216 pages Format A 6
E and f editions published in June 1976 Dk, d, i and η editions published in July 1976
Pocket size volume containing a selection of the most important Community statistics and comparisons with certain other European countries, the United States, Japan and the USSR. This selection covers the following sectors :
Population External trade
Labour force Incomes and hours of work National accounts Social accounts
Research and education Standard of living
Agriculture Prices Energy Finance Industry Regional population and employment Transport
iolet series : Balances of payments - Geographical breakdown (197O-I974)
147 pages Format A 4 Price : C 1,70 Multilingual edition published in June 1976 ..„, '·)'2Λ
Fb 150' This volume presents the most recent available data on the geographical breakdown of the balance of payments of each European Community country and of the United States and Japan.
The balances of the European Community countries are also given in the form of totals relating to the six original Member States (EUR 6) and, where possible, to the nine current Member States (EUR 9) as a whole.
21
-Violet series : Balances of payments - Global data (I96I-I975)
Price : £ 3,70
DK 47,20
Approximately 75 pages Format A 4 US$ 8,60
Fb 300
Multilingual edition published in July 1976
This volume presents the most recent available data on the global
balance of payments (annual flows) and on the external position
of the monetary authorities (at period-end exchange rates) for each
European Community country, the United States and Japan.
The balances of the European Community countries are also given
in the form of totals relating to the nine Member States (EUR 9)
as a whole.
The data, expressed in millions of units of account of the European
Community and presented according to the EUROSTAT balance of
payments scheme, cover the period I96I to 1975· Most of the tables
also contain the figures for 1958 for comparison purposes.
Regional statistics : population, employment,
living, conditions
_""
~ ~
W c, .
£ 1 | ? 0295 pages Format A 4 {£$
2\'$
Multilingual edition published in June 1976 Fb I50
This publication contains the most recent statistics on social
conditions in the I40 regions of the European Communities :
- Total population andpopulation growth, births, deaths, trends in
birth and death rates, age structure, trend of population over
the last three censuses, interregional movement of population.
- Employment and structure of employment broken down by sex, age,
categories of activity, branches of activity (with comparative
statistics for 1968-1973 in respect of the principal data).
- Registered unemployment.
- Indicators of the quality of life : physical environment,
housing, education, health, miscellaneous indicators and
standard of living.
2?
Violet s e r i e s : Regional S t a t i s t i c s : the Community's Financial P a r t i c i p a t i o n in
Investments
Price : £ 3,10
137 pages Format A 4 us,} γ ? 0
Multilingual edition published in June V'76 Fb ?50 The present publication gives a survey of the different financial participations of the Community in favour of the investments in the Community regions.
The published figures represent the amounts of financial
participations and the corresponding amounts of investments; they are given annually for 1972, 1973 and 1974 and cumulatively, for the period ending 31 December 1974.
Regional accounts : main economic aggregates - 1970
Price : £ 1,70 DK 23,50 Approximately 250 pages Format A 4 US$ 3,60 Multilingual edition to be published in August 1976
First publication of the main aggregates of regional accounts drawn up according to the European system of integrated economic accounts at the level of the Community's basic administrative units (llO).
The introduction defines regional accounts according to the European system of integrated economic accounts (ESA), and introduces in particular the branch nomenclature (NUTS), applied at regional level.
The results are presented in two types of table : - Summary tables (l to 4) :
- Dispersion index of value added per inhabitant, illustrated by a map showing the wide differences between the more favoured and less favoured regions of the EC.
- Principal regional global economic aggregates (value added, disposable income, final consumption, total employment and paid employment), related to the population or to employment. These results are statistically analysed and commented upon. - Value added by groups of branches and localization quotient
for value added, showing regional structural disparities. - Detailed tables (5 to 11) :
- Gross value added at market prices, value added at factor cost, employees' earnings, gross operating surplus, total employment, paid employment.
This data is based on NACE-CLI0 RR 17.
23
-Yellow series : Earnings in agriculture 1974
Price : £ 2,80 DK 39,15 108 pages Format A 4 US$ 6,0 Multilingual edition published in June 1976
This publication contains the methodology and detailed results of the first Community survey of earnings of permanent workers in agriculture in 1974·
These results cover labour forces, earnings and monthly duration of paid work, broken down by sex, age, training, type of work, relative size of holding and the provision or not of payment in kind. In the case of certain countries, these data are also broken down by major region.
Green series : Selling prices for vegetable products . . 0.
(1969-1974) P r l o e ! £ 2'8 0
Approximately 18O pages, Format A 4 US$ 6,0 Multilingual edition, published in July 1976
This special number of "Agricultural statistics" comprises information on the prices of all the important vegetable products including the flowers and the prices of a certain number of processed products as well. It is intended for completion of the former publication "Agricultural prices -Fruit, vegetable and potatoes" S 8/1973.
Its part I is treating the prices from I969 to 1974 for EUR 9. These figures will be updated in the current publications. The part II, as usual, contains the description of the price series in the "Catalogue of the characteristics which determine prices".
Selling prices for animals and animal products
TT969=1974T
price113 pages Format A 4
Multilingual edition, published in July 1976
This special number of "Agricultural statistics" covers a new field and is intended for completion of the prior publication "Agricultural prices - Animals and animal products" S 5/1973· It is essentially devoted to the prices of milk, of eggs and of dairy products as well.
Its part I is treating the prices from I969 to 1974 for EUR 9. These figures will be updated in the current publications. The part II, as usual, contains the description of the price series in the "Catalogue of the characteristics wich determine prices".
£ DK
US S
24
-Green series : Agricultural prices -Fruit, vegetables
and potatoes 1975 ~ . . .
r'''
Price : gratis
Approximately 100 pages Format A 4
Multilingual edition to be published in August 1976
This edition is bringing up to date the prices published
together with their descriptions in the special issue
"Agricultural prices -Fruit, vegetables and potatoes" S 8/l973,
amended already under the same title in 1974 (with prices for
1972 and 1973).
The new edition contains the definite prices of fruit, vegetables
and potatoes for 1973 and provisional figures for 1974·
Feed balance sheets : Resources
Price
£ DK US %Fb
7,30
94,50
17,20
600
£
DK
US $
Fb
7,30
94,50
17,20
600
Approximately 144 pages Format A 4
Multilingual edition to be published in August 1976
This is the first EUROSTAT publication devoted to animal feed
in the form of feed balance sheets. In this first volume are
given data relating to the "Resources" section of the feed
balance sheets : the principal feed products, quantities,
composition of the ressources, origin of the ressources, and
a comparison of livestock/feed ressources.
These data will be up-dated periodically.
Community survey of orchard fruit trees
Price
Approximately l80 pages Format A 4
Multilingual edition to be published in August 1976
This publication contains the most recent statistics on the
500 000 hectares of commercial orchards under apples, pears,
peaches and oranges in the EEC. The tables provide details
of age of orchard and density of plantation for the main
fruit varieties of each species in individual Member States
and production zones. The information was collected by special
surveys under Directive
"JI/206/EEC
(which is reprinted in the
annex). A description of the survey methods for each country,
together with some historical statistics, is given.
Ruby series : Utilization of nuclear power stations. 1975
Price : £ 1,4!:
Approximately 64 pages oblong Format A 4 DK 13,90
E/F bilingual edition to be published _, "
'~'
in August 1976
25
Red series ! Analytical tables of EC external trade (NIMEXE) 1974
(l3 volumes)
Price
Series :
t
49,5o
DK 7o4,25
US S lo8,5o
Fb 4*5oo
+ 6 000 pages DIN A 4Multilingual edition published in August I976
S t a t i s t i c s of the external trade of the European Community and of i t s Member States, expressed in NIMEXE nomenclature.
In the f i r s t 12 volumes (A-L) external trade is broken down, in product order, by country of origin or destination, applying the NIMEXE 6-figure nomenclature.
In the 13th volume i t i s broken down, in order of country of origin or destination, by product, applying the NIMEXE 2figure c l a s s i f i -cation.
The volumes cover the following groups of products : pr i c o .
Tol. A : chapt. 1-24 Agricultural products £ 6,60 DK 9 3 , 9 0 USS 14,5o Fb 600 Tol. B : chapt. 25-27 Mineral products £ l,2o DK 1 5 , 7 5 USS 2 , 9 0 Fb l o o Tol. C : chapt. 28-38 Chemical products £ 6,60 DK 9 3 , 9 o USS 1 4 , 5 o Fb 600 Tol. D ! chapt. 39-43 A r t i f i c i a l materials,
leather £ 3,lo DK 3 9 , 3 o USS 7 , 2 o Fb 250 Tol. E : chapt. 44-49 Wood, cork, paper . . . £ 3,lo DK 3 9 , 3 o USS 7 , 2 o Fb 25o Tol. F : chapt. 5o-67 Textiles, footwear . . . £ 8,60 DKllo,oo USS 2o,lo Fb 7oo Toi. G : chapt. 68-72 Stone, plaster, glass,
ceramics £ 3,lo DK 3 9 , 3 o USS 7 , 2 o Fb 250 T o i . H : c h a p t . 7 3 I r o n and s t e e l £ 3 , 9 o DK 5 4 , 8 0 USS 8 , 4 5 Fb 350 T o l . I ! c h a p t . 7 4 - 8 3 O t h e r b a s e m e t a l s £ 3 , l o DK 3 9 , 3 o USS 7 , 2 o Fb 250 T o l . J : c h a p t . 8 4 - 8 5 M a c h i n e r y , a p p l i a n c e s £ 1 1 , 0 0 DK 1 5 6 , 5 0 USS 2 4 , l o Fb l o o o T o i . K : c h a p t . 8 6 - 8 9 T r a n s p o r t equipment £ 1 , 9 5 DK 2 7 , 4 0 USS 4 , 2 o Fb 17o T o l . L : c h a p t . 9o-99 O p t i c a l p r e c i s i o n ,
i n s t r u m e n t s £ 5 , 0 0 DK 7 o , 4 5 USS l o , 9 o Fb 450 T o l . : c h a p t . C o u n t r i e s - p r o d u c t s £ 6 , 6 0 DK 9 3 , 9 o USS 1 4 , 5 o Fb 600
S p e c i a l e d i t i o n of t h e monthly e x t e r n ? ! t r a d e b u l l e t i n Annual e x t e r n a l t r a d e f i g u r e s l "l3 8 - ln7 5
P r i c e : £ 1,85
49 p a g e s Format A 4 Jjsj °]'^°
E/F bilingual edition published in June I076 Fb 15O This annual special issue of the monthly external trade bulletin provides annual figures for the period 1I">58-1°75 covering principally :
- general summary of European Community trade by country ^nd vy product;
- 26
SPECIAL PUBLICATIONS AND SERIES
Violet series : The Input - Output Tables 1970
Price
complete s e r i e s
£ 30,50
DK 393,50
US« 71,60
Fb ?500
:
per volume
£ 4,25
DK 5 5 ,
-USS 10,10
Fb 35O
Special 9-volume series, Format A 4to be published in August 1976 :
Volume I - Methodology I97O-I975 : approximately 36 pages French
This publication describes the methodology used by EUROSTAT to draw up the input-output tables produced from 1970 onwards according to Community standards. A general description of the input-output ta.bles is given, noting the principal concepts defined in the European System of Integrated Economic Accounts (ESA).
The different types of tables published by EUROSTAT are illustrated : annual tables, more detailed five-yeaiy tables, annual summary tables at constant prices.
In addition, the three main components of an input-output table (intermediate consumption, final uses, primary inputs) are described in detail in the various possible evaluations
(approximate factor prices, producers' prices, purchasers' prices) and relations of identity between these various components a.re given. Numerous references are made to ESA definitions.
A final chapter summarizes, using a simple mathematical formulation, the principal relationships expressing the Valances between the figures in the various tables. After some additional assumptions have been made, the way in which the information in the tables may be used in economic models is demonstrated. Thus, for example, direct a_nd indirect input or import requirements induced by a given final demand, can be estimated. An example is also given of an application to the study of the effects of variations in price and costs of primary inputs on domestic prices.
27
-Violet series : Some Figures : Public expenditure on Research and Development in the Community countries, 1974-1975
Price : gratis
37 pages Format A 5
F / E / D editions published in July 1976
This booklet contains the most important data on the money allocated to R and D in the budgets of member states. The breakdown by the objectives of the research is made on the basis of the Nomenclature for the analysis and the comparison of scientific programmes, and budgets (NABS). Some charts show the trends since 1970, and give a comparison with the U.S.A.
Yellow series : Survey of the- structure and distribution of earnings in industry in 1972
complete
£ DK Fb 4.' US S
Pr:
series
49,50 W , 2 5 500 L08,50
Special series in 10 volumes
Published : Volume 1
Volume 2 A 2 Β
Volume 3 A 3 Β
Volume 4 A Β
Volume 5 A Β Methods Luxembourg Luxembourg France France Belgium Belgium Netherlands Netherlands ce per vc £ DK Fb US S 308 pages 367 pages 392 pages 792 pages 816 pages 485 pages 805 oages 517 pages 685 pages ■ lume 5,50 78,30 500 12,10
To be published in August !
Volume 6 A Germany approx. 900 pages Β Germany approx. 860 pages
This survey was carried out simultaneously and using the same methods in the six founder Member States of the Common Market.
28
qualifications, length of service, etc.) and structural characteristics (employment sector, size and geographical
location of the firm or the enterprise) and to show the correlation between employment structures and the scale of earnings.
The results have been published in the form of two separate volumes for each country containing the following :
Volume A : Analysis of general results followed by a résumé of these results in the form of a statistical annex. Volume Β : Detailed statistical tables covering each of the
71 headings of the NACE (General industrial classi fication of economic activities within the European Communities) used in the breakdown of the results. Before publication of the results for each country a methodological volume was issued.
Green series : Agricultural price sVtisticr 196°197'3
Price : £ 5, Approximately I80 pages Format A 4 DK 63, Multilingual edition Í ?S „li'5 0
Fb 400 To be published in September I976
This publication, biennial from now on, replaces the annual editions covering prices and price indices in the former series "Agricultural Statistics".
It gives annual averages of prices of the principal products sold and bought by farmers, the monthly trends of which are published in the statistical bulletins "Selling prices of agricultural products" and "Agricultural purchase prices".
The information covers the nine countries of the Community for the period 1969I975.
29
-EUROSTAT PERIODICALS
Orange series : Monthly bulletin of general statistics
price
subscription : £
DK US Fb180 DIN A 4 pages
15 197
S 36
I.25O
monthly
individual issue : £
DKUS $
Fb1,85
23,50
4,25
ISO £ DKUS S
Fb3,75
47,25
8,75
300Principal data on the short-term economic development of the
European Community in the following sectors : employment, industry,
external trade, services, wages and salaries, finance and balance
of payments.
Yellow series : Statistics of labour costs and hours of work
subscription : £ 5,50 individual issue
DK 71
US s 12,90
Fb 450
23O DUî A 4 pages 6-monthly
Harmonized data on workers' hourly wages and weekly hours worked,
plus indices of developments in employees' monthly salaries. These
data are broken down according to NACE, and, for certain countries,
by region.
Green series : Crop production
subscription : £ 21,50 individual issue
DK 275,50
US $ 50
Fb I.75O
+ 100 DIN A 4 pages 10-12 issues per year
The most recent information on
1) Crop production of arable land (area, yield, production)
Fruit and vegetable production ( " " " )
2)
Areas sown (twice a year)
3) Stocks and deliveries of cereals and potatoes
4) Meteorological report
5) Supply balances for crop products (3 or 4 per year)
Monthly statistics on the production of meat
subscription : £ 24,50 individual issue
DK 314,50
US 5 57,50
Fb 2.000
100 DUI A 4 pages 10-12 issues per year
Information on slaughterings, on foreign trade in live animals,
on production by species and by country. In addition, it may
also give information on head structure , comments (red pages) and
information about supply balances.
.30
-Monthly sta.tistics on the production of milk and milk products
subscription £ DK
us s
Fb
17 2 2 0 , 5 0
40 1.400
i n d i v i d u a l i s s u e : £ DK US S Fb
2 , 2 5 2 8 , 5 0 5 , 2 5 I8O
£ DK US $
Fb
17 2 2 0 , 5 0
40 I.4OO
i n d i v i d u a l i s s u e : £ DK US z
Fb
2 , 2 5 2 8 , 5 0 5 , ^ 5 180
66 DIN A 4 pa.ges 10 issues per year
Weekly data of butter and milkpowder production.
Monthly data relating to cowsmilk collected and production of processed products by the dairy industry. From time to time the bulletin may contain a commentary on the Bupply balance sheets and information on dairy structure.
Monthly sta.tistics on the production of eggs for incubation and chicks
subscription 70 DIN A4 p. 10 iss./year
Data on the commercialisation of hatching eggs and farmyard chicks, on the selection, multiplica.tion and the uses by species as well as trade with third countries. In addition the bulletin may contain data on structure of hatcheries, commentaries (pink pages) and information on supply balance sheets.
Selling prices of agricultura! products subscription
I53 DIN A4 p. 10 iss./year
Up-dated monthly and annua-1 prices for the main crop and livestock products as well as for certain products by the food industry. The prices of 75 products, for EUE-9, are given in national currencies and in Eur. Percentage variations on the previous month and on the sa.me period of the year before are also given. The monthly development in Eur is set out in graph form for almost every product.
Purchasing prices of the agriculture
subscription : £ 8,75 individual issue DK 110
US $ 20
Fb 700 Fb ?40 121 DIN A 4 pages quarterly
Up-dated monthly and annual figures for the principal products bought by farmers. The series for EUR-9 cover animal feed, fertilizers, transport and heating fuels, seeds and pesticides.
£ DK US S Fb
2 4 , 5 0 3 1 4 , 5 0 5 7 , 5 0 2 . 0 0 0
i n d i v i d u a l i s s u e : £ DK US S Fb
3 , 2 5 41
7 , 5 0 260
£ DK US s
3 3 7 , 7 5
- 31
Blue series
Ruby series
Red series
Quarterly bulletin of industrial production
subscription : £ 7,25 individual issue : £ 2,50 DK 94,50 DK 31,50 US $ 17 US 3 5,75 Fb 600 Fb 200 146 DIN A 4 pages quarterly
Annual and quarterly indices of industrial production in the countries of the Community and certain third countries.
Data on production within the Community of certain raw materials and finished or semi-finished products.
Quarterly bulletin of iron and steel statistics subs
304 i c r i p t :
DIN A ion
4 page £ DK US S Fb
1 8 , 236
43 I . 5 0 0 s q u a r t e r l y
25 i n d i v i d u a l i s s u e : £ DK US Fb S
6, , ' 5 7 8 , 7 5 14, 500 ,50
Annual, quarterly and monthly statistics on production, new orders, inward and outward stock movements and external trade in iron and manganese ore, cast iron, raw steel and rolled steel products, on the consumption of raw materials in the iron and steel industry and inward and outward movements in the stocks of dealers in iron and steel products and scrap, and on workers employed, hours worked, wages and salaries in the iron and steel industry and iron mines. Quarterly bulletin of energy statistics
subscription : £ 11 individual issue £ DK
us
s
Fb 142 26 9OO £ DK US $ Fb 3,75 4 7 , 2 5 8 , 7 5 300 150 DIN A 4 pages quarterly
Quarterly data on the overall energy balance sheet covering the major locations supplying energy to the Community and to each Member State, plus data on the quarterly balance sheet and principal monthly series available for each energy source. The most recent annual data are updated both for the balance sheets and the various series supplied. Monthly external trade bulletin
subscription £ DK US $ Fb
1 6 , 5 0 213
39 I.35O
i n d i v i d u a l i s s u e : £ DK US « Fb
1,85 2 3 , 5 0 4 , 2 5 ISO + 100 DIN A 4 pages monthly
General summary of external trade of the European Community by countries and by products.
Trends in EC trade by countries and by products. Indices.
32
Trade flows
subscription : £ 18,25
DK 236
US S 43
Fb 1.500
+ 30 DIN A 4 pages bi-monthly
individual issue : £
DK
US 3
Fb
4
52
9,50
330
Analysis of the external trade and related statistics of trading
partners of the Community, particularly state-trading countries
Crimson series : Monthly tables of transport statistics
subscription : £ 7,25 individual issue
DK 94,50
US
%
17
Fb 600 Fb 70
20 DIN A 4 pages monthly
Monthly data on the carriage of goods and travellers, registration
of motor vehicles, traffic accidents, etc. Publication on completion
of the principal tables to appear in Annual Statistics of Transport
and Communication, Tourism.
£
DK
US %0,85s
11
STATISTICAL OFFICE OF THE EUROPEAN COMMUNITIES
Director-General
Assistant to Director-General
J. MAYER
E. HENTGEN
Directors:
Statistical methods - Processing of information
General statistics and national accounts
Population and social statistics
Agriculture, forestry and fishery statistics
Energy, industry and handicrafts statistics
Trade, transport and services statistics
KONTORET FOR DE EUROPÆISKE FÆLLESSKABERS OFFICIELLE PUBLIKATIONER AMT FÜR AMTLICHE VERÖFFENTLICHUNGEN DER EUROPÄISCHEN GEMEINSCHAFTEN OFFICE FOR OFFICIAL PUBLICATIONS OF THE EUROPEAN COMMUNITIES
OFFICE DES PUBLICATIONS OFFICIELLES DES COMMUNAUTÉS EUROPÉENNES UFFICIO DELLE PUBBLICAZIONI UFFICIALI DELLE COMUNITÀ EUROPEE BUREAU VOOR OFFICIËLE PUBLIKATIES DER EUROPESE GEMEENSCHAPPEN Boite postale 100S - Luxembourg