i
“ I hereby declare that I have read through this report entitle “Study Of The Impact Routine Adjustment And Static Factor For Commercial Buildings” and found that it has comply the partial fulfillment for awarding the degree of Bachelor of Electrical Engineering (Industrial Power)
Signature :………
Supervisor’s Name : MR. MOHAMAD FANI BIN SULAIMA
ii
STUDY OF THE IMPACT ROUTINE ADJUSTMENT AND STATIC FACTOR FOR COMMERCIAL BUILDINGS
MOHD REDZWAN BIN MAHAT
A thesis submitted in fulfillment of the requiremens for the degree of Bachelor of Electrical Engineering (Industrial Power)
Faculty of Electrical Engineering
UNIVERSITI TEKNIKAL MALAYSIA MELAKA
iii
I declare that this report entitle “Study Of The Impact Routine Adjustment And Static Factor For Commercial Buildings” is the result of my own research except as cited in the references. The report has not been accepted for any degree and is not concurrently submitted in candidature of any other degree.
Signature :………..
Name : MOHD REDZWAN BIN MAHAT
ACKNOWLEDGEMENT
iv
ABSTRACT
v
ABSTRAK
vi
TABLE OF CONTENT
CHAPTER TITLE PAGE
ABSTRACT iv
ABSTRAK v
TABLE OF CONTENT vi
LIST OF TABLE ix
LIST OF FIGURE x
LIST OF APPENDICES xi
1 INTRODUCTION 1
1.1 Motivation 1
1.2 Problem Statement 4
1.3 Objective 5
1.4 Scope 5
2 LITERATURE REVIEW 6
2.1 Introduction 6
2.2 Related Theory 6
2.2.1 Concept of Energy 6
vii
2.2.3 Energy Management and Energy Audit 9 2.2.4 Energy Saving for commercial buildings 11
2.2.5 International Performances Measurement and
Verification IPMVP 12
2.2.6 Energy Services Companies (ESCO) 13
2.2.7 Energy Performance Contract (EPC) 14
2.2.8 Self-Organizing Map (SOM) 15
2.3 Related Previous Works for Commercial Building
Energy Avoided Measurement & Verification 15
2.5 Summary 18
3 METHODOLOGY 20
3.1 Overview 20
3.2 Flowchart 20
3.2.1 Building Profile 22
3.2.2 IPMVP Framework of Calculating
Energy Saving 23
3.2.3 Routine Adjustment Data 23 3.2.4 Modelling Regression Analysis 25
3.2.5 Self-Organizing Map (SOM) 26
3.2.6 Identifying Error and Uncertainty in
Measurement 27
viii
3.2.8 Auditing process and M&V activities 29 3.2.9 Identifying Static Factor and Non-Routine
Adjustment 30
3.2.10 Energy Cost Avoidance 30
3.3 Summary of the chapter 31
4 RESULT AND DISCUSSION 32
4.1 Introduction 32
4.2 Routine Adjustment Data 32
4.2.1 Independent Variables 32
4.2.2 Dependent Variables 36
4.3 Correlation Analysis 38
4.3.1 Single Linear Regression Analysis 38 4.3.2 Multiple Linear Regression Analysis 54 4.4 Self-Organizing Map
4.4.1 Block A 58
4.4.2 Block B
4.4.3 Selecting the Best Features among the
Normalization Method 77
4.4.3.1 Block A 77
4.4.3.2 Block B 78
4.6 Reporting Uncertainty 79
4.6.1 Reporting Period and Energy Saving for Block A 79 4.6.1.1 Statistic of Mathematical Equation
For Block A 81 4.6.2 Reporting Period and Energy Savings for Block B 82 4.6.2.1 Statistic of Mathematical Equation
For Block B 84 5 CONCLUSION AND RECOMMENDATION 86
5.0 Conclusion and Recommendation 86
ix
LIST OF TABLE
TABLE TITLE PAGE
4.1 Energy consumption for Block A 36
4.2 Energy consumption for block B 37
4.3 Statistical analysis for energy use vs number of working days
for Block A 39
4.4 Statistical analysis for Energy use vs CDD for block A 41 4.5 Statistical analysis relationship between numbers of students and
energy consumption for block A 43
4.6 Statistical analysis relationship between numbers of class and
Energy use for block A 45
4.7 Statistical analysis relationship between numbers of working days and
Energy used for block B 47
4.8 Statistical Analysis between CDD and energy consumption
Multiple regression table for block B 49 4.9 Statistical analysis relationship between numbers of students and
Energy use for block B 51
4.10 Statistical analysis relationship between numbers of class and
Energy use for block B 53
4.11 Multiple regression table for block A 54
4.12 Statistical analysis of multiple linear regression analysis for block A 55
4.13 Multiple regression table for block B 56
4.14 Statistical analysis of multiple linear regression analysis for block B 57 4.15 Result from MATLAB simulation using hexagonal topology and
‘log’ normalization method for block A 58
x
‘var’ normalization method for block A 60
4.17 Result from MATLAB simulation using hexagonal topology and
‘range’ normalization method for block A 62 4.18 Result from MATLAB simulation using hexagonal topology and
‘logistic’ normalization method for block A 65 4.19 Result from MATLAB simulation using hexagonal topology and
‘log’ normalization method for block B 68
4.20 Result from MATLAB simulation using hexagonal topology and
‘var’ normalization method for block B 70
4.21 Result from MATLAB simulation using hexagonal topology and
‘range’ normalization method for block B 72 4.22 Result from MATLAB simulation using hexagonal topology and
‘logistic’ normalization method for block B 75 4.23 Four normalization method result that has been selected through
Analysis for block A 77
4.24 Four normalization method result that has been selected through
Analysis for block B 78
xi
LIST OF FIGURE
FIGURE TITLE PAGE
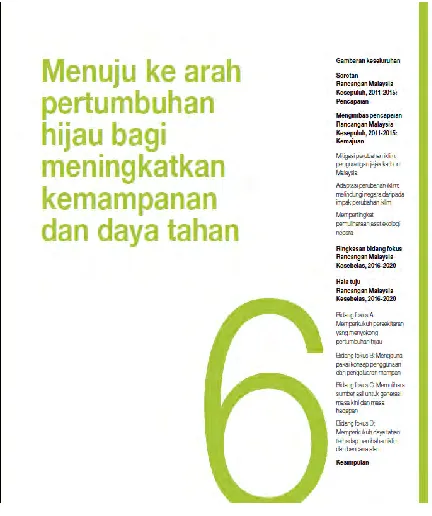
1.1 11th Malaysia’s Plan (Chapter 6) 2
1.2 Example of energy service companies 3
1.3 Energy Performance Contract concept 4
2.1 List of Energy 7
2.2 Example of renewable energy 8
2.3 Example of simple electric circuit 9
2.4 TNB electricity supply systems 9
3.1 Flowchart Diagram 20
3.2 Faculty of Manufacturing Buildings 20
3.3 t-table 26
4.1 CDD for one year 30
4.2 No. of working days 31
4.3 Number of students 35
4.4 Number of class for block A 35
4.5 Number of students for block B 36
4.6 Correlation analysis measure the relationship between energy
consumption and number of working days for block A 38 4.7 Correlation analysis measure the strength relationship between
energy consumption and CDD for block A 40 4.8 Correlation analysis measure the strength relationship between
Energy consumption and no. of students for block A 42 4.9 Correlation analysis measure the strength relationship between
Energy consumption and no. of class for block A 44 4.10 Correlation analysis measure the strength between number of
xii
CDD and energy consumption for block B 48
4.12 Correlation analysis measure the strength relationship between
Energy consumption and no. of students for block B 50 4.13 Correlation analysis measure the strength relationship between
Energy consumption and no. of class for block B 52
4.14 The U-matrix for 200 number of neurons 59
4.15 The U-matrix for 320 number of neurons 59
4.16 Result of U-matrix for 220 number of neurons 61 4.17 Result of U-matrix for 380 number of neurons 61 4.18 Result of U-matrix for 280 number of neurons 62 4.19 Result of U-matrix for 180 number of neurons 63 4.20 Result of U-matrix for 280 number of neurons 64 4.21 Result of U-matrix for 360 number of neurons 65 4.22 Result of U-matrix for 240 number of neurons 66 4.23 Result of U-matrix for 340 number of neurons 67 4.24 Result of U-matrix for 280 number of neurons 68 4.25 Result of U-matrix from the simulation for 180 number of
Neurons 69
4.26 Result of U-matrix from the simulation for 260 number of
Neurons 69
4.27 Result of U-matrix from the simulation for 240 number of
Neurons 71
4.28 Result of U-matrix from the simulation for 300 number of
Neurons 71
4.29 Result of U-matrix from the simulation for 160 number of
Neurons 72
4.30 Result of U-matrix from the simulation for 200 number of
Neurons 74
xiii
Neurons 74
4.32 Result of U-matrix from the simulation for 400 number of
Neurons 75
4.33 Result of U-matrix from the simulation for 200 number of
Neurons 76
4.34 Result of U-matrix from the simulation for 260 number of
Neurons 76
4.35 Result of U-matrix from the simulation for 280 number of
xiv
LIST OF APPENDICES
APPENDIX TITLE PAGE
1
Chapter 1
INTRODUCTION
1.1 MOTIVATION
Based on Suruhanjaya Tenaga (ST) final electricity consumption for commercial buildings in Malaysia has been increased 14% from year 2010 to 2013 [1]. This statistic has showed that people still less aware toward sustainable energy management in their daily life routine. Energy Conservation is the most common issue and everyday people try to invent new technology that can save energy and increase their efficiency. Currently, people still not alert about the efficiency of the appliance and they just bought it because they are cheap.
On 29th July 2009, Malaysia’s Prime Minister YAB Dato’ Sri Mohd Najib Tun Abdul
Razak has launched The National Green Technology Policy [2]. Energy, environment, economy and social was the four pillars in The National Green Policy [3] . The purpose of this policy is to search for the independence energy and promote the efficient of energy simultaneously. In order to implement this green policy projects and activities that related with the four pillars, there are a few goals that have been set in Malaysia Plan. The 10th Malaysia Plan in 2011 for
short term goal has stated that there are four of the most significant and the main improvement toward the National Green Technology Policy that is energy sector, buildings sector, water and waste sector and transportation sector [4]. In energy sector there are two parts which are energy supply sector and energy utilization sector. The energy utilization sector is the application of Green Technology by the industrial and commercial buildings while the energy supply sector is the management aspect including co-generation.. For the mid-term goal of this policy has been stated in the 11th Malaysia Plan in 2015 that is Green Technology become the preferred choice
2
[image:18.612.202.418.153.411.2]Technology products production and enhancement application of Green Technology in economy sector.
Figure 1.1: 11th Malaysia Plan (Chapter 6)
3
Figure 1.2: Example of Energy Service Companies
4
Figure 1.3: Energy Performance Contract (EPC) concept
1.2 PROBLEM STATEMENT
Generally, ESCO will provide EPC to owner facility in order to conduct energy saving project and this contract are made between these two parties. In fact, ESCO will promise a guarantee to the owner the amount of energy avoidance at some defined pricing level but at the end of the contract, the energy saving that being achieved is less than promises or not sustain. Other than that, ESCO also request to the owner to renegotiate the contract to extend the length of time needed to achieve the saving. Delayed to resolve technical problems and bad project management are the factor that make ESCO may needed more time to complete the project. Furthermore, building owner did not have independent verifier to verify the M&V plan that being execute by ESCO. ESCO did not follow the international guideline, International Performance and Verification Protocol (IPMVP) such as the M&V plan that being perform is not clearly state in which option IPMVP and method to be used to determine the energy saving. In spite of that, weak in M&V plan may result low level of confident level of the saving reporting the end of the project. In order to resolve this problem, a few objectives have been stated to execute this Final Year Project. These three objectives have been presented in next sub-topic accordingly.
1.3 OBJECTIVE
The objectives of this project are to;
a) Model the best regression method for Correlation Identifying
b) To analyze the impact of independent variables by using Self-Organizing Map (SOM) toward energy saving.
5
1.4 SCOPE
6
Chapter 2
LITERATURE REVIEW
2.1 Introduction
Nowadays, the population growth in Malaysia has been increased every year and statistic showed that there are 30.4 million people in 2014 [8]. This will affect the energy utilization in Malaysia that will increase the generation of the energy supply. Statistic from Suruhanjaya Tenaga also shows that people are still in less awareness toward energy management in their daily life. From this statistic, the government should take an action to create more awareness program for the Malaysian’ in order to achieve the National Green Technology Policy. Due to rapid development in Malaysia, there are many buildings, industrial factory and residential has been constructed. In spite of that, the hypothesis for this situation is the more buildings, factory and etc. being constructed; the number of energy supply will be increased. Therefore, to identify the reduction of the energy consumption and energy wasted, M&V plan and audit are the solutions to find real energy saving potential in commercial buildings. In this chapter, the basic theory of the study and previous work done will be discussed accordingly.
2.2 Related Theory
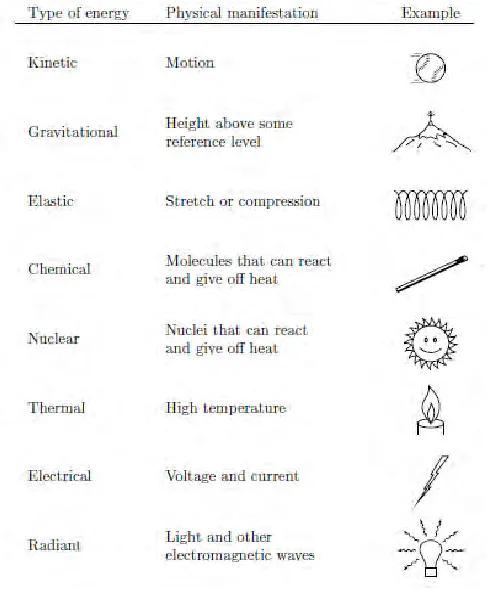
2.2.1 Concept of Energy
7
[image:23.612.192.436.215.510.2]expressed in different units. Other than that, energy cannot be created or being destroyed but it can be converted from one form to another form that known as energy conversion such as radiation to electrical energy in solar [10]. In fact, energy conversion is important for energy utilization by the society for agriculture, industrial and residential usage. It show that energy is important in daily of society in order to undergo all their routine activities as usual.
Figure 2.1 : list of energy
8
[image:24.612.89.541.73.295.2]
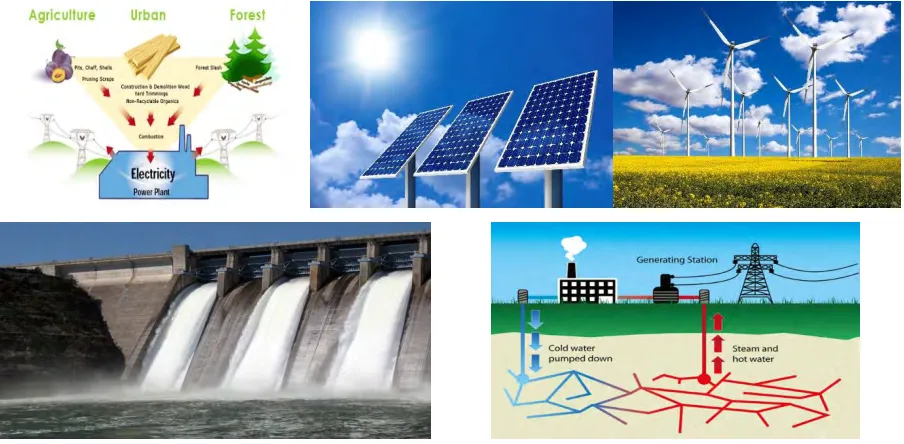
Figure 2.2 : example of renewable energy
2.2.2 Electrical Energy