RIT Scholar Works
Theses
Thesis/Dissertation Collections
12-5-2017
Comparative study on cushion performance
between 3D Printed Kelvin structure and 3D
Printed Lattice structure
Lakshmi Priyadarshini
Follow this and additional works at:
https://scholarworks.rit.edu/theses
This Thesis is brought to you for free and open access by the Thesis/Dissertation Collections at RIT Scholar Works. It has been accepted for inclusion in Theses by an authorized administrator of RIT Scholar Works. For more information, please [email protected].
Recommended Citation
I
R.I.T
Comparative study on cushion performance between 3D Printed Kelvin
structure and 3D Printed Lattice structure
By
Lakshmi Priyadarshini
A Thesis submitted in Partial fulfilment of the Requirements for the Degree of
Master of Science
In
Packaging Science
Department of Packaging Science
College of Applied Science and Technology
Rochester Institute of Technology
Rochester, NY
II
Committee Approval:
Dr. Changfeng Ge
Thesis Advisor
Dr. Thomas Kausch
Committee Member
Prof. Alexis Rich
Committee Member
III
Acknowledgements
I would first like to thank my thesis advisor Prof. Changfeng Ge. The door to Prof. Ge’s office
was always open whenever I ran into a trouble spot or had a question about my research or writing.
He consistently allowed this paper to be my own work, but steered me in the right the direction
whenever he thought I needed it. I would also like to take this opportunity to thank my committee
members Professor Deanna Jacobs and Professor Thomas Kausch for their encouragement and
support through all these years in masters programs. My special thanks to Alexis Rich, for agreeing
to be a part of this project in such a short notice. I would also like to thank Professor Denis Cormier
of the Industrial and Systems Engineering department for giving me the green signal required for
using the Earl W. Brinkman laboratory and services and being very supportive in all my
experiments. He has indeed played a pivotal role in getting this work of mine through. Chaitanya
Mahajan, who is also a part of the lab and is a student of the Industrial and Systems Engineering,
gave me some of the initial lessons and hands-on training of how to use the 3D printer and in a lot
of ways laid the foundation of the work. I take this opportunity to thank him as well. I would also
like to thank Jonathan Tuber, student in Packaging Science department for proactively giving his
valid inputs in the matter of design of Kelvin model. I would also like to thank the American
Packaging Corporation Laboratory and its staff for allowing me access to their machines and
provide the necessary training and support.
Finally, I must express my very profound gratitude to my parents and family for providing me with
unfailing support and continuous encouragement throughout my years of study and through the
process of researching and writing this thesis. This accomplishment would not have been possible
IV
Abstract
Frequently transported packaging goods are more prone to damage due to impact, jolting
or vibration in transit. Fragile goods, for example, glass, ceramics, porcelain are susceptible to
mechanical stresses. Hence ancillary materials like cushions play an important role when utilized
within package. In this work, an analytical model of a 3D cellular structure is established based on
Kelvin model and lattice structure. The research will provide a comparative study between the 3D
printed Kelvin unit structure and 3D printed lattice structure. The comparative investigation is
based on parameters defining cushion performance such as cushion creep, indentation, and cushion
curve analysis. The applications of 3D printing is in rapid prototyping where the study will provide
information of which model delivers better form of energy absorption. 3D printed foam will be
shown as a cost-effective approach as prototype. The research also investigates about the selection
of material for 3D printing process. As cushion development demands flexible material,
three-dimensional printing with material having elastomeric properties is required. Further, the concept
of cushion design is based on Kelvin model structure and lattice structure. The analytical solution
provides the cushion curve analysis with respect to the results observed when load is applied over
V
Table of Contents
Title Page ……… I
Committee Approval ………..II
Acknowledgements ………...III
Abstract ……….IV
Table of Contents ………...V
List of Tables ………VI
List of Figures ……….VII
2.
Introduction ...1
2.1.1.
Background ….……...2
2.1.2.
Review of Past Studies………...2
2.1.3.
Significance of the study ...3
2.1.4 Purpose Statement ...4
3.
Central phenomenon ...5
3.1.1.
Definition of Key terms ...7
4.
Research Questions ...8
5.
Literature Review ...8
5.1.1.
Fused Deposition Modelling ……….………….……….9
5.1.2.
Kelvin Structure ………...……….….…...10
5.1.3.
Lattice structure ...15
6.
Methodology ...18
6.1.1.
Research Design ...18
VI
6.1.3.
Participants ...18
6.1.4.
Measuring Instruments ...19
6.1.5.
Fila Flex ...…..………..……….22
6.1.6.
NinjaFlex® TPU………23
6.1.7.
3D Printing Procedure...24
6.1.8.
Limitations...25
7.
Data Analysis………...…...25
7.1.1.
Compression Test on Lattice Structure……….……….26
7.1.2.
Compression Test on Kelvin Structure ………...………..……27
7.1.3.
Characterization of Cushion Factor………...…………31
8.
Results & Discussion …………...33
8.1.1.
Stress – strain behavior in Lattice Structure………..33
8.1.2.
Stress – strain behavior in Kelvin Structure………..…………..….….35
8.1.3.
Comparative Analysis……….………..37
9.
Conclusion…………...40
10.
Reference………...43
VII
List of Tables
Table
Description
Page
1.
3D Printed Kelvin unit cell physical properties
14
2.
The Makerbot replicator 2× 3D printer settings
21
3
Foam thickness before and after compression testing
30
4.1
Physical properties of NinjaFlex®, Kelvin unit cells, and cubic foam
30
4.2
Volumetric properties of NinjaFlex®, Kelvin unit cells, and cubic foam
31
5
Average C Factor per cycle
38
6.1
Compressive stress – strain analysis for Lattice structure
46
6.2
Compressive stress – strain analysis for Specimen I - Kelvin
48
6.3
Compressive stress – strain analysis for Specimen II
88
6.4
Compressive stress – strain analysis for Specimen III
128
VIII
List of Figures
Figure
Description
Page
1.1
Kelvin cell 2% edge cut structure
10
1.2
Kelvin cell 50% edge cut structure
10
1.3
Kelvin unit structure
11
1.4
Kelvin solid structure
11
2
Kelvin's 1887 model after rendering
13
3.1
Lattice Structure
15
3.2
Body Centred Cubic Structure
16
3.3
Lattice Structure with sandwich panels
16
3.4
Breakdown of unit cell in Lattice structure
17
3.5
3D Printed NinjaFlex® lattice structure
17
4.1
The MakerBot replicator 2× 3D printer
19
4.2
Cushion Foam cell structure
20
5
Types of infill patterns seen in 3D MakerBot printer
21
6.1
Fila flex flexible 3D printing filament
22
6.2
3D printed Fila Flex Kelvin model
23
6.3
NinjaFlex® Flexible 3D Printing Filament
23
7.1
Compressive Strain 0-63.33% on Lattice structure with sandwich panels
26
7.2
Sandwich panel deformation under compressive strain 20% - 40%
26
7.3
Compressive Strain 0 – 63% on Lattice structure without sandwich panel
27
8.1
Cellular deformation behavior during cyclic compression – Kelvin
28
8.2
Buckling effect observed under 50% compression stress
29
9
Simulated buckling modes of an anisotropic Kelvin Foam
29
10
Methods to develop cushion factor curves
32
11.1
Original cyclic stress
‐
strain curves up to 63.33% strain – Lattice Structure
34
In general cushions are used to fill the gap between the physical integrity of any product
or package and hazard levels of its distribution system. They tend to absorb energy by deflecting
under force of impact caused during transportation and withstand the dynamic oscillation
generated.
Many forms of cushions are used as a protective material and one of the commonly
available cushioning material includes loose – fill or dunnage varieties as polystyrene peanuts,
shredded or crumpled paper, which are manufactured by paperboard, artboards and other similar
materials, all modelled to fill the void surrounding of the product. They are used to prevent
abrasion to the surfaces of the product by separating it from any contact caused by the walls of
shipping container. Though being economical, their performance may also depend on the ambient
moisture conditions while distribution. (Goodwin & Young, 2011)
Cushioning materials are used to protect the products. The most commonly used method
of designing this structure is by analyzing the dynamic cushion curve. This curve represents the
maximum – static stress curve method, which shows how a packaging material of a given thickness
behaves at different impact loading (Gao & Lu, 2013). However, this analysis is done through
obtaining abundant experiments that would consume time and expenditure. In practical examples
of cushion packaging, polymeric foams are productively utilized to protect products against drop
loading and shock. ‘In order to overcome this drawback, constitutive relationships have been
carried out for expanded polypropylene, expanded polystyrene, and expanded polyurethane
considering several factors such as density, strain rate, and environmental temperature.’ (Zhang,
2
On the other hand, 3DP foam is constructed by three-dimensional printing process. 3D
printing is a form of additive manufacturing. Additive manufacturing starts with nothing and builds
up parts by laying up material on some sort of build platform. The manufacturing of 3D printed
foam is done by additive manufacturing process. Here prototyping of the “real object is created
from a computer aided design which is converted into a standard tessellation language (. STL) file
to successfully build an object layer upon layer” (Walsh & Sean, 2015). Keeping in mind that
elastomeric property is required for foam manufacturing, the pool of material used in 3D printing
are fila flex, ninja flex, and photopolymers. These filaments are made from polymeric materials
that flexes and stretches after extrusion process done by 3D printing.
2.1.1. Background
Before entering the market, customers demand prototype of cushioning materials which
are to be used for packaging purposes. Manufacturing of commercial cushioning material like
Polyurethane for prototyping purposes are generally termed to be costly. On the other hand, 3D
printing provides solution of creating elastomeric models as a rapid prototype, and this way the
3D printed cushion can be a cost-effective solution. The research study relates in providing
comparative analysis of cushion performance between the 3D printed Kelvin structure and lattice
structure. With the help of this comparative study, varied alternatives can be obtained that are
helpful for selecting the type of structure that can implicate energy absorption and provide better
cushion performance. Both the structures can be useful in rapid prototyping.
2.1.2. Review of Past Studies
Past studies show that analytical model of a 3D re-entrant honeycomb auxetic cellular
3
2015). These structures are used in various applications such as sandwich panel cores, energy
sound dampening structures, random frames, aerospace filler foams, and bio-implants. (Scarpa &
Smith, 2004). However, simulations with full scale 3D cellular models expensive, which make
them inefficient for creating analytical models. In addition to this, there has generally been a lack
of agreement between these experimental results and the theory, which was largely caused by
stochastic nature of auxetic foams used in testing. (Alderson, Rasburn, & Evans, 2007)
When materials are compressed or stretched along a particular axis they are observed to
expand in directions orthogonal to the applied load or stress. The property is called as the
Poisson’s ratio, which is also defined as the ratio between the negative transverse and
longitudinal strains (Bertoldi, Reis, Willshaw, & Mullin, 2009). Studies have also shown that
auxetic foam structures are described as a property of widening when stretched with a negative
Poisson’s ratio behavior that in contrast to the situation with materials that tend to narrow while
being stretched. (Alderson, Rasburn, & Evans, 2007) Hence with selection of material for 3D
printed foam it is to be seen that they tend to replicate the negative poisons ratio factor and widen
along the width of the foam when stress is applied.
Earlier the auxetic structures were also designed as 2D re-entrant auxetic honeycomb with
the help of large deflection beam theories, but it was observed that their analysis of cushion
performance could not applied to 3D geometries. (Yang, Harrysson, West, & Cormier, 2015)
Hence for complete analysis restructuring of 3D re-entrant with Timoshenko model is required,
which is not a cost-effective method for testing purposes. Hence these deficiencies are to be
considered for this study.
4
The study helps in providing a complete literature overview of how both the structures are
significantly different and still tend to impart the properties for cushion. The study will define the
properties of the material and how it is being affected with structural modifications. This way, it
also provides a substantial amount of evidence to use the 3D printed foam as a rapid prototype
instead of commercial foam. The research also identifies the varied alternatives provided by the
3D printed foam and theories of obtaining Negative Poisson’s ratio in 3D printed foams which
helps in broadening the horizon of cushion forms to sustain load and stress throughout the
structure. This factor becomes beneficial because the commercial cushions are restricted to load
bearing areas only, and that the stress applied can be sustained in those specific areas. Hence the
3D printed cushions provide a detailed study on the factors like creep, indentation, cushion
amplification, and attenuation as parameters defining the cushion performance.
2.1.4. Purpose Statement
The purpose of the study will be to compare the cushion performance of 3D printed Kelvin
structure with the lattice structure in terms of cushion curve, creep and indention. The dependent
variable in this study is Kelvin structure and its parameters affecting cushion performance. The
independent variables are the 3D printed cushion design fila flex material, ninja flex material, infill
density, MakerBot 3D printer, and Instron compression tester.
The conventional sample of 3D printed cushion design is based on Kelvin model structure.
The kelvin structure represents the foam structure with simulations of internal pore diameter, the
mean strut diameter, and the foam porosity. (Lucci, et al., 2014)
The control variables are the cushion curve, creep and indentation parameters that will
5
accessible in the form of cushion curves. These curves represent the ability of the cushion materials
to absorb shock or vibration inputs during distribution. (Goodwin & Young, 2011)
3. Central Phenomenon
The central theory being tested in this study is based on fused deposition modelling and
Negative Poisson’s ratio. Both the studies correlate with defining the manufacturing process and
cushion performance of 3D printed foam and commercial foam respectively.
Fused deposition modelling is one of the technologies of rapid prototyping. The rapid
prototyping process meets the need of the industry by helping them with shortening design cycles
and improving the design quality. Various parameters are used in FDM technology that can affect
the quality performance of the product. FDM generally is an additive manufacturing technique
which is commonly used for modeling or prototyping purposes. The technique is based on fusing
or laying down the materials in form of layers one above the other, the material can range from
plastic material to metal form where coils are provided.
This technology was developed by S. Scott Crump in the late 1980’s and was seen in
limelight in early 90’s. The technique is equivalent to fused filament fabrication (FFF) which was
invented by the members of RepRap. It is also termed as plastic jet printing (PJP). FDM begins
with a software process which practices a stereo lithography file format that mathematically slices
and orients the model for the building process. If required, support structures are also generated.
The machine tends to dispense multiple materials to achieve different objectives, for example one
may use one material to build up the model and use different colors for enhancing visual
6
The model or part is shaped by extruding small flattened strings of molten material to form
layers one above the other and as the material hardens immediately after extrusion from the nozzle
complete shape is developed. A plastic filament or metal wire is unwounded from the coil and
that tends to supply filament to the extrusion nozzle which. This nozzle depending on the machine
type can be operated manually by turning the flow on and off or automatically. There is typically
a worm-drive that pushes the filament into the nozzle at a controlled speed, which can also be
manipulated with respect to the demand of the product. The nozzle heated melts the material to its
glass transition temperature that eventually causes the deposition in form of layers. (Ram, 2014)
The nozzle is controlled with horizontal and vertical direction modes where the movement
is based on numerically controlled mechanism. The nozzle follows a tool – path which is provided
by the computer – aided manufacturing (CAM) software. The direction of building the model is
bottom up with one layer at a time. Stepper motors or servo motors are typically employed to move
the extrusion head. (Ram, 2014)
Although as a printing technology FDM is very flexible, it is also capable of dealing with
small projections by the support given by the lower layers while printing. On the other hand, FDM
has restrictions on the angle of the projections, and cannot produce unsupported stalactites.
The second theory tested is based on Negative Poisson’s ratio. Poisson’s ratio is the ratio
of the diagonal compressive strain to the strain caused by load applied longitudinally.
Alternatively, it can also be described as the principle of transverse element of the elastomeric
material. (Swallowe, 2013) Poisson’s ratio is also described as the fundamental property that
affects most aspects of the mechanical properties of materials including toughness, sound
7
enables the manipulation of Poisson’s ratio which can improve the stiffness of the auxetic
structure.
‘A simple example of Negative Poisson’s ratio is the cellular foam based on reentrant
honeycomb. On stretching the axial fibrils straighten to produce lateral expansion. Initially there
is expansion in both the axial and lateral directions as the fibrils are stretched, like the deformation
of the re-entrant structure. This is followed by rotation of the nodules with a particular
handedness.’ (Ward & Sweeney, 2005)
3.1.1. Definition of Key terms
Kelvin cell: It is the tetrakaidekahedron shaped cell which was proposed by Lord Kelvin.
It includes 14 faces with six quadrilaterals and eight hexagonal faces and 24 vertices.
Auxetic structure: These are models having negative Poisson’s ratio. When they are
stretched, they become thicker in the perpendicular direction to the applied load.
Creep: It is the loss in thickness of the foam after being subjected to a static load over a
period. It reflects the strain time response
Damping: The effect of energy from any shock or vibration caused with time or over
distance is called as damping. It is generally observed in transportation of goods.
Amplification: Cushioning materials generally tend to expand under application of load.
This act of expanding while causing the changes in cushion properties is called amplification
Attenuation: This term refers to the act of any damage caused to the cushion over a period.
For example, the cushioning materials tend to get dented while transportation or distribution.
8
4. Research Questions
The major research question come across started with can the Kelvin structure and Lattice structure
be replicated in a 3d printed cushion. If yes, how is the material affecting the cushion and printing
synthesis. The study will also determine the effects of printing process on 3DP cushion printed
through MakerBot Replicator 2X.
5. Literature Review
Material study is done to understand the cushion structure design and its implications. The
feasibility of printing the flexible material in 3D printed is also studied. The fila flex material
selected for 3D printed cushions tends to provide elastomeric properties. And with respect to the
commercial cushions of polyurethane, the 3D printed cushions are fragmented in form of flutes
seen in corrugated cushions. These flutes vary in both the deigns, Kelvin cell and lattice cell. The
pre-compressed corrugated cushions have soft cushioning characteristics similar to Polyurethane
and therefore they tend to exhibit small hysteresis under load. In constructing such cushions
structures, the compressive load applied to the material can damage the edges corrugated medium.
Initially during the damage, the overall damping capacity of the layered block is reduced, and they
tend to become stable only after subjected to additional loading stresses which can also be in form
of impacts. Experiments have been conducted showing predictable protective performance of this
material (Goodwin & Young, 2011). The cushion also delivers a means of decelerating impact
motion with the airflow escaping by means of the fluted sections seen in pre – compressed
9
structures the function of air pressure will build-up the flute geometry and the frictional restriction
of air flowing through the flutes. (Minett, Mervin, & Sek, 2002)
The strain recorded within pre-compressed structure affects the performance of cushion
when exposed to multiple impacts. For example, one of the studies shows that the cushions which
are pre-compressed at 95% tend to strain with an increase in peak acceleration by 20% after 35
impacts observed in distribution. When they are pre-compressed to 80% strain the level of peak
acceleration increased three times after several impacts. This study suggested that the optimal
static stress can be determined based on the number of expected impacts in any given distribution
environment. (Garcia, Sek, & Ballester, 2009). Hence once the 3D printed structure is fabricated
the cushion will be subjected to pre-compression procedure and peak acceleration will be
modulated.
5.1.1. Fused Deposition Modelling
Fused deposition modelling process is used to manufacture 3D printed foam. Common
materials used in (FDM) Fused Deposition Modeling are Acrylonitrile Butadiene Styrene plastic
and Poly lactic acid (PLA). Materials with elastomeric properties generally include
photopolymers, fila flex and ninja flex. The highest quality parts by ABS material are produced
by FDM technology which is also a common end-use engineering material that allows you to
perform multiple tests on similar parts. Filament based system are used here which tends to feed
the material into extrusion head and due to the heat supplied molten plastic is extruded that later
is hardened layer by layer to form a solid. Fila flex material is more elastic in nature and hence the
temperature provided for the extrusion process is modulated with respect to the requirement.
10
fabricated are to include enough heat, chemicals and moisture that will stability of the parts. On
the other hand, when thermoplastics like polyurethane materials are formed into shapes they tend
to be more stable and have no appreciable warpage, shrinkage, or moisture absorption. Also, part
accuracy doesn’t change with ambient conditions and time because thermoplastics are
environmentally stable (Novakova & Kuric, 2012). This enables FDM parts of thermoplastics to
be the most dimensionally accurate structure. Hence when replicating factors in 3D printed
cushion, the material fila flex needs to fulfill the characteristics of being environmentally stable
and cause no shrinkage or warpage. Also with fila flex studies show that grater tensile, impact and
flexural strength is observed which overall helps the FDM process by providing excellent bonding
of layers one above the other and further increasing the durability of cushion.
5.1.2. Kelvin Structure
In case of Kelvin model, the cell formation for the 3D printed cushion will be similar to
polyurethane open –cell cushion. The open-cell cavity of the foam is shaped to form a cellular
network that can be created by the foaming process. During the impact, the cushion is compressed
and air flows through the connected cellular structure, in and out of the cushion. The viscous nature
of this flow will provide resistance to the dynamic compression and determine the cushioning
ability of the material (Goodwin & Young, 2011).
Bottoming out will not be observed in cases where open foams are manufactured with
smaller cells. This observation is seen because of less air being exhausted from the material. The
amount of material can also be increased by designing smaller cells and makes it denser and thus
11
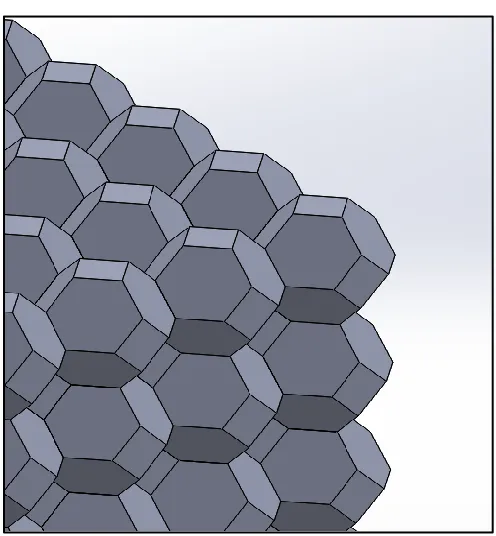
Before implementing on Kelvin structure for 3D print model various designs were studied
[image:20.612.181.468.209.451.2]and analysed on the basis of their volumetric and physical properties. To start with as shown in
Figure 1.1 Kelvin 2% cut structure were designed and % cushion and % air was calculated. Later
part the same was processed to Figure 1.2
[image:20.612.176.472.489.715.2]12
Figure 1.2: Kelvin Cell 50% edge cut structure
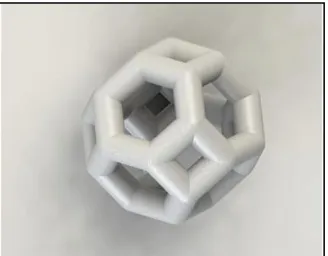
Figure 1.3: Kelvin unit structure
13
The Kelvin model structure for the 3D printed cushion defines the number of faces and
edges of the cushion. The model consists of a regularly stacked structure which includes 4 cells
parallel to the flow direction and 2 cells perpendicular to the flow direction. Struts are presumed
to be cylindrical in shape. A randomization is performed by randomly moving each node of the
regular structure to analyze the properties of open cell foams (Habisreuther, Djordjevic, &
Zarzalis, 2009). This randomization helps in understanding the uniformity and stability of the
design, so that when load in imparted on the cushion it is seen to it that the energy absorption
uniformly distributed.
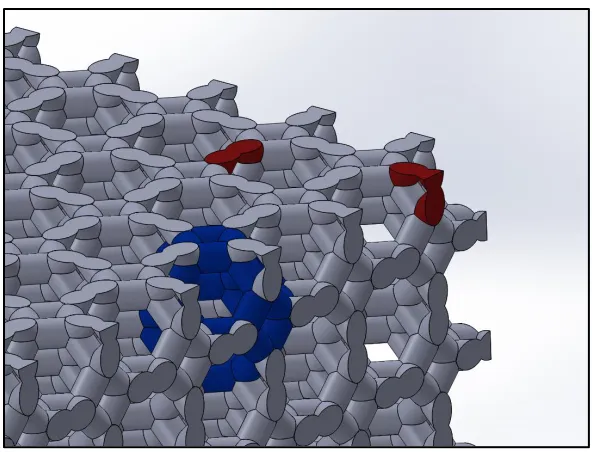
This study considers the classic Kelvin's cell, which has been 3D printed into a cubic foam
shape (Figure 2). The Kelvin model was proposed by Sir William Thomson in 1887 to describe
equal
‐
sized soap bubble foam. The Kelvin cell is a tetrakaidekahedral cell model whose faces
consist of 6 squares and 8 hexagons, where the edges of the square and hexagon faces have the
same length (Ge, Priydarshini, Cormier, Pan, & Tuber, 2017). The edges meet at tetrahedral
vertices, and the cell center is on a body
‐
centered cubic lattice (Figure 2). The Kelvin cell was
[image:22.612.243.407.320.448.2]14
the Kelvin structure has been established via mechanical models based on edge cross section and
foam density (L & Kyrlakides, 2005) Properties such as elastic constants, shear modulus, and
Poisson ratio are determined under different loading conditions. The nonlinear buckling behavior
of Kelvin foams under compressive stresses was also studied (Okumura , Okada, & Ohno, 2005).
However, little
‐
to
‐
no data are available to describe the Kelvin cell's energy absorption and
[image:23.612.184.447.292.720.2]resilience ability under cyclic loading.
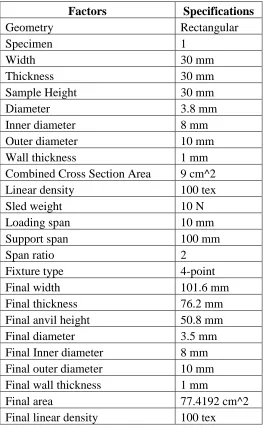
Table 1: 3D printed Kelvin Unit Cell Physical Properties
Factors
Specifications
Geometry
Rectangular
Specimen
1
Width
30 mm
Thickness
30 mm
Sample Height
30 mm
Diameter
3.8 mm
Inner diameter
8 mm
Outer diameter
10 mm
Wall thickness
1 mm
Combined Cross Section Area
9 cm^2
Linear density
100 tex
Sled weight
10 N
Loading span
10 mm
Support span
100 mm
Span ratio
2
Fixture type
4-point
Final width
101.6 mm
Final thickness
76.2 mm
Final anvil height
50.8 mm
Final diameter
3.5 mm
Final Inner diameter
8 mm
Final outer diameter
10 mm
Final wall thickness
1 mm
Final area
77.4192 cm^2
15
The Table 1 explains the distinctive factors of the NinjaFlex® kelvin unit cell printed
through the 3D MakerBot printer right before the compression tests are conducted.
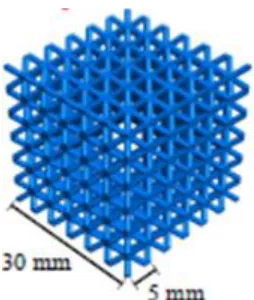
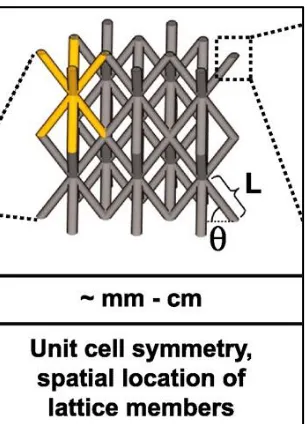
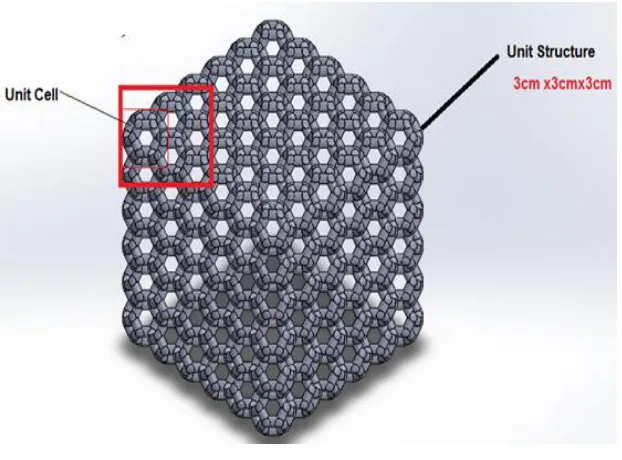
5.1.3. Lattice Structure
The choice of design for a cushioning material requires careful consideration of balance
between stiffness, flexibility, cost, durability, relative dynamic and static properties. Lattice
structures are multi-functional models that can provide a range of these required properties. The
unit scale is drafted keeping mesoscale unit in mind and further duplicating these cells to form a
unit structure. The strength if this structure depends on the relative density, strut aspect ratio
(radius/length), unit cell geometric configuration, unit-cell size, properties of parent material, and
[image:24.612.251.378.399.549.2]rate of loading (M, 2006)
Figure 3.1: Lattice Structure
Although lattices are different from the cellular conventional foam structures, certain
properties are carry forwarded from the cellular materials into these less known lattice structures,
especially when transient dynamic load conditions are applied. It is thus worth to briefly
16
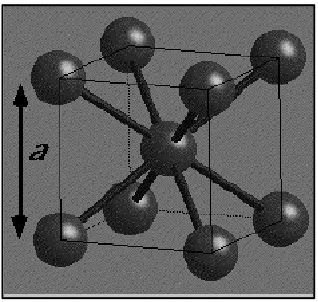
Figure 3.2: Body Centered Cubic Structure
The body centered unit cell shown in Figure 3.2 shows a unit cell form of the lattice
structure. Each cell is having the side length (a) of 5mm. This is being crafted to form a 30 x 30
x30 mm cubic lattice structure shown in Figure 3.1.
Before reaching on the conclusion of lattice structure model one of the alteration seen
included sandwich panels as top and base layer in the structure. This helped in the stability of the
sample.
[image:25.612.236.406.455.692.2]17
Figure 3.4: Breakdown of unit cell in Lattice Structure
(Schaeddler, et al., 2011)
The last theory was observed in (Novakova & Kuric, 2012) is regarding the photo-curing
process seen in FDM theory. This technique can also be divided into categories of single laser
beam, double laser beams and masked lamp. The initial form of the materials can either be solid,
liquid or in powder state. The basic material like PLA or ABS cures in about approximately six
seconds once extruded from the nozzle. On the other hand, studies do not denote the time taken
[image:26.612.249.403.97.309.2]for photo curing of fila flex material, hence the experimentation can provide varied results.
18
6. Methodology
6.1.1. Research Design
In quantitative research the aim is to determine the relationship between an independent
variable and dependent or outcome variable. They can either be descriptive subjects or can be
measured through experiments. This research study is based on experiments which provide the
relationship of variables and investigate the pros and cons of results affecting the cushion
performance.
The method of quantitative study applied in this research is started with the data collection
procedure and their numerical treatment which will provide the relevant relation to the research
problem. While data collection reporting of the unanticipated events like human error while
performing, the experiments needs to be done.
6.1.2. Strategy of Inquiry
Experimental research, often called true experimentation, is used in this study as the
scientific method to establish the relationship between the cushion designs and cushion
performance attained in 3D printing foam. It will also provide the comparative analyses between
the results of cushion curve obtained in experimentation with the commercial foam.
6.1.3. Participants
The participants observed in this research proposal are the commercial polyurethane foam,
3D printer, fila flex material, and 3D printed foam and Kelvin model design. The sampling of the
material is done based on the number of experimentations planned to be conducted. Generally
sample size is preferred large in quantitative data collection method so as to conduct meaningful
19
6.1.4. Measuring Instruments
The instruments selected for 3D printing is the D Scanning and Milling Roland Modella
Active Piezo Sensor Scan Resolution: 0.002 microns Maker Bot which is available at RIT institute
Brinkman Laboratory. (Brinkman manufacturing lab). The Milling Roland comes with powerful
applications that provide importing of CAD files and facilitating 3D scaling into the products. This
also helps in eliminating milling errors and reducing downtime.
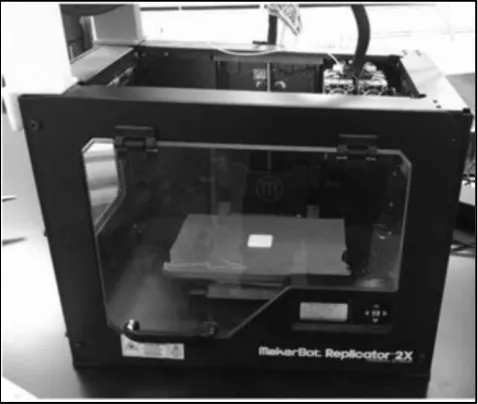
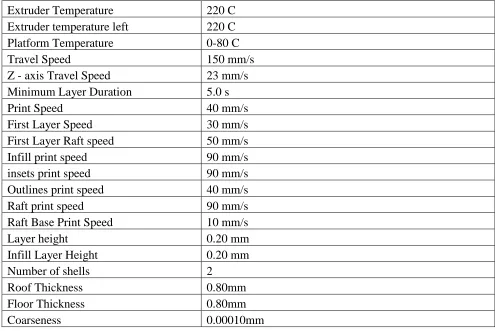
A MakerBot Replicator 2× (New York, USA) 3D printer was used to 3D print the Kelvin
foam structures (Figure 4.1). The structures were printed by using Ninjaflex® TPU material from
NinjaTek (Manheim, PA, USA). The printer specifications are listed in Table 2. Samples are
printed with outer dimensions of 30 x 30 x 30 mm. Each Kelvin unit cell consisted of hexagonal
and square faces having a strut length of 1.71 mm and a strut diameter of 1.2 mm. Each cubic foam
sample consists of a 6×6×6 array of unit cells, thus resulting in 216 Kelvin unit cells in all (Figure
[image:28.612.205.444.459.661.2]4.2) (Ge, Priydarshini, Cormier, Pan, & Tuber, 2017)
20
As illustrated in Table 2, 3 densities are used when defining the foam material: ρNinja ist
[image:29.612.170.481.154.384.2]the relative density of the Kelvin foam is defined as ρNinja/ρcube.
Figure 4.2: Cushion foam cell structure
The printer also is confined with the different infill densities and patterns. These patterns
are shown in Figure 5. The Hexagonal infill pattern is considered to be the strong and sturdy
without adding any weight to the structure. This helps with the study too considering maximum
air gap is preferred in the unit cell. Linear infill pattern include parallel straight lines, which tends
to be the aster amongst all for printing and with simpler toolpath. Diamond infill pattern is designed
to be strong and that can be printed quickly, but do increase the complexity of the tool path. Overall
liner pattern was implemented while printing considering factor of printability of complex
21
Figure 5: Types of infill patterns seen in 3D MakerBot printer
Table 2 explains the printer settings according to which the Ninjaflex® Kelvin
structures
[image:30.612.75.570.389.720.2]were drafted and printed.
Table 2: MakerBot replicator 2× 3D printer settings to print Kelvin model using Ninjaflex®
TPU
Extruder Temperature
220 C
Extruder temperature left
220 C
Platform Temperature
0-80 C
Travel Speed
150 mm/s
Z - axis Travel Speed
23 mm/s
Minimum Layer Duration
5.0 s
Print Speed
40 mm/s
First Layer Speed
30 mm/s
First Layer Raft speed
50 mm/s
Infill print speed
90 mm/s
insets print speed
90 mm/s
Outlines print speed
40 mm/s
Raft print speed
90 mm/s
Raft Base Print Speed
10 mm/s
Layer height
0.20 mm
Infill Layer Height
0.20 mm
Number of shells
2
Roof Thickness
0.80mm
Floor Thickness
0.80mm
22
The second instrument required for the study is the Creep behavior and Tensile Tester
(tensile): EN ISO 899-1 and (compression): EN ISO 899-2. This instrument helps in identifying
the cushion curve reporting the amplification and attenuation of the cushion behavior. This
eventually provides the data for comparative analysis. Maker Bot Replicator Desktop Software is
also used for the formation of G-code from the CAD design. The design is initially converted into
stereo lithography format which is later on changed into G code. The G code is nothing but the
numerical controlling programming language.
[image:31.612.205.401.347.518.2]6.1.5. Fila Flex
Figure 6.1: Fila Flex Flexible 3D printing filament
Initially Fila flex was selected to print the 3D printed foam considering the material
imparted most of the qualities of the commercial polyurethane foam. On printing with the fila flex
material, it was see that the design had many uniformities and hence could not be qualified for
23
Figure 6.2: 3D printed Fila Flex Kelvin model
6.1.6. Ninjaflex® TPU
Figure 6.3: NinjaFlex® Flexible 3D Printing Filament
The NinjaFlex® Flexible 3D Printing Filament (Figure 6.3) is made of thermoplastic
elastomer Material also referred as TPE. This is basically a patented technology which provides
great flexibility with low tack, easy to feed in printer texture. The results include its unique
properties of flexibility, strength in prints, and useful for direct drive extruders.
The key features include consistency in diameter and reliable material with high quality
printing over structures. The patented low friction exterior allows for smooth feeding into highly
[image:32.612.234.379.317.464.2]24
abrasion resistance, chemical resistance, the build platform and boding between the layers helps
the Kelvin unit to be printed easily. The shore hardness is 85A (Flexible, 2014)
6.1.7. 3D Printing procedure
The process of research methodology starts with selection of material. Selection of 3D
printing material for cushion out of Fila flex, ninja flex & photopolymer is done, the selection if
based on fabricating the kelvin model structure in form of cushion. The simulation of the transport
of methane CH4 in air is also seen while processing of fila flex material. A Sutherland model is
applied for these transport air properties and the thermal properties are removed. The catalyst
functions in a limited transport form so as to keep the temperature at the influx at about 700 K. No
conjugate heat transfer between the solid and the fluid is resolved and forced to form a solid–fluid
interface (Lucci, et al., 2014). The assumptions made can also verified by tests with conjugate heat
transfer and a multi-region solver, which will show the difference between the minimum and
maximum temperature in the model matrix.
Once the 3D model is created, a mesh is created to in grid form using Block mesh tool or
and Hexagonal mesh tool. The inflow plane is located above the cushion structure at about 1/2 the
average cell length (Lucci, et al., 2014). Further the outflow plane is placed below the cushion
model to minimize the effect of creep. The thickness of 3D printed foam will be 1inch printed in
form of cube. The polyurethane foam is also fragmented with similar dimensions. Once the
cushion is designed tests are conducted with respect to standard ISTA 3A.
The ISTA 3A signifies the capability of the package and product to withstand transport
hazards. These are done by conducting tests on cushions with respect to assigning load bearing
25
referred to be combustible, such that it tends to emit toxins during the process of decomposition,
and hence becomes overheated.
6.1.8. Limitations
The sample size is preferred to be large in quantitative research study. As the
experimentation results include similar values the larger sample size does not provide more
information. Hence number of the units of analysis in the study is dictated by investigation of
comparative analysis only.
The research topic has lack of prior analysis done and hence complete literature review
cannot be fulfilled. This eventually tends to low foundation for understanding the research problem
that is being investigated.
The 3D foam fabricated is restricted to a single design such as Kelvin model. This limits
the research study to one form by providing low interpretations of the findings. And by eliminating
this deficiency, the study restricts itself to be dependent on self-reported data.
7. Data Analysis
As seen in (Habisreuther, Djordjevic, & Zarzalis, 2009) the data analysis is done by
statistical calculations and compression test, where in the flow of the fields in cushions will be
exhibited in a homogeneous distribution by calculating the intensity of velocity change and change
of displacement caused by creep. The compression test will help in identifying the unload and load
bearing area in the structures. For that reason, the validation of numerically obtained results with
the vibration drop observed under static load is considered. All such validations are a prerequisite
26
calculated as shown. This will eventually help in supporting the results through numerical
simulation.
7.1.1. Compression Test on Lattice Structure
The initial design of the lattice structure included the sandwich panels. The sandwich
panels helped in the distribution of energy in a uniform manner. On compression test along the
panels the loading bearing was see to be distributed uniformly and energy absorption was see till
78.4%. In respect to again the panels, Figure 7.1 explains the issues seen in the sandwich panel.
Figure 7.1: Compressive Strain 0% - 63.33% on Lattice structure with sandwich panel
Figure 7.2 explains the deformation of the sandwich panel over the sides of the lattice
structure under compressive load along the adjacent sides. This basically omits the factor of
considering the sandwich panel in design selection.
Figure 7.2: Sandwich panel deformation under Compressive Strain 20% -40% on
27
Therefore, the next approach towards the Lattice structure is to draft and print lattice
structures without the sandwich panels. The lattice structure (Figure 7.3) indefinitely experienced
a varied amount of deflection in energy absorption in comparison with Kelvin model
The energy absorption of the lattice structure is shown below (Figure 7.3). The
compression per image follows through 0% to 100% respectively. The unit dimension was 30 x
30 x 30 mm which was designed to keep the same size as the Kelvin unit. The maximum strain
[image:36.612.61.561.302.479.2]limit through observation was 18.9 mm which led to 63.33% compressive strain limit.
Figure 7.3: Compressive Strain 0% -100% on Lattice structure without sandwich panel
7.1.2. Compression Test on Kelvin Structure
Each of the 3D printed sample was compressed to 87% and released to the initial position
that is at 0%, by the compression tester (Figure 8.1). The compression and release cycle were
repeated a total of 100 times in each sample without taking any pause in between. There was no
defect observed through visual inspection or any structural deformation.
The literature provided by (Yang, Harrysson, West, & Cormier, 2015) states that only small
deflection is observed with Timoshenko model and hence provides yield value to be adequately
28
structures that are at realistic stress levels. This tends to represent that the effect of axial
extension/contraction due to bending is negligible when compared to the shear and bending effects.
Therefore, for future references, the study is restricted to conduct experiments in comparison to
[image:37.612.91.525.210.627.2]the smaller deflection Timoshenko model and not the larger one.
29
Figure 8.2: Buckling effect observed under 50% compressive stress in Kelvin model
The buckling modes seen in Figure 8 agree with the buckling modes in different stages of
compression calculated by Gong et al. (Gong & Kyriakides , 2005)
Figure 9: Simulated buckling modes of an anisotropic Kelvin Foam
(Gong & Kyriakides ,
[image:38.612.102.510.438.640.2]30
Figure 9 illustrated the crushing modelling of an anisotropic Kelvin foam that showed
similar buckling modes as Figure and hysteresis, etc. (Ge, Priydarshini, Cormier, Pan, & Tuber,
2017) (Gong & Kyriakides , 2005). Regardless of the difference in relative density and sample
sizes for different manufacturing methods, the stress
‐
strain curves of both extruded and 3D printed
TPU exhibit similar stress
‐
strain behavior in this study as demonstrated by Mullins effect. (Ge,
Priydarshini, Cormier, Pan, & Tuber, 2017)
In observation to the foam thickness change before and after compression, changes are per
Table 4 shown below. The foam thickness was measure through 30 minutes after completion of
the compression tests and the 3D printed foams were able to completely rebound to the original
foam thickness. (Ge, Priydarshini, Cormier, Pan, & Tuber, 2017)
Table 3: Foam thickness before and after compression testing
Before Compression testing (average dimensions)
– Kelvin Structure
After Compression testing (average
dimensions) – Kelvin Structure
30.9 ± 0.13 mm
29.8 ± 0.13 mm
As illustrated in Table 4.1, 3 densities are used when defining the foam material: ρNinja is
the density of the bulk TPU material constituting the Kelvin struts, and ρcube is the density of the
cubic foam specimen. The relative density of the Kelvin foam is defined as ρNinja/ρcube.
Table 4.1: Physical properties of NinjaFlex®, Kelvin unit cells, and cubic foam
(Ge,
Priydarshini, Cormier, Pan, & Tuber, 2017)
Ninjaflex® Material
Kelvin Unit Cells
Cubic Samples
Material
Density
ρNinja
(kg/m3)
3d
printed
infill
density
The strut
thickness (
t
) x
the length (
l
)
(mm)
Bounding
Box
dimension
(mm)
Density
ρcube
(kg/m3)
Bounding
box
dimension
(mm)
Relative
density
ρNinja/ρcu
be
31
Table 4.2
:
Volumetric properties of NinjaFlex®, Kelvin unit cells, and cubic foam
Tube
thickness
(mm)
Volume of
foam(mm
3)
Volume of
air (mm
3)
% air
% foam
Kelvin unit
cell
1.2
34.9469314 90.05306858 72.04245486
27.95754514
Ninjaflex®
Material
1.294
34.9413025 90.05869752 72.04695802
27.95304198
Cubic samples
N/A 125.0000000
N/A
0
100
7.1.3 Characterization of Cushion Factor
Compressive stress
‐
strain curves, cellular deformation behavior, and cushion factors were
3 characteristics evaluated via compression tests. (Ge, Priydarshini, Cormier, Pan, & Tuber, 2017)
Stress
‐
strain curve Compression testing was carried out to evaluate the cushion material
properties by using an INSTRON 5567. The compression speed was set as 8.33 mm/s. The
compression direction was perpendicular to the square part of the Kelvin cell. A total of 100
compression cycles were applied to each sample in accordance with ASTM D3574
‐
05. (Ge,
Priydarshini, Cormier, Pan, & Tuber, 2017) Because optimum cushion impacts occur at
significantly high strains, and the cushion dimension is often designed for high strains, the 3D
printed samples in this study were compressed to the maximum strain that the load cell was able
to sustain to investigate the impact energy in the nonlinear and densification zones. The 100
consecutive cyclic compression tests were intended to determine whether or not any cells had
fractured and whether or not there was any appreciable change in the impact energy absorption
32
Figure 10: Methods to develop cushion factor
To compare the cushioning property between the 3D printed foams and commercially
available foam cushions in use, the cushion factor of the 3D printed foam was calculated. A number
of diagrams have been suggested for characterizing cushion factor based on the compression
stress
‐
stain curve and drop platen test. (Ge, Priydarshini, Cormier, Pan, & Tuber, 2017) These
methods are summarized in Figure 10.
During the drop platen test, at the moment when the platen falls to the ground, the original
potential energy is absorbed by dynamic deformation of the foam and can be described by
Equation: W×h = e×A×t
Where W is the weight sitting on the foam, h is drop height, A is the bearing area, and t is
the foam thickness (Ge, Priydarshini, Cormier, Pan, & Tuber, 2017). The energy density of the
foam (e) corresponds to the shaded area under the stress
‐
strain curve up to the maximum stress σm
as shown in Figure 7.
The advantage of the compression test
‐
based diagrams is the small sample size, but the
33
platen test results are closer to real applications. (Ge, Priydarshini, Cormier, Pan, & Tuber, 2017).
Considering the limited sample size of the 3D printed foam, this study uses the compression test
to obtain the cushion factor C. The cushion factor derived from compression tests will generally
be lower than that obtained from drop platen tests, particularly in the left portion of the C versus
σm curve. (Creswell, 2013)
8. Results and Discussion
35
Figure 11.1 shows the charts of the stress and strain curves five portions where lattice
structure in termed to be structure ‘without cap’ printed in NinjaFlex®
material, that is 1 to 25, 26
– 50, 51 – 75, 76 – 100 and 101 – 102. The stress and strain curves define the viscoelastic properties
of the material under load and unload. The elastic region is clearly compressed to only 63.33%,
where once the load is reached 18.9 mm, the rebound if the structure is seen. This defines the
energy absorption of the cushion up to a level of 63.33%
8.1.2. Stress
‐
strain behavior in Kelvin structure
Figure 11.2 shows the screen shots of the stress – strain curves in three portions, that is 1
to 8, 41 to 48, and 89 to 96 in form of consecutive compression cycles that were conducted in the
foams respectively. The stress
‐
strain curves presented a property of viscoelastic material that
combines both viscous and elastic response under loading and unloading. The viscoelastic
behavior of a foam material is often manifested in the presence of hysteresis under cyclic loading.
To view the elastic region clearly, a new sample was compressed to 45% strain so that linear elastic
zone can be investigated (Figure 11.2). (Ge, Priydarshini, Cormier, Pan, & Tuber, 2017). As
illustrated in Figures 11.2, the stress
‐
strain curves can be considered in 3 areas. In area 1, where
the amount of compression is approximately 10 to 15%, the foam acts as an elastic spring where
the extent of compression deflection is proportional to the applied force. In area 2, which is
in-between 15% and 60% compression, the compression behavior here is mostly dictated by the
36
Figure 11.2: Original cyclic stress
‐
strain curves up to 87% strain
(Ge, Priydarshini, Cormier,
Pan, & Tuber, 2017)
In area 3, which is above 60% compression, the compressive stress is increased
significantly as the compression is in densified zone. Prominently, the stress
‐
strain curves of the
37
cycles and showed reduced strain resulting from softening behavior or the Mullins effect. (Ge,
Priydarshini, Cormier, Pan, & Tuber, 2017).
8.1.3. Comparative Analysis
In case of both the structures it is identified that as the compression move forward the
cyclic stress tended to proceed to the stress level at a point where the initial cycle had started and
thereby unloading was seen. In continuation with the cyclic compression, the stress –strain curve
had a stable path of unloading and loading and vice- versa. The stress – strain from 8
thcycle to
100
thcycle is almost identical. The compression values and strain values are shown in table 6.1,
6.2, 6.3 and 6.4 for the Kelvin and Lattice structure. These were conducted in three to four identical
specimens to provide the consistency in results and observation.
The softening behavior during the first few compression cycles was also observed by Bates
et al in their honeycomb 3D printed TPU foams after 5 cyclic compressions (Bates, Farrow, &
Trask, 2016). In a non
‐
3D printed cylindrical TPU specimen (12 mm diameter and 3 mm height),
the compressive stress
‐
strain curve in the second cycle was far more compliant than that in the
first cycle, and the stress
‐
strain curves stabilized after the initial few compression cycles (Qi &
Boyce, 2005)
Though the process is identical in both the cases, Kelvin structure and Lattice structure, the
energy absorption for both structures vary. Kelvin structure strain limit is seen till 26 mm with
87% of energy absorption, whereas Lattice structure strain limit was only up to 18.9 mm with
63.33% energy absorption. Hence moving forward, the energy absorption for Kelvin structure was
38
Table 5: Average C factor per cycle
Compressive
stress range
(Pa)
Compressive strain
Energy density e
(numerical…)
C*-factor
1st cycle
7.16E+06
0.87015
5724978.43
1.25E+00
6.63E+06
0.8700856
5293816.975
1.25E+00
Avg
6.90E+06
0.8701178
5509397.703
1.25E+00
2nd cycle
8.19E+06
0.870018
6641486.27
1.23E+00
6.55E+06
0.8701018
664146.27
1.23E+00
Avg.
7.37E+06
0.8700599
3652816.27
1.23E+00
3rd cycle
7.99E+06
0.8700684
6497705.56
1.23E+00
6.62E+06
0.871083
5373637.609
1.23E+00
Avg.
7.31E+06
0.8705757
5935671.585
1.23E+00
4th cycle
7.99E+06
0.8701487
6501232.76
1.23E+00
6.44E+00
0.8701087
5229876.03
1.23E+00
Avg.
4.00E+06
0.8701287
5865554.395
1.23E+00
5th cycle
7.95E+00
0.8701616
6473973.78
1.23E+00
6.52E+06
0.8701543
5294494.142
1.23E+00
Avg.
3.26E+06
0.87015795
5884233.961
1.23E+00
100th
cycle
9.68E+06
0.8702706
7952369.3
1.22E+00
1.03E+07
0.873408
8420262.748
1.22E+00
39
The average C factor in Table 6 explains the minimal points of the C verses the σm curve
(C*). The cushion factor and the respective stress is differentiated in a narrow range within 100
consecutive cycles tests. The cushion factors of rubber mats ranged from 4.2 to 5.7, whereas the
3D printed foams had a cushion factor of 1.22 to 1.25 at a stress of 9.99 to 6.90 MPa. The low
cushion factor allows engineers to use customized 3D printed shapes for a specific application
where the metal coil spring is usually used. (Ge, Priydarshini, Cormier, Pan, & Tuber, 2017)
During the 100 consecutive cyclic compression tests, the stress at the first 5 cycles ranged
from 7.14 to 7.79 MPa. The hysteresis after the first cycle compression is 7.86 J. Starting with the
second cycle, the hysteresis reduced to 6.08 J and the subsequent hysteresis ranged between 5.23
and 6.08 J observed from 3rd to 100th compression cycle. Overall, from the fifth compression
cycle onward, little change in compressive stresses and hysteresis was observed. (Ge, Priydarshini,
Cormier, Pan, & Tuber, 2017)
The foremost conclusion derived was on the basis of the limited size of the sample such as,
40
9. Conclusion
The present research demonstrates a possibility of creating cushions by 3D printer on the
basis on fused deposition modelling (FDM) theory. This study extraordinarily provides increase
in computational speed to form cushions for rapid prototyping purposes. This helps in providing
porous Kelvin structure and Lattice structure, thereby letting air flow within the microstructure of
solid sponge using standard Navier–Stokes solver. For this purpose, a surface will be obtained
from the MRI measurement (Grobe, et al., 2008) of a 45 PPI sponge by Kelvin models and this
way they can be made accessible for the flow simulation. The calculation of amplitude and
attenuation of 3D printed cushion can be seen with good agreement with polyurethane foams only
when sufficient parameters are investigated. For this purpose, the research study will concentrate
on comparative values evaluated by tests reported through ISTA 3A standard.
The study significantly provides details about the Lattice structure and Kelvin structure
and its impact on 3D printed cushion. It demonstrates the walk-through study of how material is
selected for cushioning purpose. The comparative approach of Fila flex material and NinjaFlex®
material helps in identification of feasibility in printing the respective structures in a 3D printer.
Designing these models is elaborately explained to provide a sufficient data on how a structure is
selected to suffice the cushioning properties.
In terms of concluding on selection for a structure, the Kelvin structure can be taken as a
better form as it imparts higher energy absorption with uniformity in load bearing areas and higher
strain limit.
Application of this Kelvin design will be seen as rapid tooling using the FDM system for
41
application. In this research work no binding material or tie layers is required. Hence it is observed
that wastage will be minimal throughout the experimentation procedure. The test results of the
comparative analysis will prove the reproduction of NinjaFlex® cushions in place of polyurethane
foams because of its cost-effective approach too. Future work will include further modification of
this rapid prototyping process in terms of better quality and accuracy of FDM produced foams,
optimization of cushion performance parameters in comparison to polyurethane foams, and by
providing a cost-effective means for rapid prototyping purposes.
The cushions foam’s Mullin effect and its resilience led to the conclusion that the 3D print
thermoplastic urethane will fall in the category of rubber like energy absorbers and will be opposed
to the most single usage cushioning materials. These rubber like energy absorbents significantly
differentiate from a single use cushion foam, which on the other hand tend to have a permanent
collapse as the broken unit cells can be acquainted to multiple compressions or impacts.
Though there is slight variation in dimensions during the 3D printing process, especially
focusing on the edges of the cubic foam tend to be potential source for causing the deformation
behavior while compression tests. All the cushioning factors mentioned were based in specific
densities and dimensions for example the length or diameter rations in accordance to the strut.
Further study can also be preceded with investigation of the effect of the relative density
on the infill density while printing through the 3D printer. Additionally, the 30 mm cubic sample
size is relatively small compared with the standard testing sample size of 101.6 × 101.6 mm. A
large
‐
size sample should be produced to investigate the potential influence of the sample size.
(Ge, Priydarshini, Cormier, Pan, & Tuber, 2017). Lastly, further study is essential to understand
42
transverse directions to determine whether the 3D printing build orientation has an effect on
43
Reference
Alderson, A., Rasburn, J., & Evans, K. (2007). Mass transport properties of auxetic (negative
Poisson's ratio) foams.
Physics staus solidi(b)
, 817-827. doi:10.1002/pssb.200572701
Bates, S., Farrow, I., & Trask, R. (2016). 3D printed polyurethane honeycombs for repeated
tailored energy absorption.
Mateirals and Design
, 172-183. Retrieved from
https: