This is a repository copy of
Estimating the prevalence of hematological malignancies and
precursor conditions using data from Haematological Malignancy Research Network
(HMRN)
.
White Rose Research Online URL for this paper:
http://eprints.whiterose.ac.uk/102384/
Version: Published Version
Article:
Li, Jinlei, Smith, Alexandra Gwen orcid.org/0000-0002-1111-966X, Crouch, Simon
orcid.org/0000-0002-3026-2859 et al. (2 more authors) (2016) Estimating the prevalence
of hematological malignancies and precursor conditions using data from Haematological
Malignancy Research Network (HMRN). Cancer causes & control. ISSN 1573-7225
https://doi.org/10.1007/s10552-016-0780-z
[email protected] https://eprints.whiterose.ac.uk/
Reuse
This article is distributed under the terms of the Creative Commons Attribution (CC BY) licence. This licence allows you to distribute, remix, tweak, and build upon the work, even commercially, as long as you credit the authors for the original work. More information and the full terms of the licence here:
https://creativecommons.org/licenses/
Takedown
If you consider content in White Rose Research Online to be in breach of UK law, please notify us by
O R I G I N A L P A P E R
Estimating the prevalence of hematological malignancies
and precursor conditions using data from Haematological
Malignancy Research Network (HMRN)
Jinlei Li1,2•Alex Smith1•Simon Crouch1•Steven Oliver1•Eve Roman1
Received: 30 March 2015 / Accepted: 13 June 2016
ÓThe Author(s) 2016. This article is published with open access at Springerlink.com
Abstract
Objective Well-established cancer registries that routinely link to death registrations can estimate prevalence directly by counting patients alive at a particular point in time (observed prevalence). Such direct methods can only pro-vide prevalence for the years over which the registry has been operational. Time-defined estimates, including 5- and 10-year prevalence, may however underestimate the total cancer burden, and compared with other cancers, there is a lack of accurate information on the total prevalence of hematological malignancy subtypes. Accordingly, we aimed to estimate prevalence (observed and total preva-lence) of hematological malignancies and precursor con-ditions by clinically meaningful subtypes using data from the UK’s specialist population-based register, the Haema-tological Malignancy Research Network (www.hmrn.org).
Methods Observed and total prevalences were estimated from 15,810 new diagnoses of hematological malignancies from 2004 to 2011 and followed up to the 31 August 2011 (index data). Observed prevalence was calculated by the counting method, and a method based on modelling inci-dence and survival was used to estimate total prevalence. Estimates were made according to current disease classi-fication for the HMRN region and for the UK.
Results The overall observed and total prevalence rates were 281.9 and 548.8 per 100,000, respectively; the total number of observed and total prevalent cases in the UK was estimated as 165,841 and 327,818 cases, as expected
variation existed by disease subtype reflecting the hetero-geneity in underlying disease incidence, survival and age distribution of hematological cancers.
Conclusions This study demonstrates the importance of estimating ‘total’ prevalence rather than ‘observed’ prevalence by current disease classification (ICD-O-3), particularly for subtypes that have a more indolent nature and for those that are curable. Importantly, these analyses demonstrate that relying on observed prevalence alone would result in a significant underestimation of the relative burden of some subtypes. While many of these cases may be considered cured and no longer being actively treated, people in this survivorship phase may have long-term medical needs and accordingly, it is important to provide accurate counts to allow for healthcare planning.
Keywords PrevalenceCancer registryEpidemiology
LeukemiaLymphoma Myeloma
Introduction
Cancer prevalence may be defined as the proportion of people in a population who have ever received a cancer diagnosis in the past and who are alive on a specified date—the index date. Cancer prevalence, which is gener-ally estimated using data from cancer registries [1], pro-vides information on the healthcare needs of cancer patients who are on long-term medication and/or who are being monitored at regular intervals. In addition, for can-cers that can be cured, prevalence is used to estimate the size of the survivor population.
Well-established cancer registries that routinely link to death registrations can estimate prevalence directly by counting patients alive at a particular point in time. Such
& Alex Smith
1 Department of Health Sciences, University of York, Seebohm
Rowntree Building, Heslington, York YO10 5DD, UK
2 Peking Union Medical College, Beijing, China
direct methods can, however, only provide prevalence for the years over which the registry has been operational: the term observed prevalence often being used to describe estimates derived from registries that have been established for shorter periods. In such cases, it is common practice to quote the length over which the registry has been func-tioning alongside the observed prevalence estimate. Like-wise, 5- and 10-year prevalence estimates are commonly used to assess cancer burden: The former estimating
patients diagnosed and ascertained in the previous 5 years and the latter in the previous 10 years. Time-defined prevalence estimates may, however, underestimate the total cancer burden, and in order to provide better guidance for healthcare planning, a variety of methods have been developed to estimate total prevalence (the proportion of the population alive on the index date who have ever received a diagnosis of the cancer). Total prevalence is usually estimated using models that incorporate incidence and survival [2–7].
Compared with other cancers, there is a lack of accurate information on the total prevalence of clinically meaning-ful hematological malignancy subtypes. This is partly because these complex cancers are diagnosed using a combination of histology, cytology, immunophenotype, cytogenetics, imaging and clinical data, and this range and depth of data are difficult for cancer registries to access systematically [8,9]. Hence, the broad ICD-10 classifica-tion (leukemia, Hodgkin lymphoma, non-Hodgkin lym-phoma and myeloma) has continued to be applied by many national registries [10], including the UK’s National Can-cer Intelligence Network, the USA’s Surveillance, Epi-demiology and End Results Program and the WHO’s International Agency for Research on Cancer [11–14].
Accordingly, the present study aims to estimate preva-lence (observed prevapreva-lence and total prevapreva-lence) of hematological malignancies for clinically meaningful subtypes using data from the UK’s specialist population-based register, the Haematological Malignancy Research
[image:3.595.52.289.54.247.2]Fig. 1 Population age and sex structure of the Haematological Malignancy Research Network (HMRN) region (bars) compared to the UK as a whole (lines), 2001 [16]
Table 1 Subtypes considered in this study, according to their incidence and survival categoriesa
Incidence (per 100,000)
Survival
Poor (5-year survival
\30 %)
Medium (5-year survival 30–70 %) Good (5-year survival[70 %)
Low (\2) Chronic myelomonocytic
leukemia
Acute lymphoblastic leukemia Chronic myelogenous leukemia
Mantle cell lymphoma T cell leukemia Hairy cell leukemia
Burkitt lymphoma
T cell lymphoma
Plasmacytoma
Lymphoproliferative disorder not otherwise specified
Medium (2–5) Acute myeloid leukemia Marginal zone lymphoma Follicular lymphoma
Myelodysplastic syndromes Hodgkin lymphoma
Monoclonal B cell lymphocytosis
High ([5) Chronic lymphocytic leukemia Myeloproliferative neoplasms
Diffuse large B cell lymphoma Monoclonal gammopathy of undetermined significance
Plasma cell myeloma
a Incidence and 5-year survival rates in HMRN from 2004 to 2011. Categories were made for this analysis only and cannot be generalized to
other diseases or other data
[image:3.595.48.539.446.678.2]Network (www.hmrn.org) [15]. In addition, because hematological malignancies can be diagnosed at any age and survival patterns tend to differ between children and adults, adaptations to the statistical models used to estimate total prevalence were developed and applied.
Methods
Data
Data are from the UK’s population-based Haematological Malignancy Research Network (HMRN). Full details of its structure, data collection methods and ethical approvals have been described previously [16]. Briefly, within HMRN, patient care is provided by 14 hospitals, and as a matter of policy, all diagnoses are made in a single department that contains all relevant expertise and tech-nologies to provide an integrated diagnostic service including histology, cytology, immunophenotyping and molecular cytogenetics. All diagnoses are coded to current WHO classification. Established in September 2004, HMRN collects information on all patients newly diag-nosed with hematological malignancies in the study area (catchment population *4 million, with *2,200 new
diagnoses per year) [15]. HMRN has Section 251 support under the NHS Act 2006, and all patients have full treat-ment, response and outcome data collected to clinical trial standards; all are ‘flagged’ for death registrations at the national Medical Research Information Service (MRIS).
Calculating prevalence
The index date for prevalence calculations was taken to be 31 August 2011. Observed prevalence was calculated directly by counting the number of survivors newly diag-nosed with a hematological cancer from 1 September 2004 to 31 August 2011, alive on the index date (31 August 2011). Total prevalence for each subtype was derived by applying an estimated correction factor, the completeness index (R), defined as the proportion of the total prevalence represented by the observed prevalence as described by Capocaccia and Angelis [17].
The calculation of the completeness index is based on incidence and survival models [17]. To accommodate the characteristics of hematological malignancies, a regression spline was used to estimate incidence for single ages. This nonparametric method makes a smoothing curve, which is not sensitive to the assumptions made for a parametric incidence function. For survival models, the Weibull
[image:4.595.56.542.58.344.2]function has previously been successfully applied to prevalence estimates [17–19]. Based on the Weibull function, the influence of age at diagnosis was described using spline and modelled with an exponential factor of survival function.
As the age and sex structure in the HMRN region mir-rors that of the UK as a whole (Fig.1), national prevalence was estimated by applying the HMRN rates to the UK population for both genders. All calculations were con-ducted using Stata 11.0 and R 3.0.1 software.
Results
There were 15,810 diagnoses of hematological malignan-cies from 2004 to 2011, of which 8,799 were among males (55.7 %) and 7,011 were females (44.3 %). The crude incidence rate for all hematological cancers combined was
63.2 per 100,000 per year and, as expected, incidence and survival varied by subtype: This variation is summarized in Table1, where diagnoses are grouped according to their incidence magnitude (\2, 2–5,[5 per 100,000) and overall
survival (\30, 30–70,[70 %). In addition to incidence and
survival, age at diagnosis plays an important role in prevalence, and as with incidence and survival, hemato-logical malignancies exhibit much greater variation than most other cancers. Indeed, with different subtypes domi-nating at different ages, hematological malignancy can be diagnosed at any age; the median age at diagnosis ranging from 15.3 years for acute lymphoblastic leukemia to 77.3 years for chronic myelomonocytic leukemia. Most subtypes had an older median diagnostic age (70.6 years for all hematological malignancies combined) (Fig.2).
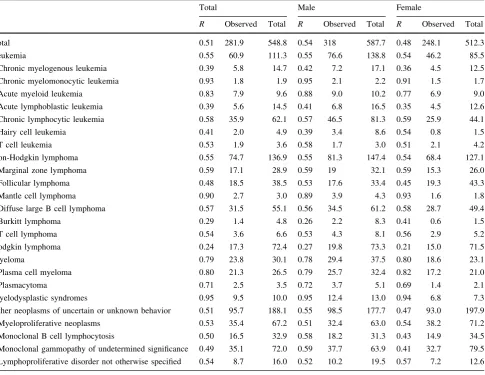
[image:5.595.59.545.73.448.2]Observed and total prevalence estimates (per 100,000) together with completeness indices (R) are presented in Table2. The overall observed prevalence rate was 281.9
Table 2 Observed and total prevalence (per 100,000) by sex: Haematological Malignancy Research Network 2004–2011
Total Male Female
R Observed Total R Observed Total R Observed Total
Total 0.51 281.9 548.8 0.54 318 587.7 0.48 248.1 512.3
Leukemia 0.55 60.9 111.3 0.55 76.6 138.8 0.54 46.2 85.5
Chronic myelogenous leukemia 0.39 5.8 14.7 0.42 7.2 17.1 0.36 4.5 12.5
Chronic myelomonocytic leukemia 0.93 1.8 1.9 0.95 2.1 2.2 0.91 1.5 1.7
Acute myeloid leukemia 0.83 7.9 9.6 0.88 9.0 10.2 0.77 6.9 9.0
Acute lymphoblastic leukemia 0.39 5.6 14.5 0.41 6.8 16.5 0.35 4.5 12.6
Chronic lymphocytic leukemia 0.58 35.9 62.1 0.57 46.5 81.3 0.59 25.9 44.1
Hairy cell leukemia 0.41 2.0 4.9 0.39 3.4 8.6 0.54 0.8 1.5
T cell leukemia 0.53 1.9 3.6 0.58 1.7 3.0 0.51 2.1 4.2
Non-Hodgkin lymphoma 0.55 74.7 136.9 0.55 81.3 147.4 0.54 68.4 127.1
Marginal zone lymphoma 0.59 17.1 28.9 0.59 19 32.1 0.59 15.3 26.0
Follicular lymphoma 0.48 18.5 38.5 0.53 17.6 33.4 0.45 19.3 43.3
Mantle cell lymphoma 0.90 2.7 3.0 0.89 3.9 4.3 0.93 1.6 1.8
Diffuse large B cell lymphoma 0.57 31.5 55.1 0.56 34.5 61.2 0.58 28.7 49.4
Burkitt lymphoma 0.29 1.4 4.8 0.26 2.2 8.3 0.41 0.6 1.5
T cell lymphoma 0.54 3.6 6.6 0.53 4.3 8.1 0.56 2.9 5.2
Hodgkin lymphoma 0.24 17.3 72.4 0.27 19.8 73.3 0.21 15.0 71.5
Myeloma 0.79 23.8 30.1 0.78 29.4 37.5 0.80 18.6 23.1
Plasma cell myeloma 0.80 21.3 26.5 0.79 25.7 32.4 0.82 17.2 21.0
Plasmacytoma 0.71 2.5 3.5 0.72 3.7 5.1 0.69 1.4 2.1
Myelodysplastic syndromes 0.95 9.5 10.0 0.95 12.4 13.0 0.94 6.8 7.3
Other neoplasms of uncertain or unknown behavior 0.51 95.7 188.1 0.55 98.5 177.7 0.47 93.0 197.9
Myeloproliferative neoplasms 0.53 35.4 67.2 0.51 32.4 63.0 0.54 38.2 71.2
Monoclonal B cell lymphocytosis 0.50 16.5 32.9 0.58 18.2 31.3 0.43 14.9 34.5
Monoclonal gammopathy of undetermined significance 0.49 35.1 72.0 0.59 37.7 63.9 0.41 32.7 79.5
Lymphoproliferative disorder not otherwise specified 0.54 8.7 16.0 0.52 10.2 19.5 0.57 7.2 12.6
Index date of 31 August 2011
R: completeness index
per 100,000, compared to a total prevalence rate of 548.8 per 100,000, the completeness index of 0.51 suggesting that around half of prevalent cases are not captured using observed prevalence. This varied by diagnostic subtype, ranging from 0.24 for Hodgkin lymphoma through to 0.90 for mantle cell lymphoma. As expected, subtypes with longer survival exhibited the largest differences between observed and total prevalence, whereas for those with poor survival, the estimates were much closer. For example, patients diagnosed with chronic myelomonocytic leukemia or mantle cell lymphoma during the study period had 5-year overall survival estimates\30 % (Table1), and so
completeness indices were high at 0.93 and 0.90,
respectively. By contrast, patients diagnosed with chronic myelogenous leukemia or hairy cell leukemia, both of whom had 5-year overall survival estimates [70 %
(Table1), had comparatively low completeness estimates of 0.39 and 0.41, respectively.
In general, the difference between observed and total prevalence was greater for subtypes with more cases diagnosed at a young age. For example, although both Hodgkin lymphoma and follicular lymphoma have a medium incidence (2–5 per 100,000) and good survival (5-year survival[70 %) (Table1), the completeness index of
follicular lymphoma (0.48) was double that of Hodgkin lymphoma (0.24). This is because younger patients with
0 5,000 10,000 15,000 20,000 25,000 Number of prevalent cases
Chronic myelomonocytic leukemia T-cell leukemia Mantle cell lymphoma Plasmacytoma T-cell lymphoma Burkitt lymphoma Hairy cell leukemia Acute myeloid leukemia Myelodysplastic syndroms Acute lymphoblastic leukemia Chronic myelogenous leukemia Lymphoproliferative disorder not otherwise specified Monoclonal B-cell Lymphocytosis Marginal zone lymphoma Follicular lymphoma Plasma cell myeloma Diffuse large B-cell lymphoma Myeloproliferative neoplasms Monoclonal gammopathy of undetermined significance Hodgkin Lymphoma Chronic lymphocytic leukemia
Observed Total
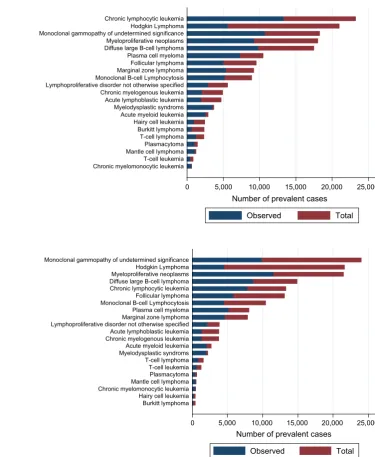
Fig. 3 Observed and total prevalence cases for males in the UK on 31 August 2011. (Color figure online)
0 5,000 10,000 15,000 20,000 25,000 Number of prevalent cases
Burkitt lymphoma Hairy cell leukemia Chronic myelomonocytic leukemia Mantle cell lymphoma Plasmacytoma T-cell leukemia T-cell lymphoma Myelodysplastic syndroms Acute myeloid leukemia Chronic myelogenous leukemia Acute lymphoblastic leukemia Lymphoproliferative disorder not otherwise specified Marginal zone lymphoma Plasma cell myeloma Monoclonal B-cell Lymphocytosis Follicular lymphoma Chronic lymphocytic leukemia Diffuse large B-cell lymphoma Myeloproliferative neoplasms Hodgkin Lymphoma Monoclonal gammopathy of undetermined significance
Observed Total
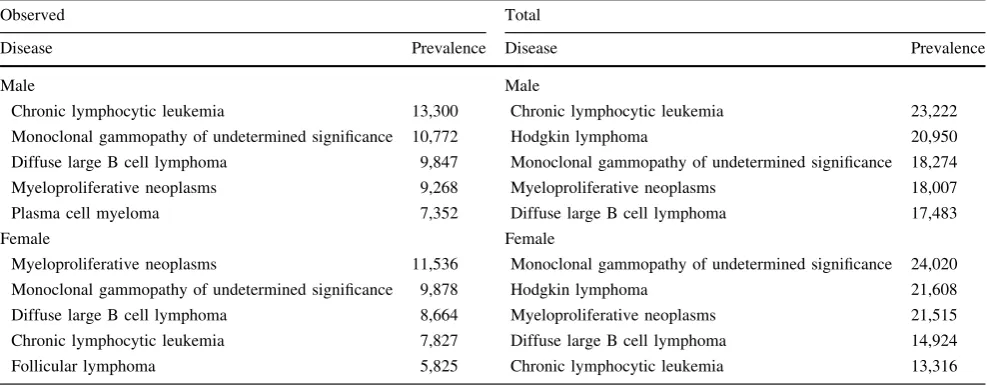
[image:6.595.165.541.52.510.2]Hodgkin lymphoma tend to be cured, resulting in a larger number of prevalent cases after middle age, while follicular lymphoma is rarely diagnosed before the age of 40 years. Observed and total prevalence estimates for the UK as a whole are presented in Figs.3 (males) and 4 (females): observed prevalence (blue bars) and total prevalence (blue?red bar). Hematological malignancy subtypes are ranked in order of descending total prevalence. In total, the observed prevalence was estimated to be 165,841 cases and total prevalence 327,818 cases. Table3 lists the UK observed and total prevalence estimates of the top five most prevalent hematological malignancies for males and females separately. Clearly, relying on observed prevalence alone would have resulted in a significant underestimation of the relative burden of some diseases. Observed prevalence, for example, ranks Hodgkin lymphoma as 6th for men and 8th for women, whereas total prevalence places it second for both genders. In other words, compared with observed prevalence, the relative contribution of Hodgkin lymphoma increases when longer prevalence periods are considered.
Discussion
This study is the first to estimate observed and total prevalence for hematological malignancies using up-to-date clinically meaningful disease classifications. The results suggest that at any one time, around 19,700 people in the study region are likely to be living with a prior diagnosis of a hematological malignancy or a recognized precursor condition (monoclonal gammopathy of uncertain significance or monoclonal B cell lymphocytosis): In total, this equates to around 327,800 people in the UK. After
calculating total prevalence, the most prevalent malignancy in men was chronic lymphocytic leukemia and Hodgkin lymphoma in women.
Established in 2004, the HMRN’s population-based patient cohort provided an estimate of hematological malignancy prevalence that accounted for about half of the total (completeness index of 0.51). Consistent with expectations, the differences between total prevalence and observed prevalence estimates were typically seen in less fatal cancers that are commonly diagnosed at a younger age. For example, Hodgkin lymphoma generally has good survival, and total prevalence estimates exceed those of observed prevalence, while the difference between observed prevalence and total prevalence is slight for mantle cell lymphoma which has generally poor survival. Again, as expected, large differences between observed and total prevalence were also seen for precursor condi-tions. Information on 3-, 5- and 10-year prevalence is available on the study’s website (www.hmrn.org/statistics/ prevalence) and has been published for the lymphomas and myeloid malignancies [20,21].
[image:7.595.51.545.73.266.2]Not only is the HMRN region similar to the UK as a whole in terms of its age and sex distribution, but it is also broadly similar by urban/rural and deprivation status [16]; accordingly, rates were not standardized by age and sex. Likewise, according to the 2011 [22] census, the proportion of HMRN’s population classified as white was the same as the UK as a whole (87 %). However, some ethnic groups are underrepresented in the region primarily the black ethnic group. For some hematological malignancies, such as myeloma, incidence and survival have been shown to vary by ethnicity with higher rates of both in black ethnic groups [14, 23, 24]. Accordingly, HMRN rates may
Table 3 Comparison of observed (7-year) and total prevalence of the top five hematological malignancies by gender in the UK
Observed Total
Disease Prevalence Disease Prevalence
Male Male
Chronic lymphocytic leukemia 13,300 Chronic lymphocytic leukemia 23,222
Monoclonal gammopathy of undetermined significance 10,772 Hodgkin lymphoma 20,950
Diffuse large B cell lymphoma 9,847 Monoclonal gammopathy of undetermined significance 18,274
Myeloproliferative neoplasms 9,268 Myeloproliferative neoplasms 18,007
Plasma cell myeloma 7,352 Diffuse large B cell lymphoma 17,483
Female Female
Myeloproliferative neoplasms 11,536 Monoclonal gammopathy of undetermined significance 24,020
Monoclonal gammopathy of undetermined significance 9,878 Hodgkin lymphoma 21,608
Diffuse large B cell lymphoma 8,664 Myeloproliferative neoplasms 21,515
Chronic lymphocytic leukemia 7,827 Diffuse large B cell lymphoma 14,924
Follicular lymphoma 5,825 Chronic lymphocytic leukemia 13,316
underestimate myeloma prevalence in areas of the country with a higher proportion of black people [25].
This study assumes that the survival rate was constant over time; however, for some subtypes, there has been dramatic changes in outcomes due to the introduction of new treatments, for example, the introduction of tyrosine kinase inhibitors has transformed the survival in chronic myelogenous leukemia (CML) from a fatal disease in non-transplanted patients to one where patients can now achieve a near normal life span [26]. While CML is a rare disease (1 per 100,000), the utilization of current survival rates may lead to an overestimate in prevalence; accord-ingly, methods to estimate total prevalence need to be adapted to account for changes in outcome due to the introduction of novel therapies.
The major aim of this study was to estimate the preva-lence of hematological malignancies and precursor condi-tions for clinically relevant diagnostic groups and explore the impact of calculating observed and total prevalence by current disease classification. For some subtypes, calcu-lating observed prevalence would lead to an underestima-tion of the prevalent populaunderestima-tion, as cases diagnosed prior to the establishment of HMRN will not be captured. While many of these cases may be considered cured and no longer being actively treated, people in this survivorship phase may have long-term medical needs, and accordingly, it is important to provide accurate counts to allow for health-care planning.
Funding Haematological Malignancy Research Network is funded by Lymphoma and Leukaemia Research (http://leukaemialympho maresearch.org.uk/).
Compliance with ethical standards
Conflict of interest No conflicts of interest declared.
Ethics statementHaematological Malignancy Research Network has ethics approval from Leeds West Research Ethics Committee, R&D approval from each NHS Trust in the study area and exemption from Section 251 of the Health and Social Care Act.
Open Access This article is distributed under the terms of the Creative Commons Attribution 4.0 International License (http://creative commons.org/licenses/by/4.0/), which permits unrestricted use, distri-bution, and reproduction in any medium, provided you give appropriate credit to the original author(s) and the source, provide a link to the Creative Commons license, and indicate if changes were made.
References
1. Silva I (1999) Cancer epidemiology: principles and methods, 2nd revised. World Health Organization, Lyon
2. Capocaccia R, Colonna M, Corazziari I, De Angelis R, Francisci S, Micheli A et al (2002) Measuring cancer prevalence in Europe: the EUROPREVAL project. Ann Oncol Off J Eur Soc Med Oncol ESMO 13(6):831–839
3. Forman D, Stockton D, Møller H, Quinn M, Babb P, De Angelis R et al (2003) Cancer prevalence in the UK: results from the EUROPREVAL study. Ann Oncol Off J Eur Soc Med Oncol ESMO 14(4):648–654
4. Mo¨ller T, Anderson H, Aareleid T, Hakulinen T, Storm H, Tryggvadottir L et al (2003) Cancer prevalence in Northern Europe: the EUROPREVAL study. Ann Oncol Off J Eur Soc Med Oncol ESMO 14(6):946–957
5. Merrill RM, Capocaccia R, Feuer EJ, Mariotto A (2000) Cancer prevalence estimates based on tumour registry data in the Surveillance, Epidemiology, and End Results (SEER) Program. Int J Epidemiol 29(2):197–207
6. Lutz JM, Francisci S, Mugno E, Usel M, Pompe-Kirn V, Coe-bergh J-W et al (2003) Cancer prevalence in Central Europe: the EUROPREVAL Study. Ann Oncol Off J Eur Soc Med Oncol ESMO 14(2):313–322
7. Verdecchia A, Micheli A, Colonna M, Moreno V, Izarzugaza MI, Paci E et al (2002) A comparative analysis of cancer prevalence in cancer registry areas of France, Italy and Spain. Ann Oncol Off J Eur Soc Med Oncol ESMO 13(7):1128–1139
8. WHO (2008) WHO classification of tumours of haematopoietic and lymphoid tissue. International Agency for Research on Cancer, Lyon
9. Percy C, Fritz A, Jack A, Shanmugarathan S, Sobin L, Parkin DM et al (2000) International classification of diseases for oncology, 3rd edn. World Health Organization, Geneva
10. WHO (1994) International statistical classification of disease and related health problems, ICD-10. World Health Organization, Geneva
11. Ferlay J, Shin H-R, Bray F, Forman D, Mathers C, Parkin DM (2010) Estimates of worldwide burden of cancer in 2008: GLO-BOCAN 2008. Int J Cancer J Int Cancer 127(12):2893–2917 12. National Cancer Intelligence Network (NCIN) (2012) http://
www.ncin.org.uk/home. Accessed 26 June 2013
13. NORDCAN. NORDCAN (2012)http://www-dep.iarc.fr/nordcan/ English/frame.asp. Accessed 29 June 2013
14. Surveillance, Epidemiology, and End Results Program (SEER) (2012)http://seer.cancer.gov/. Accessed 20 July 2013
15. Haematological Malignancy Research Network (HMRN) (2011) https://www.hmrn.org/. Accessed 30 Apr 2012
16. Smith A, Roman E, Howell D, Jones R, Patmore R, Jack A et al (2010) The Haematological Malignancy Research Network (HMRN): a new information strategy for population based epi-demiology and health service research. Br J Haematol 148(5):739–753
17. Capocaccia R, De Angelis R (1997) Estimating the completeness of prevalence based on cancer registry data. Stat Med 16(4):425–440 18. Gigli A, Mariotto A, Clegg LX, Tavilla A, Corazziari I, Capoc-accia R et al (2006) Estimating the variance of cancer prevalence from population-based registries. Stat Methods Med Res 15(3):235–253
19. Simonetti A, Gigli A, Capocaccia R, Mariotto A (2008) Esti-mating complete prevalence of cancers diagnosed in childhood. Stat Med 27(7):990–1007
20. Smith A, Crouch S, Lax S, Li J, Painter D, Howell D et al (2015) Lymphoma incidence, survival and prevalence 2004–2014: sub-type analyses from the UK’s Haematological Malignancy Research Network. Br J Cancer 112(9):1575–1584
21. Roman E, Smith A, Appleton S, Crouch S, Kelly R, Kinsey S et al (2016) Myeloid malignancies in the real-world: occurrence, progression and survival in the UK’s population-based Haema-tological Malignancy Research Network 2004–15. Cancer Epi-demiol 42:186–198
23. National Cancer Intelligence Network and Cancer Research UK (2009) Cancer incidence and survival by Major Ethnic Group, England 2002–2006
24. Samy EF, Ross J, Bolton E, Morris EJ, Oliver SE (2015) Variation in incidence and survival by ethnicity for patients with myeloma in England (2002–2008). Leuk Lymphoma 56(9):2660–2667 25. Office for National Statistics (2012) Ethnicity and national
identity in England and Wales 2011.http://www.ons.gov.uk/ons/
rel/census/2011-census/key-statistics-for-local-authorities-in-eng land-and-wales/rpt-ethnicity.html. Accessed 28 June 2013 26. Smith AG, Painter D, Howell DA, Evans P, Smith G, Patmore R,
Jack A, Roman E (2014) Determinants of survival in patients with chronic myeloid leukaemia treated in the new era of oral therapy: findings from a UK population-based patient cohort. BMJ Open 4(1):e004266. doi:10.1136/bmjopen-2013-004266
![Fig. 1 Population age and sex structure of the Haematologicalthe UK as a whole (Malignancy Research Network (HMRN) region (bars) compared tolines), 2001 [16]](https://thumb-us.123doks.com/thumbv2/123dok_us/7860175.179850/3.595.48.539.446.678/population-structure-haematologicalthe-malignancy-research-network-compared-tolines.webp)