This is a repository copy of
Major improvements to the Heliconius melpomene genome
assembly used to confirm 10 chromosome fusion events in 6 million years of butterfly
evolution
.
White Rose Research Online URL for this paper:
http://eprints.whiterose.ac.uk/98871/
Version: Published Version
Article:
Davey, John W., Chouteau, Mathieu, Barker, Sarah L. et al. (8 more authors) (2016) Major
improvements to the Heliconius melpomene genome assembly used to confirm 10
chromosome fusion events in 6 million years of butterfly evolution. G3: Genes, Genomes,
Genetics. pp. 695-708.
https://doi.org/10.1534/g3.115.023655
eprints@whiterose.ac.uk
https://eprints.whiterose.ac.uk/
Reuse
This article is distributed under the terms of the Creative Commons Attribution (CC BY) licence. This licence
allows you to distribute, remix, tweak, and build upon the work, even commercially, as long as you credit the
authors for the original work. More information and the full terms of the licence here:
https://creativecommons.org/licenses/
Takedown
If you consider content in White Rose Research Online to be in breach of UK law, please notify us by
IN VESTI GA TI ON
Major Improvements to the
Heliconius melpomene
Genome Assembly Used to Con
fi
rm 10
Chromosome Fusion Events in 6 Million Years of
Butter
fl
y Evolution
John W. Davey,*,1Mathieu Chouteau,†Sarah L. Barker,* Luana Maroja,‡Simon W. Baxter,§
Fraser Simpson,** Richard M. Merrill,* Mathieu Joron,†James Mallet,**,2Kanchon K. Dasmahapatra,**,3
and Chris D. Jiggins*,1
*Department of Zoology, University of Cambridge, CB2 3EJ, United Kingdom,†Centre d’Ecologie Fonctionnelle et
Evolutive, UMR 5175 CNRS - EPHE - Université de Montpellier - Université Paul Valéry, 34293 Montpellier 5, France,
‡Department of Biology, Williams College, Williamstown, Massachusetts, 01267§School of Biological Sciences, University
of Adelaide, SA 5005 Australia, and**Department of Genetics, Evolution and Environment, University College London, Darwin Building, Gower Street, WC1E 6BT, United Kingdom
ORCID ID: 0000-0002-1017-9775 (J.W.D.)
ABSTRACT TheHeliconius butterflies are a widely studied adaptive radiation of 46 species spread across Central and South America, several of which are known to hybridize in the wild. Here, we present a substantially improved assembly of theHeliconius melpomenegenome, developed using novel methods that should be applicable to improving other genome assemblies produced using short read sequencing. First, we whole-genome-sequenced a pedigree to produce a linkage map incorporating 99% of the genome. Second, we incorporated haplotype scaffolds extensively to produce a more complete haploid version of the draft genome. Third, we incorporated20x coverage of Pacific Biosciences sequencing, and scaffolded the haploid genome
using an assembly of this long-read sequence. These improvements result in a genome of 795 scaffolds, 275 Mb in length, with an N50 length of 2.1 Mb, an N50 number of 34, and with 99% of the genome placed, and 84% anchored on chromosomes. We use the new genome assembly to confirm that theHeliconiusgenome under-went 10 chromosome fusions since the split with its sister genusEueides, over a period of about 6 million yr.
KEYWORDS Heliconius genome
assembly linkage mapping chromosome
fusions Eueides
Understanding evolution and speciation requires an understanding of genome architecture. Phenotypic variation within a population can be maintained by chromosome inversions (Lowry and Willis 2010; Joron
et al.2011; Wanget al.2013), and may lead to species divergence (Noor
et al.2001; Feder and Nosil 2009) or to the spread of phenotypes by introgression (Kirkpatrick and Barrett 2015). Genetic divergence and genome composition is affected by variation in recombination rate (Nachman and Payseur 2012; Nam and Ellegren 2012). Geneflow be-tween species can be extensive (Martinet al.2013), and varies consider-ably across chromosomes (Via and West 2008; Weetmanet al.2012).
Describing chromosome inversions, recombination rate variation, and geneflow in full requires as close to chromosomal assemblies of the genomes of study species as possible. Recombination rate varies along chromosomes and is influenced by chromosome length (Fledel-Alon
et al.2009; Kawakamiet al.2014), and inversions are often hundreds of kilobases to megabases long. However, many draft genomes generated with short-read technologies contain thousands of scaffolds, often
Copyright © 2016 Daveyet al. doi: 10.1534/g3.115.023655
Manuscript received October 14, 2015; accepted for publication January 6, 2016; published Early Online January 15, 2016.
This is an open-access article distributed under the terms of the Creative Commons Attribution 4.0 International License (http://creativecommons.org/ licenses/by/4.0/), which permits unrestricted use, distribution, and reproduction in any medium, provided the original work is properly cited.
Supporting information is available online atwww.g3journal.org/lookup/suppl/ doi:10.1534/g3.115.023655/-/DC1
ENA project accessions: PRJEB11288, ERP005954 Dryad DOI: 10.5061/dryad.3s795
1Corresponding authors: Department of Zoology, University of Cambridge,
Downing Street, Cambridge, CB2 3EJ, United Kingdom. E-mails: jd626@cam.ac.uk and cj107@cam.ac.uk
2Present address: Department of Organismic and Evolutionary Biology, Harvard
University, 26 Oxford Street, Cambridge, MA 02138.
3Present address: Department of Biology, University of York, York, YO10 5DD,
without any chromosomal assignment (Bradnamet al.2013; Michael and VanBuren 2015; Richards and Murali 2015). Where scaffolds are assigned to chromosomes, often a substantial fraction of the genome is left unmapped, and scaffolds are often unordered or unoriented along the chromosomes.
To date, there are nine published Lepidopteran genomes [Bombyx mori(Duanet al.2010),Danaus plexippus(Zhanet al.2011),Heliconius melpomene(Heliconius Genome Consortium 2012),Plutella xylostella
(Youet al.2013),Melitaea cinxia(Aholaet al.2014),Papilio glaucus
(Conget al.2015a), Papilio polytes,Papilio xuthus(both Nishikawa
et al.2015), andLerema accius(Conget al.2015b)], and several more available in draft (Bicyclus anynana,Chilo suppressalis,Manduca sexta, andPlodia interpunctella; see LepBase version 1.0 athttp://ensembl. lepbase.org). Of these genomes, onlyB. mori,H. melpomene,P. xylostella, andM. cinxiahave scaffolds with chromosome assignments.
The publishedH. melpomenegenome (Heliconius Genome Con-sortium 2012; version 1.1 used throughout, referred to as Hmel1.1) contained 4309 scaffolds (“Hmel1.1”; Figure 1 and Table 1), 1775 of which were assigned to chromosomes based on a linkage map built using 43 RAD-Sequenced F2 offspring (Supplemental Information S4 in Heliconius Genome Consortium 2012). The total length of the ge-nome was 273 Mb, including 4 Mb of gaps, slightly smaller than the estimate of genome size byflow cytometry of 292 Mb +/2 2.4 Mb (Jiggins et al.2005), with 226 Mb (83%) of the genome assigned to chromosomes. The resulting map has been good enough for many purposes, including estimation of introgression of 40% of the ge-nome between H. melpomeneandH. cydno(Martinet al.2013), and identifying breakpoints betweenHeliconius,M. cinxia, andB. mori (Heliconius Genome Consortium 2012; Aholaet al. 2014). However, for understanding these features and mapping inversions and recombinations, Hmel1.1 has several limitations.
The original RAD Sequencing linkage map used to place scaffolds on chromosomes in Hmel1.1 was built using the restriction enzyme PstI (cut site CTGCAG), which cuts sites10 kb apart in theH. melpomene genome (32% GC content). Scaffolds shorter than 10 kb often did not contain linkage map single nucleotide polymorphisms (SNPs), and could not be placed on chromosomes. Also, misassemblies could be identified, but only corrected to within10 kb. With only 43 offspring used in the cross, the average physical distance between recombinations for Hmel1.1 was 320 kb. Scaffolds that could be mapped to a single linkage marker, but not more (and so did not span a recombination), could be placed on the linkage map but could not be anchored. Either only one scaffold would be placed at a single marker, and could not be oriented, or multiple scaffolds would be placed at a single marker, and could not be ordered or oriented. While 226 Mb (83%) of the genome was placed on chromosomes, only 73 Mb (27%) of the genome could be anchored (ordered and oriented). As 17% (46 Mb) of the genome could not be placed on the map, consecutive anchored scaffolds were not joined, as unplaced scaffolds may have been missing in between.
Although the primary Hmel1.1 assembly contained 4309 scaffolds, an additional 8077 scaffolds (69 Mb) were identified as haplotypes and re-moved from the assembly (Supplemental Information S2.4 in Heliconius Genome Consortium 2012;“Hmel1.1 with haplotypes”in Figure 1 and Table 1). These scaffolds contained 2480 genes, and have been used in several cases to manually bridge primary scaffolds and assemble im-portant regions of the genome (including the Hox cluster, Supplemental Information S10 in Heliconius Genome Consortium 2012). It seemed plausible that the assembly would be improved by better genome-wide incorporation of these haplotype scaffolds, rather than their removal.
Since Hmel1.1 was published, long-read technologies have matured to the point where high coverage with long reads can be used to produce
very high quality assemblies for small or haploid genomes (Berlinet al.
2015). Several tools are also available for scaffolding existing genomes with Pacific Biosciences (PacBio) sequence (Englishet al.2012; Boetzer and Pirovano 2014). However, these methods are limited by requiring single reads to connect scaffolds, whereas it is likely that many gaps sequenced by PacBio sequencing, but missed by Illumina and 454 se-quencing (Rosset al.2013), are longer than single reads. An alternative approach is to assemble the PacBio sequence, so that PacBio-unique sequence is retained, and then combine the PacBio assembly with the existing assembly, but tools for doing this have previously been lacking. Here, we present Hmel2, the second version of theH. melpomene
genome, which benefits from the use of three techniques to make substantial improvements to the genome assembly: whole genome sequencing of a pedigree, merging of haplotypic sequence, and in-corporation of assembled PacBio sequence into the genome (more details on assembly strategy can be found in Supporting Informa-tion,File S1; see Supporting Methods).
We have used Hmel2 to test the hypothesis that theHeliconius
genome underwent 10 chromosome fusions sinceHeliconiussplit from the neighboring genusEueidesover a period of about 6 million yr. It has been known for several decades that all 11Eueidesspecies have 31 chromosomes, whereas Heliconiusvary from 21 to 56 (Brownet al.
1992). It was previously thought thatHeliconiusgradually lost or fused 10 chromosomes via the Laparus and Neruda genera, which have chromosome numbers between 20 and 31, and had unresolved rela-tionships withEueidesandHeliconius(Beltránet al.2007). However, the most recent molecular taxonomy of the Heliconiini (Kozak et al.
2015) placesLaparusandNerudaas clades withinHeliconius, implying that the ancestral chromosome number ofHeliconiusis 21 and suggesting there are no extant species with intermediate chromosome numbers betweenEueidesandHeliconius. The change in chromosome number is due to fusions rather than loss, because the 31 chromosomes of
M. cinxiacan be mapped to the 21 chromosomes ofH. melpomene
(Aholaet al.2014). AsEueidesbutterflies also have 31 chromosomes, it seems most likely that these fusions happened since the split between
EueidesandHeliconius, but this has not yet been confirmed. Here, we use a small pedigree ofEueides isabellato test whether fusion points between
EueidesandHeliconiusmatch those betweenMelitaeaandHeliconius.
MATERIALS AND METHODS
Preparation of cross
were sequenced using 100-bp paired-end reads on an Illumina HiSeq2500 at the FAS Centre for Systems Biology genomics facility, Harvard University. Samples were sequenced over three HiSeq runs. Sequencing failed during sequencing of the second read for two li-braries together containing 24 individuals; these lili-braries were rese-quenced, but thefirst run data were still used, with the second read truncated to 65 bases to include only bases of comparable quality to thefirst read. This truncation had no effect on the mapping efficiency of these samples (all samples had percentage of mapped reads within 1% of the percentage of mapped reads for the resequenced run).
Alignment and SNP calling
Reads for parents and offspring were aligned to Hmel1.1 using Stampy (Lunter and Goodson 2011) version 1.0.23 with options -substitution-rate = 0.01 and—gatkcigarworkaround and converted from SAM to
BAM format with the SortSam tool from Picard version 1.117 (http:// broadinstitute.github.io/picard). Reads were aligned to the primary scaffolds (Hmel1-1_primaryScaffolds.fa), and haplotype scaffolds (Hmel_haplotype_scaffolds.fas) separately. Duplicate reads were re-moved using the Picard MarkDuplicates tool. Indels were realigned using the RealignerTargetCreator and IndelRealigner tools from GATK version 3.2.2 (DePristoet al.2011). SNPs were called for each individual using the GATK HaplotypeCaller and combined into onefinal VCF
file using GATK GenotypeGVCFs with options–annotateNDA and -max_alternate_alleles 30. Statistics on VCFfiles (Table A inFile S2, and
File S3) were calculated using VCFtools v0.1.11 (Daneceket al.2011).
Linkage map construction from SNPs
Full methods for constructing linkage maps, and reasoning behind the construction strategy can be found in Supporting Methods inFile S1(see alsoFigure S1). Briefly, SNPs were accepted only if they passed a set of
filters, including Mendelian segregation according to a root mean square test (Perkinset al.2011) for a set of valid marker types (Table B in File S2), genotype quality, mapping quality and strand bias. Accepted SNPs were collapsed to a set of maternal and paternal markers. As recombination is absent in Heliconiusfemales (Turner
and Sheppard 1975), the maternal markers acted as chromosome prints for each of the 21H. melpomenechromosomes. Paternal markers could then be assigned to chromosomes, where they were colocated with chromosome prints on genome scaffolds. MSTMap (Wuet al.2008) was used to build linkage maps for each chromosome using the paternal markers.
Preprocessing andfixing misassemblies in Hmel1.1
The primary and haplotype scaffolds of Hmel1.1 were concatenated together into one FASTAfile and then repeat masked using Repeat-Masker 4.0.5 (Smitet al.2013–2015), with theH. melpomeneversion 1.1 repeat library (Hmel.all.named.final.1-31.lib, Lavoieet al.2013) as input, and with options -xsmall and -no_is. Candidate misassemblies in Hmel1.1 were identified by detecting discontinuities in linkage map markers across genomic scaffolds, and then manually validated to identify the smallest possible breakpoint based on marker SNPs, in-cluding SNPs that were rejected from linkage map construction but could be assigned to one of the two markers around the breakpoint. Long misassembled regions (5 kb or greater) were retained as separate scaffolds, but most misassembled regions were discarded. Breakpoints that spanned two contigs or contained an entire contig were likely due to scaffolding errors; in these cases the scaffold was broken at the gap. If an entire contig was contained within a breakpoint, with no addi-tional SNP to link it to the markers on either side, it was discarded.
[image:4.603.50.439.42.304.2]Misassemblies corrected in version 1.1 were also revisited (Supple-mentary Information S4.6 in Heliconius Genome Consortium 2012). The linkage map used to place scaffolds for version 1.1 was built using RAD Sequencing data, with samples cut with the PstI restriction enzyme. This produces sites roughly 10 kb apart, which meant that many break-points were not identified accurately. Each of the misassemblies was reconsidered here, with all of the previously broken scaffolds remerged, and new breakpoints defined based on the whole genome mapping data. Errors in the linkage map were identified during the merging and reassembly processes described below. A list of linkage map errors was constructed, and erroneous blocks removed and corrected using a script, clean_errors.py.
Merging genome
HaploMerger version 20120810 (Huanget al.2012) was used to col-lapse haplotypes in theH. melpomenegenome. A scoring matrix for LASTZ (as used within HaploMerger) was generated using the lastz_D_Wrapper.pl script with–identity = 94. This scoring matrix was used for all runs of HaploMerger, including for the PacBio genome (see below). HaploMerger was run with default settings, except for setting- size = 20 in all_lastz.ctl, targetSize = 5,000,000 and querySize = 400,000,000 in hm.batchA.initiation_and_all_ lastz, and haploMergingMode=“updated” in hm.batchF.refine_ haplomerger_connections_and_Ngap_fillings.
Several scripts were written to make running HaploMerger easier. The new script runhm.pl executes one iteration of HaploMerger, running batch scripts A, B, C, E, F, and G, renaming output scaffolds with a given prefix, producing afinal FASTAfile concatenating merged scaffolds and unmerged scaffolds, and generating summary statistics (using summarizeAssembly.py in PBSuite 14.9.9, http://sourceforge. net/projects/pb-jelly/; Englishet al.2012), and an AGPfile for thefinal FASTA (using bespoke script agp_from_fasta.py). The HaploMerger script hm.batchG.refine_unpaired_sequences was not used for the ini-tial Hmel1.1 and PacBio assembly merges, retaining all potenini-tially re-dundant scaffolds in case they could be used for scaffolding later, but it was used to merge the haploid Hmel1.1 assembly with the haploid PacBio assembly. The new script batchhm.pl runs runhm.pl iteratively until HaploMerger fails to merge any further scaffolds. It also runs a set of additional new scripts, map_merge.py, transfer_merge.py, and transfer_features.py, that document where the original genome parts are in the new genome. The map_merge.py script takes HaploMerger output and documents where the input genome scaf-folds are in the merged output genome. The transfer_merge.py script takes this transfer information and another transferfile, for example between the original version 1.1H. melpomenegenome and the input genome, and computes the transfer from the original genome to the output genome. The transfer_features.py script then transfers linkage map markers, genes, and misassembly information to the new genome.
HaploMerger sometimes merges scaffolds incorrectly, but has several mechanisms for users to manually edit its output. The hm.nodesfile, which contains detected overlaps between scaffolds, can be manually annotated, with incorrect merges marked to be rejected. The revised hm.nodesfile is then passed through the batchE script to update the merged scaffolds to ignore the incorrect merges. Incorrect merges in the Heliconius genome could be detected by comparing against the linkage map data. A list of scaffolds that should not be merged was constructed over multiple merge attempts, and runhm.pl was used to edit the hm.nodes and run the batchE script automatically.
HaploMerger merges scaffolds based on overlaps, and reports the parts contributing to merged scaffolds in the hm.new_scaffoldsfile, including which of the two overlapping parts has been included in the new genome. These choices sometimes broke genes, whereas choosing the other part would retain the annotated gene. runhm.pl can also take a GFFfile as input, and check for broken genes in hm.nodes and hm. new_scaffolds, rejecting nodes if they break manually curated genes, and swapping parts in an overlap if it prevents gene breakage. It then runs the batchE and batchF to update the merged scaffolds. The Hmel1.1 GFF
files (heliconius_melpomene_v1.1_primaryScaffs_wGeneSymDesc.gff3 and Hmel1-0_HaplotypeScaffolds.gff) were concatenated and passed to runhm.pl to avoid as many breakages of Hmel1.1 genes as possible.
Pacific Biosciences sequencing, error correction, and assembly
A pupa from theH. melpomenegenome strain from Gamboa, Panama was dissected, and DNA extracted using the QIAGEN HMW MagAttract kit. This pupa was taken after four generations of in-breeding, and came from the same generation as the F0 father used to construct the pedigree reported here, and the generation before the individuals used for the genome sequence itself. A Pacific Biosciences (PacBio) SMRTbell 25kb needle sheared library was constructed, size-selected with 0.375x SPRI beads, and sequenced using P4/C2 chem-istry (180-min movie).
PacBio subreads were self-corrected with PBcR [in Celera assembly v8.3 (Berlinet al.2015)], run with options -length 200, -genomeSize 292,000,000), and separately corrected with the original genome strain Illumina (Sequence Read Archive accession SRX124669), 454 shotgun (SRX124544), and 454 3 kb mate-pair (SRX124545) sequencing data (using option -genomeSize 292,000,000). Self-corrected and genome-strain-corrected reads were concatenated into one read set, and assembled with FALCON (https://github.com/PacificBiosciences/ falcon, commit bb63f20d500efa77f930c373105edb5fbe37d74b, April 2, 2015) with options input_type = preads, length_cutoff = 500, length_cutoff_pr = 500, pa_HPCdaligner_option=“-v -dal4 -t16 -e.70 -l1000 -s1000”, ovlp_HPCdaligner_option=“-v -dal32 -t32 -h60 -e.95 -l500 -s1000, pa_DBsplit_option=“-x500 -s50”, ovlp_DBsplit_ option=“-x500 -s50”, falcon_sense_option=“–output_multi–min_ idt 0.70–min_cov 4–local_match_count_threshold 2–max_n_read 100–n_core 6”, overlap_filtering_setting=“–max_diff 40–max_cov 60–min_cov 2–bestn 10”.
The FALCON assembly was merged iteratively to exhaustion using batchhm.pl, as with version 1.1 of theH. melpomenegenome (see pre-vious section). Misassemblies in the PacBio assembly were identified using the same methods as Hmel1.1, and the merge was repeated several times to remove these misassemblies.
n Table 1 Statistics for genome assembly versions
Assembly Length(Mb) Scaffolds N50 NumberScaffold N50 LengthScaffold Contig N50Length (kb)
Hmel1.1 273 4309 345 194 kb 51
Hmel1.1 with haplotypes 343 12,386 567 128 kb 33
Hmel1.1 haploid 289 6689 346 214 kb 47
PacBio FALCON 325 11,121 719 96 kb 96
PacBio haploid 256 4565 345 178 kb 178
Hmel1.1 + PacBio 283 2961 113 629 kb 316
Hmel2 275 795 34 2.1 Mb 330
Scaffolding and gapfilling with PacBio assembly
Thefinal,‘haploid’merged Hmel1.1 and PacBio genomes were merged together using runhm.pl. For thisfinal merge, gapfilling in hm.batchF. refine_haplomerger_connections_and_Ngap_fillings was turned on, and runhm.pl edited hm.new_scaffolds to always select portions from the Hmel1.1 genome over portions from the PacBio genome, to pre-serve as much of the Hmel1.1 genome as possible, and use the PacBio genome for scaffolding only. Also, hm.batchG.refine_unpaired_sequences was run, and the refined FASTA output used, to remove as many redundant sequences from the resulting merged genome as possible. Finally, runhm.pl was run on the merged Hmel1.1+PacBio genome, to generate a set of nodes for use in scaffolding. Linkage map markers and genes were transferred to this final merged genome with transfer_features.py.
Cleaning merged assembly and ordering scaffolds along chromosomes
The Hmel1.1+PacBio merged genome was cleaned and ordered with reference to the linkage map markers. Scaffolds coming from the PacBio assembly alone were removed. If HaploMerger incorporates some portion P of a scaffold S into a merged scaffold, it retains the remaining portions of the scaffold as new scaffolds. These remaining portions were labeled offcuts. Offcuts were removed from the genome if they contained no markers on the linkage map, or if they mapped to the same chromosomal location as the merged scaffold containing their original portion P, assuming that the offcut is part of a haplotype. However, some offcuts that mapped to different chromosomal locations were retained, as they were often long portions of scaffolds that had been misassembled. Scaffolds were also removed if they mapped to a marker that mapped within a larger scaffold that featured surrounding markers; for example, if scaffold A has markers 1,2,3, and scaffold B has marker 2 only, scaffold B was removed as an assumed haplotype. Scaffolds were ordered along chromosomes based on their linkage markers. Pools of scaffolds were defined as containing one or more scaffold. If a pool contained a single scaffold that bridged multiple consecutive markers, the scaffold could be ordered and oriented, and so was labeled‘anchored’. A pool containing a single scaffold spanning only a single marker could be ordered on the chromosome but not oriented, and so was labeled‘unoriented’. A pool containing multiple scaffolds at a single marker was labeled‘unordered’, as the scaffolds could be neither ordered nor oriented against each other.
This order was refined by using the nodes (overlaps between pairs of scaffolds) identified by HaploMerger in the merged Hmel1.1+PacBio genome. HaploMerger does not use all the nodes it identifies, relying on a scoring threshold to reject low-affinity overlaps. While this is sensible when merging over a whole genome, many of these nodes proved to be useful when considering single pools, or neighboring pools, of scaffolds. Scaffolds that had a connecting node in a scaffold in a neighboring pool, which would mean that the scaffold was completely contained in the neighboring scaffold, were removed as likely haplotypes, providing that candidate haplotype scaffolds longer than 10 kb had a percentage alignment . 50%, and candidate haplotype scaffolds shorter than 10 kb had a percentage alignment .25%. If neighboring scaffolds had an overlapping node at their ends, or were bridged via nodes to a PacBio scaffold, they were ordered and oriented next to each other in the genome, connecting the scaffolds with a 100-bp gap.
Consecutive anchored scaffolds were connected together into one scaffold. This was not done during scaffolding for Hmel1.1, as with only 86% of the genome scaffolded, it was assumed that large scaffolds may have been missing between anchored scaffolds. However, with 98% of
the genome mapped for version 2, it was felt the connection of anchored scaffolds with a gap was reasonable.
After each chromosome was assembled, a set of unmapped scaffolds remained. These scaffolds were retained if they had a maternally infor-mative marker, but no paternally inforinfor-mative marker (and so could be placed on the chromosome but not ordered on it), or if they featured a gene. Otherwise, they were removed from thefinal genome.
Annotation transfer
Using transfer_features.py (see above), the Hmel1.1 gene annotation could be transferred directly to Hmel2. However, this revealed a number of avoidable gene breakages, where a haplotype scaffold had been incorporated in place of a primary scaffold, but the sequence was still the same or similar. CrossMap (version 0.1.8, http://crossmap. sourceforge.net) was used to transfer as many remaining annotations by alignment as possible, using HaploMerger to produce a chain map of Hmel1.1 against Hmel2 to use as input to CrossMap.
Identifying Eueides and Melitaea chromosome fusion points
E. isabellasubspecies (male dissoluta, female eva) were crossed in in-sectaries in Tarapoto, Peru. Parents were whole-genome-sequenced, and 21 F1 offspring were RAD sequenced using the PstI restriction enzyme on an Illumina HiSeq 2500. Offspring were separated by barcode using process_radtags from version 1.30 of Stacks (Catchen
et al.2011). Parents and offspring were aligned to Hmel2 using the same alignment pipeline described above except using GATK version 3.4-0, and Picard tools version 1.135. UnifiedGenotyper was used for SNP calling rather than HaplotypeCaller, as HaplotypeCaller does not perform well with RAD sequencing data. SNPs where the father was homozygous, the mother was heterozygous (or, for the Z chromosome, had a different allele to the father), and the offspring all had genotypes, were identified. The resulting segregation patterns were sorted by num-ber of SNPs. The most common segregation patterns and mirrors of these patterns were identified as chromosome prints, as no other pat-terns appeared at large numbers of SNPs, except for where all offspring were homozygous, or where the patterns were genotyping errors from the chromosome prints. The positions of the SNPs for each chromo-some print were then examined to identify fusion points, with clear transitions from one segregation pattern to another visible for all 10 fused chromosomes.
The fusion points inHeliconiusrelative toM. cinxiawere identified by running HaploMerger on a merge of Hmel2, and the M. cinxia
version 1 genome superscaffolds (Melitaea_cinxia_superscaffolds_ v1.fsa.gz, downloaded fromhttp://www.helsinki.fi/science/metapop/ research/mcgenome2_downloads.html on July 14, 2015). Overlaps (nodes) detected by HaploMerger between Hmel2 scaffolds and
M. cinxia superscaffolds were used to confirm synteny based on known chromosomal assignments of M. cinxiasuperscaffolds. All fusion points could be identified using this method except forHeliconius
chromosome 20, which was confirmed using progressiveMauve [as used by Ahola et al.(2014) to confirm synteny betweenH. melpomene,
M. cinxia, andB. mori; Mauve version 2.4.0 Linux snapshot 2015-02-13 used, Darlinget al.2010)].
Lepidopteran genome statistics
Lepidopteran genomes were downloaded from LepBase v1.0 (http:// ensembl.lepbase.org; B. mori version GCA_000151625.1, L. accius
for D. plexippus version 3 (http://monarchbase.umassmed.edu/ download/Dp_genome_v3.fasta.gz), P. polytes (http://papilio.nig. ac.jp/data/Ppolytes_genome.fa.gz), and P. xuthus (http://papilio. nig.ac.jp/data/Pxuthus_genome.fa.gz). Summary statistics were cal-culated using summarizeAssembly.py in PBSuite 14.9.9 (http:// sourceforge.net/projects/pb-jelly/; Englishet al.2012), and bespoke script genome_kb_plot.pl, used to calculate N50 values and make plots of number of scaffolds against cumulative genome length. BUSCO values were calculated using BUSCO v1.1b1 with the set of 2675 arthropod genes (Simão et al.2015) using generic Augustus parameters.
Genome size estimation from read alignments
To estimate the number of true bases in the genome, we followed Warr
et al. (2015) to calculate GC-content-adjusted read depths in 1-kb windows across Hmel2 (details on commands and scripts used can be found in the Dryad and GitHub repositories). BEDfiles containing scaffold positions and gap positions were constructed with Unix tools operating on the Hmel2 scaffold, and chromosome AGPfiles (in the Hmel2 distribution). Reads for F1 father were aligned to Hmel2 using the alignment pipeline described above (Stampy, MarkDuplicates, IndelRealigner). Windows of 1 kb were constructed using BEDTools makewindows [using BEDTools v2.25.0 (Quinlan 2014)]; windows containing gaps were removed using BEDTools intersect, and per-base read coverage across Hmel2 for the F1 father was calculated with BEDTools genomecov using the -d option.
Median read depth and GC content was calculated for each window using bespoke script calculate_read_depth_gc_windows.py, ignoring windows shorter than 1 kb. The bespoke script adjust_read_ depth_windows.py was then used to adjust read depth for each 1-kb windowwby a multiplying factorf, withfequal to the ratio of the overall median read depth across all windows, divided by the median read depth of all windows with the same GC percentage as window
w. The same script estimates genome size as the sum across all windows of the number of bases in each window w multiplied by the GC-adjusted median read depth forwdivided by the genome-wide median read depth.
Data availability
The Hmel2 genome is available from LepBase v1.0 (http://ensembl. lepbase.org). A distribution containing the genome and many supple-mentary files is available fromhttp://butterflygenome.org. Sequence reads from theH. melpomeneandE. isabellacrosses are available from the European Nucleotide Archive (ENA), accession PRJEB11288. Pa-cific Biosciences data are available from ENA accession ERP005954. All bespoke code is available inFile S3, and on GitHub athttps://github. com/johnomics/Heliconius_melpomene_version_2. A Dryad reposi-tory containing the Hmel2 distribution, a frozen version of the GitHub repository, VCF files for the H. melpomene andE. isabella crosses, marker databases, GC content and read depths for 1-kb windows, and intermediate genome versions for Hmel1-1 and the PacBio assem-blies is available athttp://dx.doi.org/10.5061/dryad.3s795.
RESULTS
Whole genome sequence genetic map
A genetic map of a full-sib cross betweenH. melpomene melpomene· H. melpomene rosinawas constructed to place scaffolds from version Hmel1.1 of theH. melpomenegenome on to chromosomes. The F0 grandmother, F1 parents, and 69 offspring were whole-genome-sequenced and aligned to Hmel1.1 (Table A in File S2). A total of
17.2 million raw SNPs (12,858,047 aligned to primary scaffolds, and 4,362,732 aligned to haplotype scaffolds) were filtered down to 2.9 million accepted SNPs (2,525,485 aligned to primary scaf-folds, and 431,488 aligned to haplotype scaffolds; Figure S2). The accepted SNPs were converted into 919 unique markers (full SNP counts and marker types shown in Table B inFile S2; see Supporting Methods inFile S1for further details). Offspring prepared with the Nextera kit were sequenced to a similar standard to offspring pre-pared with the TruSeq kit (Table A inFile S2). The linkage map built from these markers has 21 linkage groups, and a total map length of 1364.23 cM (Figure 2); 2749 of 4309 primary scaffolds, and 4062 of 8077 haplotype scaffolds contained marker SNPs, adding up to 268 Mb (98%) of the primary sequence, and 57 Mb (83%) of the haplotype sequence.
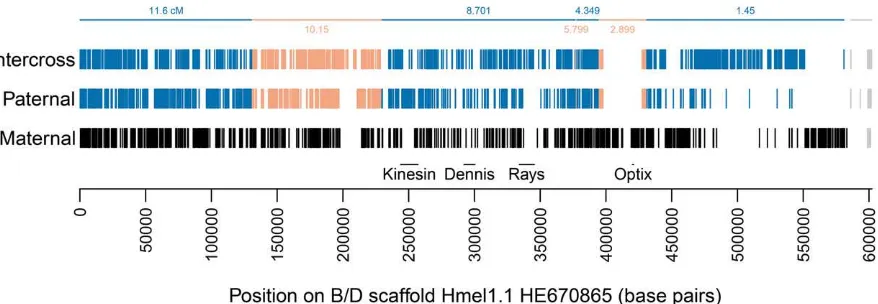
In addition to mapping the majority of the genome sequence to chromosomes, whole genome sequencing of a pedigree allows very accurate detection of crossovers and misassemblies. Identical SNPs could be concatenated into linkage blocks across scaffolds. For example, across the scaffold containing the B/D locus, which controls red patterning inHeliconius(Baxteret al.2010; Reedet al.2011; Wallbank
et al.2016), six crossovers were called, with an average gap of 344 bp between linkage blocks; a misassembly at the end of the scaffold was called with a gap of 2.9 kb (Figure 3). Across the genome, crossover and misassembly gaps have a mean size of 2.2 kb (SD 3.7 kb), all unmapped regions (crossover and misassembly gaps, unmapped scaf-fold ends, or whole unmapped scafscaf-folds) have a mean size of 2.5 kb (SD 5.1 kb), whereas mapped regions have a mean size of 28.4 kb (SD 62.7 kb) (seeFigure S3for distributions).
Based on this linkage information, 380 misassemblies were corrected in the genome. This included revisiting the 149 misassembliesfixed for Hmel1.1 (Supplementary Information S4.6 in Heliconius Genome Consortium 2012) to more accurately identify the breakpoints for these misassemblies, andfixing 231 newly discovered misassemblies.
Haplotype merging and scaffolding with PacBio sequencing
The Hmel1.1 primary and haplotype scaffolds were merged together using HaploMerger, iterating nine times until no further scaffolds could be merged, avoiding gene breakages where possible, and reverting merges where they conflicted with the linkage map. This produced a haploid genome containing 6689 scaffolds, length 289 Mb, N50 length 214 kb (“Hmel1.1 haploid”; Figure 1 and Table 1).
A 23x coverage of theH. melpomenegenome was generated using PacBio sequencing. These sequence reads were error-corrected once using the original Illumina and 454 data from the genome, and again using self-correction (Table C inFile S2). The two error-corrected read sets were combined and assembled together using FALCON to produce an initial assembly of 11,121 scaffolds, with N50 length 96 kb and total length 325 Mb (“PacBio FALCON”; Figure 1 and Table 1).
Ordering of scaffolds on chromosomes
Linkage information was transferred to the Hmel1.1+PacBio merged assembly, and used to place the resulting scaffolds on chromosomes, anchoring scaffolds wherever possible, connecting consecutive an-chored scaffolds, and removing remaining haplotypic scaffolds (see
Materials and Methodsfor details). Further scaffolds were joined by searching for connections to PacBio scaffolds unused by HaploMerger during the merge process. This left 641 scaffolds (274 Mb) placed on chromosomes (98.7% of the genome), with a further 869 scaffolds (3.6 Mb) unplaced; 154 (1.1 Mb) of the unplaced scaffolds were retained as they contained genes or had chromosome assignments (but no placement within the chromosome), and the remaining 715 scaffolds (2.5 Mb, 0.9%) were discarded.
Final assembly quality
Thefinal genome assembly, Hmel2, has 795 scaffolds, length 275.2 Mb, N50 length 2.1 Mb (Figure 1, Figure 2, Table 1, and Table 2), with 231 Mb (84%) anchored, and 274 Mb (99%) placed on chromosomes (Figure S4). This compares well with the other published Lepidopteran genome assemblies to date (Table 2 andFigure S5). BUSCO results (Table 2) indicate that 5% of arthropod BUSCOs (134 out of 2675 genes) are missing in Hmel2. In fact, BUSCO found BLAST and HMMER matches falling below the expected score threshold for all but 11 of these missing BUSCOs (Figure S6). Matches for missing BUSCOs were substantially shorter than complete BUSCOs (mean 31% of expected length, compared to mean 89% of expected length for complete BUSCOs;Figure S7); while these matches may be spuri-ous, it seems likely many of the missing BUSCOs are at least partially present in the assembly.
Thefinal Hmel2 genome size of 275.1 Mb with only 0.98 Mb of gaps is an improvement on Hmel1.1 (total size of 273.7 Mb with 4.1 Mb of gaps), adding 4.5 Mb of sequence to the assembly (Table 2); 246.9 Mb has been carried over from Hmel1.1 directly, with 17.1 Mb added from the haplotype scaffolds, and 11.2 Mb added from PacBio scaffolds. Of the filled Hmel1.1 gaps, the average difference in size between the Hmel1.1 gap and the Hmel2 filled region is mean 75 bp, median –117.5 bp; 62% of gaps have reduced in size, with 38% increased in size (full distribution shown inFigure S8).
Hmel2 is still smaller than the flow cytometry estimate of 292 Mb +/2 2.4 Mb (Jiggins et al. 2005). One reason for this
may be collapsed repeats across the genome. To test for this, we attempted to estimate the number of true bases in the genome for the F1 father by calculating the median per base read depth in 1-kb windows across the genome, and genome-wide (see Materials and Methods for full details). Assuming the genome-wide median read depth is the true diploid read depth, we adjusted the number of bases represented by each 1-kb window by multiplying 1000 by the ratio of window median read depth to genome-wide median read depth, ad-justed for GC content. The sum of the estimates of true bases across the genome was 288.7 Mb, but only 270.9 Mb of the assembly was included in this analysis, as windows shorter than 1 kb, or containing gaps, were removed. Adjusting to the total length of the genome assembly, the estimate of true bases is 293.3 Mb. This is within the range of theflow cytometry estimates, and indicates that most of the missing genome sequence is in collapsed repeats and could be ex-tended with more attention to these areas.
Improved assembly of major loci
The assembly of major adaptive loci is greatly improved in Hmel2, with all scaffolds containing known adaptive loci substantially extended and most gaps filled. The yellow color pattern locus Yb, previously on a 1.33-Mb scaffold, is now on a 1.96-Mb scaffold; the red pattern BD locus scaffold has increased from 602 kb to 1.89 Mb, and is now gap-free; the K locus, previously spread over two scaffolds totaling 173 kb, is now on a single 3-Mb scaffold; the Ac locus, previously on three scaf-folds totaling 838 kb, is now on a single 7.4-Mb scaffold; and the Hox cluster, previously manually assembled into seven scaffolds covering 1.4 Mb (Supplementary Information S10 in Heliconius Genome Consortium 2012), is now a single scaffold covering 1.3 Mb, with some misassembled material reassigned elsewhere. Full details of major locus locations in Hmel1.1 and Hmel2 (based on loci from Nadeauet al.
2014) can be found in Table D in File S2, with three previously unmapped minor loci now placed on chromosomes.
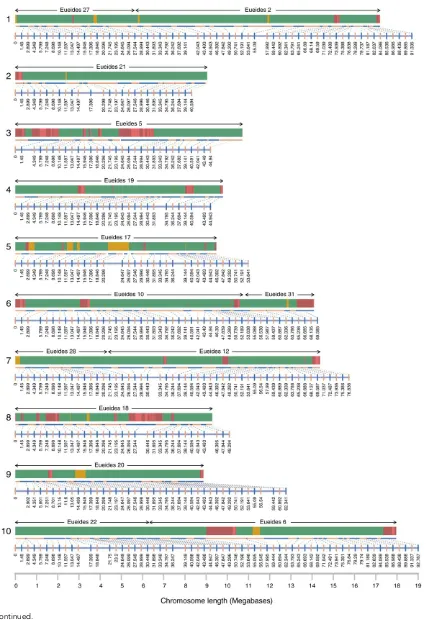
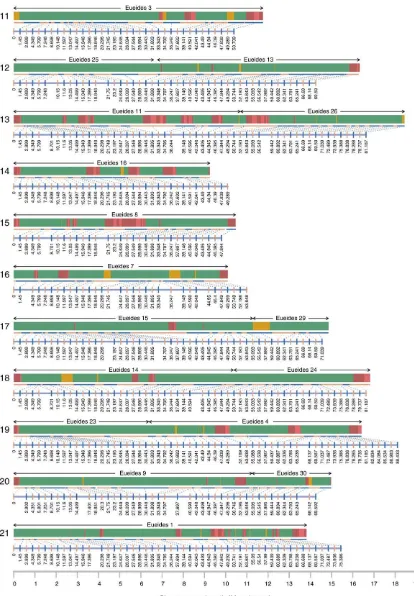
Chromosome fusions between Eueides and Heliconius
To identify chromosome fusion points betweenEueidesandHeliconius, chromosome prints for the 31Eueideschromosomes were discovered using RAD Sequencing data from anE. isabellacross aligned to the Hmel2 genome (Table E inFile S2). Synteny betweenHeliconiusand
[image:10.603.85.524.45.197.2]n Table 2 Genome assembly statistics for Hmel1.1, Hmel2, and other published Lepidopteran genomes
Hmel1.1 Hmel2 Bombyxmori plexippusDanaus Leremaaccius Melitaeacinxia glaucusPapilio polytesPapilio Papilioxuthus xylostellaPlutella
Scaffolds 4309 795 43,462 5397 29,988 8261 68,029 3873 5572 1819 Total
length (bp)
273,786,188 275,198,613 481,803,763 248,564,116 298,173,436 389,907,520 375,987,417 227,005,758 243,890,167 394,062,517
Mean scaffold size (bp)
63,538 346,161 11,085 46,055 9943 47,198 5526 58,612 43,770 216,636
Maximum scaffold size (bp)
1,451,426 9,352,983 16,203,812 6,243,218 3,082,282 668,473 1,977,235 9,881,032 16,292,344 3,493,687
Scaffold N50 length (bp)
194,302 2,102,720 4,008,358 715,606 525,349 119,328 230,299 3,672,263 6,198,915 737,182
Scaffold N90 length (bp)
38,051 273,111 61,147 160,499 60,308 29,598 2022 930,396 533,617 152,088
Scaffold N95 length (bp)
21,864 124,798 928 68,064 1913 16,097 945 417,439 160,478 72,492
Scaffold N50 number
345 34 38 101 160 970 421 21 16 155
Scaffold N90 number
1634 176 258 366 689 3396 7589 63 48 575
Scaffold N95 number
2105 251 5679 483 3385 4263 21,037 81 91 753
Contigs 11,607 3105 87,972 10,545 52,985 45,618 96,532 13,441 10,483 15,764 Mean contig
size (bp)
23,231 88,314 4907 22,939 5466 7914 3754 16,239 22,697 24,557
Contig N50 length
51,611 330,037 15,765 113,903 18,018 15,003 12,958 51,561 133,779 59,184
Gaps 7298 2310 44,510 5148 22,997 37,357 28,503 9568 4911 13,945 Total gap
length (bp)
4,132,701 981,612 50,083,569 6,664,276 8,535,705 28,877,732 13,599,067 8,725,522 5,949,704 6,937,203
Gap % 1.5 0.4 10.4 2.7 2.9 7.4 3.6 3.8 2.4 1.8
Complete BUSCOs %
81.6 85.5 75.5 87.1 77.7 55.8 75.8 76.7 84.2 75.0
Duplicated BUSCOs %
2.9 3.1 2.2 3.6 2.7 1.7 2.7 2.5 3.1 20.4
Fragmented BUSCOs %
11.1 9.5 16.1 10.1 13.9 20.6 14.6 12.3 8.3 11.8
Missing BUSCOs %
7.3 5.0 8.4 2.8 8.4 23.6 9.6 11.0 7.5 13.2
See Table 1 legend for definitions of N50 length and number. BUSCO (Benchmarking Universal Single-Copy Ortholog) values are based on a set of 2675 arthropod BUSCOs (Simãoet al.2015). Complete and duplicated BUSCOs are included in the count of complete single-copy BUSCOs. SeeMaterials and Methodsfor details of genomes and calculation of statistics.
704
|
J.
W.
Davey
et
Heliconiuschromosomes (Figure 4). TheEueidesfusion points all fall within theMelitaeafusion points reported by Aholaet al.(2014) and confirmed against Hmel2 here (Table F inFile S2), indicating that these fusions occurred since the split betweenEueidesandHeliconius. Major color pattern loci, and other adaptive loci (Nadeauet al.2014), are not near to fusion points, with the exception of theH. eratolocus Ro, which is 73 kb away from the chromosome 13 fusion point (Figure 4, and Table D inFile S2).
As noted by Aholaet al.(2014), the shorterMelitaeachromosomes (22–31) are all involved in fusions. The longerMelitaeaautosome in each fusion pair in Heliconius (Melitaea 2, 4, 6, 9–15; mean length 10.7 Mb, SD 688 kb) does not, on average, differ substantially in length to unfused autosomes (Melitaea3, 5, 7, 8, 16–21; mean length 9.9 Mb, SD 894 kb). In contrast, the shorterMelitaeaautosomes in each fusion pair in Heliconius (Melitaea 22–31) have mean length 5.4 Mb (SD 1.5 Mb), suggesting a bimodal distribution with the longMelitaea
autosomes, both fused and unfused, clustering together into one group, and the short fusedMelitaeaautosomes clustering into a second group.
DISCUSSION
Genome assembly improvements
Many long-range technologies are now available for improvement of existing draft genomes. Deep coverage with long reads can be sufficient for producing almost completede novoassemblies (Berlinet al.2015), and additional technologies such as optical mapping can substantially improve genome scaffolding and identify complex structural variants (Pendletonet al.2015; Englishet al.2015). However, it remains unclear how well these technologies will work with highly heterozygous nonmodel organisms.
Here, we show that even a small amount of PacBio data (20x coverage) was sufficient to substantially improve theH. melpomene
genome. Indeed, the assembly of the PacBio data alone was comparable in quality to our initial draft assembly constructed with Illumina, 454, and mate pair sequencing (Heliconius Genome Consortium 2012; compare lines“Hmel1.1 with haplotypes”and“PacBio FALCON”in Table 1 and Figure 1). We expect that increasing this coverage could have produced a very high quality genome with no additional data.
However, this does not deal with heterozygosity across the genome and the resulting generation of many haplotypic scaffolds—a problem
for most species and particularly for insects (Richards and Murali 2015). As sequencing methods improve and true haplotypes can be assembled, it is hoped that full diploid genomes can be produced, and several efforts are already moving toward this (Church et al.
2015;https://github.com/ekg/vg). We hope that, in the near future, it will be possible to assemble a diploid reference graph forH. melpomene, perhaps with the haplotypes reported here. However, as we wanted to preserve contiguity with Hmel1.1, which was already a composite of both haplotypes, Hmel2 remains a composite haploid genome.
[image:12.603.79.528.46.327.2]they introduced misassemblies that conflicted with the linkage map or broke genes, and iterate the use of HaploMerger to collapse as many scaffolds as possible. This allowed us to use HaploMerger to scaffold the existingHeliconiusgenome with our novel PacBio genome, by treating the two‘haploid’genomes as two haplotypes in one diploid genome. We could then modify the HaploMerger output to prefer the original Hmel1.1 genome over the PacBio genome, only using the PacBio ge-nome for scaffolding, and so preserve our original assembly and anno-tation wherever possible.
Hmel2 is not complete; it does not contain a W chromosome, and no chromosome is assembled into a single scaffold. The incomplete as-semblies may be partially due to errors in haplotype merging. The detailed linkage mapping information available for most scaffolds increases our confidence that primary and haplotype scaffolds have been accurately placed, but it may be that merging haplotypes has collapsed or removed some repetitive material. The majority of Hmel1.1 gapsfilled with haplotypic or PacBio sequence were reduced in size; thesefilled regions may be correct, but they may also indicate some reduction in repeat copy number. However, over 40% of gaps did increase in size, many substantially (for example, 6% of gaps increased by over 5 kb; see the sectionFinal assembly qualityinResults, and
Figure S8). Remaining gaps between scaffolds, and failures to order scaffolds, may be due to incorrect assembly of haplotypes at the ends of scaffolds, or due to genuine incompatibilities between the many individual butterflies that have contributed to the genome sequence, making it impossible tofind overlaps or connections between these ends. Several hundred small scaffolds remain in the genome, which are likely to be misassemblies of repetitive elements, but no clear metric could be found that excluded or integrated these scaffolds. However, as the positions of removed haplotypes have been recorded, it may be possible to reintegrate this material with further analysis of particular regions of the genome. Finally, the assembly remains shorter than theflow cytometry estimate of theH. melpomenegenome size, which appears to be due to collapsing of repetitive material (see the sectionFinal assembly qualityinResults). Further manual inspec-tion of existing data, PCRs across scaffold ends, addiinspec-tional long-read sequencing, or additional cross sequencing or optical mapping will hopefully resolve many of these remaining assembly problems.
Is Heliconius speciation rate driven by chromosome fusions?
Chromosome number varies widely in the Lepidoptera (Robinson 1971), and gradual transitions from one number to another occur frequently. Lepidopteran chromosomes are believed to be holocentric (Wolf 1994), which may make it easier for chromosome fusions and
fissions to spread throughout a population (Melterset al.2012). How-ever, the fusion of 20 chromosomes into 10 over 6 million yr (timing based on nodes infigure 1 of Kozaket al.2015) is the largest shift in chromosome number in such a short period across the Lepidoptera (Aholaet al.2014;figure 3A). Also, given the supposed ease of chro-mosome number transitions, it is unusual that chrochro-mosome number in the Nymphalinae and Heliconiinae is stable at 31 and 21 chromosomes respectively for the majority of species, in contrast to all other subfam-ilies, where chromosome number tends to fluctuate gradually and widely (Aholaet al.2014;figure 3B). WhileHeliconiusspecies do vary in chromosome number, the majority still have 21 chromosomes, with substantial variations only found in derived clades (Brownet al.1992; Kozaket al.2015). It is not just the transition in chromosome number but also the stability of chromosome number before and after the transition that requires explanation.
The difference in chromosome number confirmed here is a major difference between theHeliconiusandEueidesgenera, which may make these genera an excellent system for studying macroevolution and speciation. Kozaket al. (2015) demonstrated that speciation rate in
Heliconiusis significantly higher than inEueides, but the rate in both genera is more or less stable, and does not obviously relate to geological events or adaptive traits. The difference in chromosome number may contribute to explaining this difference in speciation rate.
Restriction of recombination facilitates speciation in the presence of geneflow (Butlin 2005). One of the major mechanisms for restricting recombination are chromosome inversions, where opposing alleles can become linked together, and then becomefixed in different populations (Kirkpatrick and Barton 2006; Farréet al.2013; Kirkpatrick and Barrett 2015). However, other methods of restricting recombination may produce similar effects.
Recombination rate is negatively correlated with chromosome length, although the relationship is complex (Fledel-Alonet al.2009; Kawakami et al. 2014). In many species, one obligate crossover is required for successful meiosis, inflating recombination rate in short chromosomes. However, beyond a certain length, recombination rate increases roughly linearly with chromosome length (Kawakamiet al.
2014). It is unclear whether these relationships will hold in Lepidoptera, which may have no obligate crossovers, as females do not recombine, and meiosis requires the formation of a synaptonemal complex rather than recombination (Wolf 1994).
It is possible that recombination rate along fused chromosomes in
Heliconius has decreased considerably compared to their shorter, unfused counterparts in Eueides(and Melitaea), particularly on the shorter chromosomes. This may have enabled linked pairs of diver-gently selected loci to accrue more easily inHeliconiusthan inEueides, making the process of speciation more likely (Nachman and Payseur 2012; Brandvainet al.2014). This hypothesis could be tested by gen-erating population sequence forEueidesspecies to compare to existing
Heliconiuspopulation data (such as Martinet al.2013), and by mod-eling speciation rates in the face of different recombination rates. Such a model could predict speciation rate differences between the genera, but full testing would also require the generation of accurate recombination rates in both genera. The system is particularly well suited for testing speciation rate effects because the set of 10 unfused autosomes can act as a control; the hypothesis predicts that recombination rate will not have changed substantially on these chromosomes.
This hypothesis demonstrates the pressing need to generate full, chromosomal genomes forEueidesand otherHeliconiusspecies; ge-nome size inH. eratois393 Mb (Tobleret al.2005), very similar to M. cinxia, but roughly 100 Mb larger thanH. melpomene. Unpub-lished draft genome sequences ofEueides tales, and otherHeliconius
species, suggest genome sizes similar to H. erato or larger, with
H. melpomene being one of the smallestHeliconiusgenomes (data not shown). Measuring recombination rate for other species against theH. melpomenegenome alone is therefore unlikely to be accurate, and may not allow for accurate modelfitting. However, with additional genomes in hand, we believe these genera may provide a useful test case for the influence of genome architecture on speciation and molecular evolution.
ACKNOWLEDGMENTS
Council (ERC) grant number 339873, Wellcome Trust grant number 098051, and J.W.D.’s Herchel Smith funding. H. melpomene cross sequencing was carried out at the Harvard FAS Center for Systems Biology core facility, and funded by Biotechnology and Biological Sciences Research Councilgrant number G006903/1.E. isabella breed-ing was supported by ERC grant StG-MimEvol, and Agence Nationale de la Recherche grant JCJC-HybEvol. Alignment and SNP calling was performed using the Darwin Supercomputer of the University of Cambridge High Performance Computing Service (http://www.hpc. cam.ac.uk/), provided by Dell Inc. using Strategic Research Infrastruc-ture Funding from the Higher Education Funding Council for England, and funding from the Science and Technology Facilities Council. J.W.D. is funded by a Herchel Smith Postdoctoral Research Fellowship.
Author contributions: J.W.D. and C.J. conceived the study. J.W.D. designed the analyses, wrote the software, extracted DNA for PacBio sequencing, and wrote the paper. F.S., K.K.D., and J.M. extracted DNA, prepared libraries, and whole genome sequenced the pedigree. L.M., R.M.M., and S.W.B. bred theH. melpomenecross. M.C. and M.J. bred theEueides isabellacross. S.L.B. and R.M.M. extracted DNA and made RAD libraries for the E. isabella cross. All authors read and commented on the manuscript.
LITERATURE CITED
Ahola, V., R. Lehtonen, P. Somervuo, L. Salmela, P. Koskinenet al., 2014 The Glanville fritillary genome retains an ancient karyotype and reveals selective chromosomal fusions in Lepidoptera. Nat. Commun. 5: 4737.
Baxter, S. W., N. J. Nadeau, L. S. Maroja, P. Wilkinson, B. A. Counterman
et al., 2010 Genomic hotspots for adaptation: the population genetics of
Müllerian mimicry in the Heliconius melpomene clade. PLoS Genet. 6: e1000794.
Beltrán, M., C. D. Jiggins, A. V. Z. Brower, E. Bermingham, and J. Mallet, 2007 Do pollen feeding, pupal-mating and larval gregariousness have a single origin in Heliconius butterflies? Inferences from multilocus DNA sequence data. Biol. J. Linn. Soc. Lond. 92: 221–239.
Berlin, K., S. Koren, C.-S. Chin, J. P. Drake, J. M. Landolinet al., 2015 Assembling large genomes with single-molecule sequencing and locality-sensitive hashing. Nat. Biotechnol. 33: 623–630.
Boetzer, M., and W. Pirovano, 2014 SSPACE-LongRead: scaffolding bac-terial draft genomes using long read sequence information. BMC Bioinformatics 15: 211.
Bradnam, K. R., J. N. Fass, A. Alexandrov, P. Baranay, M. Bechneret al., 2013 Assemblathon 2: evaluating de novo methods of genome assembly in three vertebrate species. Gigascience 2: 1–31.
Brandvain, Y., A. M. Kenney, L. Flagel, G. Coop, and A. L. Sweigart, 2014 Speciation and introgression betweenMimulus nasutusand Mimulus guttatus. PLoS Genet. 10: e1004410.
Brown, K. S., T. C. Emmel, P. J. Eliazar, and E. Suomalainen,
1992 Evolutionary patterns in chromosome numbers in neotropical Lepidoptera. Hereditas 117: 109–125.
Butlin, R. K., 2005 Recombination and speciation. Mol. Ecol. 14: 2621–2635.
Catchen, J. M., A. Amores, P. Hohenlohe, W. Cresko, and J. H. Postlethwait, 2011 Stacks: building and genotyping loci de novo from short-read sequences. G3 (Bethesda) 1: 171–182.
Church, D. M., V. A. Schneider, K. M. Steinberg, M. C. Schatz, A. R. Quinlan
et al., 2015 Extending reference assembly models. Genome Biol. 16: 13.
Cong, Q., D. Borek, Z. Otwinowski, and N. V. Grishin, 2015a Tiger swal-lowtail genome reveals mechanisms for speciation and caterpillar chemical defense. Cell Reports.10:910–919
Cong, Q., D. Borek, Z. Otwinowski, and N. V. Grishin, 2015b Skipper genome sheds light on unique phenotypic traits and phylogeny. BMC Genomics 16: 94.
Danecek, P., A. Auton, G. Abecasis, C. A. Albers, E. Bankset al., 2011 The variant call format and VCFtools. Bioinformatics 27: 2156–2158. Darling, A. E., B. Mau, and N. T. Perna, 2010 progressiveMauve: Multiple
genome alignment with gene gain, loss and rearrangement. PLoS One 5: e11147.
DePristo, M. A., E. Banks, R. Poplin, K. V. Garimella, J. R. Maguireet al., 2011 A framework for variation discovery and genotyping using next-generation DNA sequencing data. Nat. Genet. 43: 491–498.
Duan, J., R. Li, D. Cheng, W. Fan, X. Zhaet al., 2010 SilkDB v2.0: a platform for silkworm (Bombyx mori) genome biology. Nucleic Acids Res. 38: D453–D456.
English, A. C., S. Richards, Y. Han, M. Wang, V. Veeet al., 2012 Mind the gap: upgrading genomes with Pacific Biosciences RS long-read sequenc-ing technology. PLoS One 7: e47768.
English, A. C., W. J. Salerno, O. A. Hampton, C. Gonzaga-Jauregui, S. Ambreth
et al., 2015 Assessing structural variation in a personal genome—towards
a human reference diploid genome. BMC Genomics 16: 286.
Farré, M., D. Micheletti, and A. Ruiz-Herrera, 2013 Recombination rates and genomic shuffling in human and chimpanzee–a new twist in the chromosomal speciation theory. Mol. Biol. Evol. 30: 853–864. Feder, J. L., and P. Nosil, 2009 Chromosomal inversions and species
dif-ferences: when are genes affecting adaptive divergence and reproductive isolation expected to reside within inversions? Evolution 63: 3061–3075. Fledel-Alon, A., D. J. Wilson, K. Broman, X. Wen, C. Oberet al.,
2009 Broad-scale recombination patterns underlying proper disjunction in humans. PLoS Genet. 5: e1000658.
Heliconius Genome Consortium, 2012 Butterfly genome reveals promis-cuous exchange of mimicry adaptations among species. Nature 487: 94–98.
Huang, S., Z. Chen, G. Huang, T. Yu, P. Yanget al., 2012 HaploMerger: reconstructing allelic relationships for polymorphic diploid genome as-semblies. Genome Res. 22: 1581–1588.
Jiggins, C. D., J. Mavarez, M. Beltrán, W. O. McMillan, J. S. Johnstonet al., 2005 A genetic linkage map of the mimetic butterflyHeliconius
melpomene. Genetics 171: 557–570.
Joron, M., L. Frezal, R. T. Jones, N. L. Chamberlain, S. F. Leeet al., 2011 Chromosomal rearrangements maintain a polymorphic supergene controlling butterfly mimicry. Nature 477: 203–206.
Kawakami, T., L. Smeds, N. Backström, A. Husby, A. Qvarnströmet al., 2014 A high-density linkage map enables a second-generation collared flycatcher genome assembly and reveals the patterns of avian recombi-nation rate variation and chromosomal evolution. Mol. Ecol. 23: 4035–4058.
Kirkpatrick, M., and N. Barton, 2006 Chromosome inversions, local adaptation and speciation. Genetics 173: 419–434.
Kirkpatrick, M., and B. Barrett, 2015 Chromosome inversions, adaptive cassettes and the evolution of species’ranges. Mol. Ecol. 24: 2046–2055. Kozak, K. M., N. Wahlberg, A. F. E. Neild, K. K. Dasmahapatra, J. Mallet
et al., 2015 Multilocus species trees show the recent adaptive radiation
of the mimetic heliconius butterflies. Syst. Biol. 64: 505–524.
Lavoie, C. A., R. N. Platt, P. A. Novick, B. A. Counterman, and D. A. Ray, 2013 Transposable element evolution in Heliconius suggests genome diversity within Lepidoptera. Mob. DNA 4: 21.
Lowry, D. B., and J. H. Willis, 2010 A widespread chromosomal inversion polymorphism contributes to a major life-history transition, local adap-tation, and reproductive isolation. PLoS Biol.8:e1000500.
Lunter, G., and M. Goodson, 2011 Stampy: A statistical algorithm for sensitive and fast mapping of Illumina sequence reads. Genome Res. 21: 936–939.
Martin, S. H., K. K. Dasmahapatra, N. J. Nadeau, C. Salazar, J. R. Walters
et al., 2013 Genome-wide evidence for speciation with geneflow in
Heliconius butterflies. Genome Res. 23: 1817–1828.
Melters, D. P., L. V. Paliulis, I. F. Korf, and S. W. L. Chan, 2012 Holocentric chromosomes: convergent evolution, meiotic adaptations, and genomic analysis. Chromosome Res. 20: 579–593.
Nachman, M. W., and B. A. Payseur, 2012 Recombination rate variation and speciation: theoretical predictions and empirical results from rabbits and mice. Philos. Trans. R. Soc. Lond. B Biol. Sci. 367: 409–421. Nadeau, N. J., M. Ruiz, P. Salazar, B. Counterman, J. A. Medinaet al.,
2014 Population genomics of parallel hybrid zones in the mimetic butterflies,H. melpomeneandH. erato. Genome Res. 24: 1316–1333. Nam, K., and H. Ellegren, 2012 Recombination drives vertebrate genome
contraction. PLoS Genet. 8: e1002680.
Nishikawa, H., T. Iijima, R. Kajitani, J. Yamaguchi, T. Andoet al., 2015 A genetic mechanism for female-limited Batesian mimicry in Papilio butterfly. Nat. Genet. 47: 405–409.
Noor, M. A., K. L. Grams, L. A. Bertucci, and J. Reiland,
2001 Chromosomal inversions and the reproductive isolation of species. Proc. Natl. Acad. Sci. USA 98: 12084–12088.
Pendleton, M., R. Sebra, A. W. C. Pang, A. Ummat, O. Franzenet al., 2015 Assembly and diploid architecture of an individual human genome via single-molecule technologies. Nat. Methods 12: 780–786. Perkins, W., M. Tygert, and R. Ward, 2011 Computing the confidence
levels for a root-mean-square test of goodness-of-fit. Appl. Math. Comput. 217: 9072–9084.
Quinlan, A. R., 2014 BEDTools: The Swiss-Army Tool for Genome Feature Analysis. Curr. Protoc. Bioinformatics47:11.12.1–11.12.34.
Reed, R. D., R. Papa, A. Martin, H. M. Hines, B. A. Countermanet al., 2011 Optix drives the repeated convergent evolution of butterfly wing pattern mimicry. Science 333: 1137–1141.
Richards, S., and S. C. Murali, 2015 Best practices in insect genome sequencing: what works and what doesn’t. Curr. Opin. Insect Sci. 7: 1–7. Robinson, R., 1971 Lepidoptera Genetics, Pergamon Press, Oxford. Ross, M. G., C. Russ, M. Costello, A. Hollinger, N. J. Lennonet al.,
2013 Characterizing and measuring bias in sequence data. Genome Biol. 14: R51.
Simão, F. A., R. M. Waterhouse, P. Ioannidis, E. V. Kriventseva, and E. M. Zdobnov, 2015 BUSCO: assessing genome assembly and annotation completeness with single-copy orthologs. Bioinformatics 31: 3210–3212.
Smit, A. F. A., Hubley, R., and Green, P., 2013–2015 RepeatMasker Open-4.0. http://www.repeatmasker.org. Accessed: 4 February 2016.
Tobler, A., D. Kapan, N. S. Flanagan, C. Gonzalez, E. Petersonet al., 2005 First-generation linkage map of the warningly colored butterfly Heliconius erato. Heredity 94: 408–417.
Turner, J. R. G., and P. M. Sheppard, 1975 Absence of crossing-over in female butterflies (Heliconius). Heredity 34: 265–269.
Via, S., and J. West, 2008 The genetic mosaic suggests a new role for hitchhiking in ecological speciation. Mol. Ecol. 17: 4334–4345. Wallbank, R. W. R., S. W. Baxter, C. Pardo-Diaz, J. J. Hanly, S. H. Martin
et al., 2016 Evolutionary Novelty in a Butterfly Wing Pattern through
Enhancer Shuffling. Plos. Bio.l 14: e1002353.
Wang, J., Y. Wurm, M. Nipitwattanaphon, O. Riba-Grognuz, Y.-C. Huang
et al., 2013 A Y-like social chromosome causes alternative colony
organization infire ants. Nature 493: 664–668.
Warr, A., C. Robert, D. Hume, A. L. Archibald, N. Deebet al., 2015 Identification of low-confidence regions in the pig reference genome (Sscrofa10.2). Front. Genet. 6: 217.
Weetman, D., C. S. Wilding, K. Steen, J. Pinto, and M. J. Donnelly, 2012 Geneflow–dependent genomic divergence betweenAnopheles
gambiaeM and S forms. Mol. Biol. Evol. 29: 279–291.
Wolf, K. W., 1994 The unique structure of Lepidopteran spindles. Int. Rev. Cytol. 152: 1–48.
Wu, Y., P. R. Bhat, T. J. Close, and S. Lonardi, 2008 Efficient and accurate construction of genetic linkage maps from the minimum spanning tree of a graph. PLoS Genet. 4: e1000212.
You, M., Z. Yue, W. He, X. Yang, G. Yanget al., 2013 A heterozygous moth genome provides insights into herbivory and detoxification. Nat. Genet. 45: 220–225.
Zhan, S., C. Merlin, J. L. Boore, and S. M. Reppert, 2011 The monarch butterfly genome yields insights into long-distance migration. Cell 147: 1171–1185.