White Rose Research Online URL for this paper: http://eprints.whiterose.ac.uk/123073/
Version: Accepted Version
Article:
Guye, S., De Simoni, C. and von Bastian, C.C. (2017) Do individual differences predict change in cognitive training performance? A latent growth curve modeling approach. Journal of Cognitive Enhancement. ISSN 2509-3290
https://doi.org/10.1007/s41465-017-0049-9
[email protected] https://eprints.whiterose.ac.uk/
Reuse
Items deposited in White Rose Research Online are protected by copyright, with all rights reserved unless indicated otherwise. They may be downloaded and/or printed for private study, or other acts as permitted by national copyright laws. The publisher or other rights holders may allow further reproduction and re-use of the full text version. This is indicated by the licence information on the White Rose Research Online record for the item.
Takedown
If you consider content in White Rose Research Online to be in breach of UK law, please notify us by
The final publication is available at link.springer.com via
http://dx.doi.org/10.1007/s41465-017-0049-9
Do Individual Differences Predict Change in Cognitive Training Performance?
A Latent Growth Curve Modeling Approach
Sabrina Guye
Carla De Simoni
University of Zurich
Claudia C. von Bastian
Bournemouth University
Author Note
Sabrina Guye, University Research Priority Program (URPP) “Dynamics of Healthy
Aging”, University of Zurich, Switzerland; Carla De Simoni, Department of Psychology,
University of Zurich, Switzerland; Claudia C. von Bastian, Department of Psychology,
Bournemouth University, United Kingdom.
Claudia C. von Bastian is now at the Department of Psychology, University of Sheffield,
United Kingdom.
Data reported in this work has been collected with the support of grants awarded to the
(Ref 2014/32; 2016/08). The first author was further supported by the Forschungskredit of the
University of Zurich (FK-16-062), and the second author by the Swiss National Science
Foundation (No. 100014_146074). Moreover, both authors were supported by the URPP
“Dynamics of Healthy Aging” of the University of Zurich.
During the work on her dissertation, Sabrina Guye was a pre-doctoral fellow of the
International Max Planck Research School on the Life Course (LIFE; participating institutions:
MPI for Human Development, Humboldt-Universität zu Berlin, Freie Universität Berlin,
University of Michigan, University of Virginia, University of Zurich).
Correspondence concerning this article should be addressed to Sabrina Guye, University
of Zurich, University Research Priority Program “Dynamics of Healthy Aging”, Andreasstrasse
Abstract
Cognitive training interventions have become increasingly popular as a potential means to
cost-efficiently stabilize or enhance cognitive functioning across the lifespan. Large training
improvements have been consistently reported on the group level, with, however, large
differences on the individual level. Identifying the factors contributing to these individual
differences could allow for developing individually-tailored interventions to boost training gains.
In this study, we therefore examined a range of individual differences variables that had been
discussed in the literature to potentially predict training performance. To estimate and predict
individual differences in the training trajectories, we applied Latent Growth Curve models to
existing data from three working memory training interventions with younger and older adults.
However, we found that individual differences in demographic variables, real-world cognition,
motivation, cognition-related beliefs, personality, leisure activities, and computer literacy and
training experience were largely unrelated to change in training performance. Solely baseline
cognitive performance was substantially related to change in training performance and
particularly so in young adults, with individuals with higher baseline performance showing the
largest gains. Thus, our results conform to magnification accounts of cognitive change.
Keywords: working memory training, individual differences, latent growth curve
Do Individual Differences Predict Change in Cognitive Performance? A Latent Growth Curve
Modeling Approach
Over the past decade, there has been an exploding interest in computer-based commercial
“brain training” programs and in scientific evidence relating to the effectiveness of such
interventions, triggered by promising results of working memory (WM) training gains
generalizing to previously untrained cognitive abilities such as intelligence in both younger (e.g.,
Jaeggi, Buschkuehl, Jonides, & Perrig, 2008) and older adults (e.g., Borella, Carretti, Riboldi, &
De Beni, 2010). Although the idea of improving general cognitive functioning within a few
weeks is enticing, there is also accumulating evidence against a generalized effect of WM
training (e.g., Clark, Lawlor-Savage, & Goghari, 2017; De Simoni & von Bastian, 2017; Guye &
von Bastian, 2017; Sprenger et al., 2013). Even on the meta-analytic level, evidence is mixed
regarding the effectiveness of cognitive training in both younger and older adults (e.g., Au et al.,
2015; Dougherty, Hamovitz, & Tidwell, 2016; Karbach & Verhaeghen, 2014; Kelly et al., 2014;
Lampit, Hallock, & Valenzuela, 2014; Melby-Lervåg & Hulme, 2013; Melby-Lervåg, Redick, &
Hulme, 2016; Schwaighofer, Fischer, & Bühner, 2015; Soveri, Antfolk, Karlsson, Salo, & Laine,
2017). Aside from design and methodological choices potentially explaining the diverging
findings (e.g., Noack, Lövdén, Schmiedek, & Lindenberger, 2009; Shipstead, Redick, & Engle,
2012), many authors increasingly articulated the potentially important influence of individual
differences on cognitive training trajectories and outcomes (e.g., Buitenweg, Murre, &
Ridderinkhof, 2012; Guye, Röcke, Mérillat, von Bastian, & Martin, 2016; Könen & Karbach,
2015; Shah, Buschkuehl, Jaeggi, & Jonides, 2012; von Bastian & Oberauer, 2014)
Individual differences in cognitive functioning (e.g., Ackerman & Lohman, 2006) and
Holland, & McInnes, 2004), and have been shown to be related to personality (e.g., Graham &
Lachman, 2012), cognition-related beliefs such as need for cognition (NFC; e.g., Fleischhauer et
al., 2010; Hill et al., 2013), and everyday life activities (e.g., Jopp & Hertzog, 2007).
Investigating which of these individual differences potentially predict cognitive training
outcomes may not only explain inconsistencies concerning the effectiveness of cognitive
training, but also identify possible subgroups of individuals that are more or less responsive to
cognitive training, thereby constituting the conceptual groundwork for developing
individually-tailored interventions to boost training effectiveness.
Predictors of Cognitive Training Outcomes
As yet, only few studies have examined how individual differences are associated with
cognitive training outcomes (see Katz, Jones, Shah, Buschkuehl, & Jaeggi, 2016 for an
overview), with most existing studies relating training outcomes to demographic variables (e.g.,
age), baseline cognitive performance, motivation, cognition-related beliefs (e.g., theories of
intelligence; TIS) and personality traits (e.g., neuroticism and conscientiousness).
So far, the effect of age on training outcomes has received the most attention.
Age-comparative studies mostly reported larger training effects in younger than in older adults (e.g.,
Brehmer, Westerberg, & Bäckman, 2012; Bürki, Ludwig, Chicherio, & de Ribaupierre, 2014;
Schmiedek, Lövdén, & Lindenberger, 2010; von Bastian, Langer, Jäncke, & Oberauer, 2013),
and in young-old adults compared to old-old adults (e.g., Borella et al., 2014; Zinke et al., 2014).
These results are in line with the notion of a magnification effect (also known as amplification or
Matthew effect; Kliegl, Smith, & Baltes, 1990; Lövdén, Brehmer, Li, & Lindenberger, 2012;
Verhaeghen & Marcoen, 1996), suggesting that younger individuals benefit more from cognitive
completing the training tasks. However, other studies found that children and older adults
benefited more from training than young adults (e.g., Bherer et al., 2008; Karbach & Kray,
2009). Such compensation effects have been argued to emerge as participants with lower initial
cognitive status have more room for improvement (see Titz & Karbach, 2014 for a review).
These diverging findings are reflected by recent meta-analyses, with some reporting evidence for
age being a moderator of training outcomes (e.g., Melby-Lervåg & Hulme, 2013) and others not
(e.g., Karbach & Verhaeghen, 2014; Schwaighofer et al., 2015). A closely related, yet potentially
distinct factor possibly contributing to these mixed findings is general cognitive functioning (von
Bastian & Oberauer, 2014). Only few studies have directly assessed the effect of baseline
cognitive performance on training outcomes though, with some evidence suggesting that initially
low-performing individuals benefit more from training (e.g., Jaeggi et al., 2008; Zinke et al.,
2014), but others reported opposite effects (e.g., Bürki et al., 2014).
Although motivation is arguably one of the most plausible factors possibly influencing
cognitive training outcomes, its association with training performance has not yet been
comprehensively examined. One exception is a study by Brose, Schmiedek, Lövdén, and
Lindenberger (2012), who reported a positive association between daily motivation and daily
cognitive performance on a 3-back task, indicating that on days on which task-related motivation
was lower than on average, daily cognitive performance was also reduced. Some studies have
investigated the effect of related concepts, including cognition-related beliefs such as
individuals’ beliefs about the malleability of intelligence (TIS; Dweck, 2000). For instance,
Jaeggi, Buschkuehl, Shah, and Jonides (2014) found that, irrespective of training intervention
(control or experimental intervention), the group of individuals indicating high beliefs in the
individuals who believed that intelligence cannot be changed (but see Thompson et al., 2013).
Due to the fact that the groups were determined by median split, these results should, however,
be interpreted with caution, as median split and extreme group analyses can potentially inflate
the effect sizes and consequently overestimate the importance of a given effect (Moreau, Kirk, &
Waldie, 2016; Unsworth et al., 2015). Indeed, other studies have not found an association of
cognition-related beliefs with training outcomes (Minear et al., 2016; Sprenger et al., 2013).
Finally, there is some evidence for personality traits being related to training outcomes. It
has been reported that conscientiousness is positively related to training performance, but
negatively to far transfer effects (Studer-Luethi, Jaeggi, Buschkuehl, & Perrig, 2012). Further,
neuroticism has been found to be negatively associated with mean training performance (but not
training gain; Studer-Luethi, Bauer, & Perrig, 2016; Studer-Luethi et al., 2012) and transfer
effects (Studer-Luethi et al., 2012; 2016; see also Urbánek & Marček, 2015 for similar results
using the Personality System Interaction personality factors), except when training task
complexity is low (Studer-Luethi et al., 2012).
In sum, there is some tentative evidence that individual differences may predict training
performance and transfer effects. Studies attempting to estimate the role of individual differences
based on sufficiently large training samples and continuous predictors are, however, scarce.
Further, some individual differences have been entirely neglected, including cognitive
performance in real-world context (e.g., education), training-related leisure activities (e.g.,
gaming), and computer literacy or previous training experience.
The Present Study
The goal of this study was to enhance the understanding of who benefits from cognitive
(1) the individual cognitive training trajectories, (2) the association of baseline cognitive
performance with change in training performance, and (3) which individual differences predicted
change in training performance.
We reanalyzed three data sets obtained from two randomized-controlled, double-blind
WM training studies investigating two WM interventions in younger (De Simoni & von Bastian,
2017) and one in older adults (Guye & von Bastian, 2017). Observed improvements in the
trained tasks were substantial in size and in line with numerous studies consistently reporting
training effects across a wide variety of training regimes and trained abilities (e.g., Karbach &
Verhaeghen, 2014). The two training studies were similar regarding the included questionnaires
assessing individual differences potentially predicting training performance, and the training
regimen itself (i.e., trained tasks, training duration, frequency, adaptive task difficulty, and nature
of the control group). In the first study (De Simoni & von Bastian, 2017), younger adults
received either of two single-paradigm WM training interventions (i.e., memory updating and
binding training). In the second study (Guye & von Bastian, 2017), older adults received a
mixed-paradigm WM training intervention, consisting of a memory updating, a binding, and a
complex span task. All three interventions were adaptive, with the level of difficulty increasing
depending on individuals’ performance.
To estimate the training trajectories, we fitted LGC models to the data recorded during
training. LGC modeling uses structural equation modeling (SEM) to estimate interindividual
differences in intraindividual change over time. LGC modeling is highly flexible as it can handle
a variety of methodological issues typically occurring in training research such as partially
missing data, non-normally distributed data, or non-linear change trajectories (Curran, Obeidat,
and to provide separate latent estimates for baseline cognitive performance (i.e., the intercept)
and change in training performance (i.e., the slope). The distinction between the two latent
factors allows for estimating how baseline cognitive performance is related to change in
performance, with a positive relationship reflecting magnification, and a negative relationship
reflecting compensation effects. Further, to investigate how the individual differences variables
are associated with the intercept and the slope, we extended the LGC models by predicting the
variance in baseline cognitive performance and, more importantly, change in training
performance by (1) demographic variables, (2) real-world cognition, (3) motivation, (4)
cognition-related beliefs, (5) personality, (6) leisure activities, and (7) computer literacy and
training experience.
Statistical evidence for the predictive value of baseline cognitive performance and each of
the individual differences variables was evaluated using Bayes factors (BF). The BF is a
statistical index ranging from 0 to infinity and quantifies the strength of evidence for one
hypothesis (usually the alternative hypothesis H1, postulating the presence of an association)
compared to another hypothesis (usually the null hypothesis H0, postulating the absence of an
association). Hence, BFs allow for evaluating the strength of evidence not only for the presence
of an association, but explicitly also for the absence of a proposed association. Accordingly,
using BFs has become increasingly popular in the area of cognitive enhancement (e.g., Antón et
al., 2014; Clark, Lawlor-Savage, & Goghari, 2017; De Simoni & von Bastian, 2017; Guye & von
Bastian, 2017; Kirk, Fiala, Scott-Brown, & Kempe, 2014; Paap, Johnson, & Sawi, 2014;
Sprenger et al., 2013; von Bastian, Guye, & De Simoni, 2017; von Bastian & Oberauer, 2013).
Based on previous findings, we expected positive associations of motivation (Brose et al.,
with change in training performance. Regarding neuroticism, our expectations were less specific,
given that previous literature reported evidence for a negative association of neuroticism with
mean training performance and transfer effects, but not with training gains (e.g., Studer-Luethi et
al., 2012; 2016). Based on the results by Bürki et al. (2014), methodologically the most similar
study to our own, we expected a negative association of age and a positive association of
baseline cognitive performance with change in cognitive performance, which would support the
magnification hypothesis. For all the other individual differences variables, the analyses were
exploratory.
Method
Detailed methods regarding the training interventions have been reported previously (De
Simoni & von Bastian, 2017; Guye & von Bastian, 2017). In the following, we summarize the
key characteristics of each study’s methodology with a focus on the individual differences
measures.
Participants
The final sample sizes ranged from 58 to 68 (see Table 1 for detailed sample description).
The Young-Updating and Young-Binding samples were drawn from a study of healthy younger
participants aged between 18 – 36 years, and the Old-Mixed sample was drawn from a study of
healthy older participants aged between 65 – 80 years. Younger participants were recruited
through the participant pool of the Department of Psychology of the University of Zurich,
postingsat the university campus, and short study presentations during lectures. Older
participants were recruited through the participant pool of the University Research Priority
Program “Dynamics of Healthy Aging”, lectures at the Senior Citizens’ University of Zurich,
speakers and had a computer with Internet connection at home. Written informed consent was
obtained from all participants. Both studies were approved by the ethics committee of the
Department of Psychology of the University of Zurich. After study completion, younger
participants received either CHF 120 (approx. USD 120) or CHF 20 (USD 20) plus 10 course
credits, moreover, they could earn a bonus up to a maximum of 50 CHF (USD 50), depending on
the level of difficulty that they reached during training. Older participants received CHF 150
(approx. USD 150).
Younger participants reported no current psychiatric or neurological disorders,
psychotropic drug use, or color blindness. Older participants also reported no current psychiatric
or neurological disorders, psychotropic drug use, and no significant motor, hearing or vision
impairments. Further, they were screened for color blindness (Ishihara, 1917), subclinical
depression (GDS; Sheikh & Yesavage, 1986: cut-off criterion = 4), and cognitive impairment
Table 1
Demographics of Study Participants
Sample
Demographics Young-Updating Young-Binding Old-Mixed
Sample size (n) 58 64 68
Intervention Memory updating Binding Mixed-paradigm
Age 22.57 (2.99) 24.77 (4.03) 70.40 (3.72)
Gender (f/m) 39/19 45/19 30/38
Education a 5 (0.00) 5 (0.00) 5 (1.48)
MMSE score - - 29.21 (0.76)
GDS score - - 0.65 (1.02)
Note. Values are means and standard deviations in parentheses (median and median
absolute deviation in parentheses for education).
a The scale for education ranged from 0 (no formal education) to 7 (doctorate).
Studies and Material
Cognitive training interventions. Training procedures were identical for the three
samples if not mentioned otherwise. Tatool was used to deliver the self-administered training
interventions at home and to monitor participants’ training compliance (von Bastian, Locher, &
Ruflin, 2013). The default adaptive score and level handler implemented in Tatool was used to
adjust task difficulty to participants’ performance throughout the training phase. Both the set size
(i.e., number of memoranda) and the response time limit varied depending on the level of task
difficulty (see below). Younger participants completed 20 sessions of WM training (30-45
minutes per session) within five weeks. Each training session consisted of 12 trials per task in the
Young-Updating sample and 24 trials per task in the Young-Binding sample. Interventions
sample) and verbal, spatial, visual, and numerical binding tasks (Young-Binding sample). Both
younger samples trained each task for a maximum of 11.25 min per session. Older participants
completed 25 sessions of WM training (30-45 minutes per session) within five weeks, with the
intervention consisting of a complex span, a binding, and a memory updating task each of which
contained visuo-spatial memoranda. Each task was trained for a maximum of 15 min per session,
with each session consisting of 15 trials per task. Set size achieved at the end of each session and
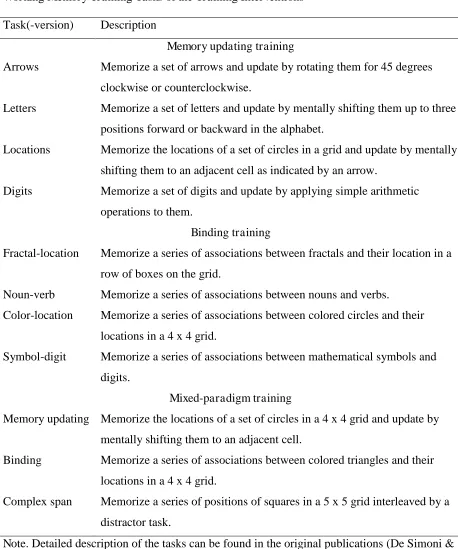
Table 2
Working Memory Training Tasks of the Training Interventions
Task(-version) Description
Memory updating training
Arrows Memorize a set of arrows and update by rotating them for 45 degrees
clockwise or counterclockwise.
Letters Memorize a set of letters and update by mentally shifting them up to three
positions forward or backward in the alphabet.
Locations Memorize the locations of a set of circles in a grid and update by mentally
shifting them to an adjacent cell as indicated by an arrow.
Digits Memorize a set of digits and update by applying simple arithmetic
operations to them.
Binding training
Fractal-location Memorize a series of associations between fractals and their location in a
row of boxes on the grid.
Noun-verb Memorize a series of associations between nouns and verbs.
Color-location Memorize a series of associations between colored circles and their
locations in a 4 x 4 grid.
Symbol-digit Memorize a series of associations between mathematical symbols and
digits.
Mixed-paradigm training
Memory updating Memorize the locations of a set of circles in a 4 x 4 grid and update by
mentally shifting them to an adjacent cell.
Binding Memorize a series of associations between colored triangles and their
locations in a 4 x 4 grid.
Complex span Memorize a series of positions of squares in a 5 x 5 grid interleaved by a
distractor task.
Note. Detailed description of the tasks can be found in the original publications (De Simoni &
Updating training. The Young-Updating sample practiced four memory updating tasks
(adapted from Lewandowsky, Oberauer, Yang, & Ecker, 2010). In these tasks, participants had
to memorize a set of stimuli presented simultaneously for 500 ms per item. In the subsequent
updating phase, participants had to transform individual memoranda (e.g., mentally rotate
previously memorized arrows or applying a simple arithmetic operation to a number), enter the
result of the transformation, and remember that result of the transformation. In half of the trials, a
cue presented for 500 ms indicated which of the memorandum had to be updated. After nine
updating steps, participants had to recall the most recent result of each stimulus. Task difficulty
was adjusted to individual performance by increasing the set size (i.e., number of simultaneously
presented memoranda) and reducing the time limit to respond to the updating prompts.
Binding training. The Young-Binding sample practiced four binding tasks (adapted from
Wilhelm, Hildebrandt, & Oberauer, 2013). In these tasks, participants had to remember
associations between elements (e.g., noun and verbs or objects and their locations in a grid)
presented sequentially for 900 ms (noun-verb and symbol-digit) or 1800 ms (fractal-location and
color-location) each. After memorization, each association was probed in random order with one
of the elements given as cue. Half of the probes were positive (i.e., exact matches), whereas
negative probes could be distractors (i.e., probes not presented in the current trial; 25 % of
probes) or intrusions (i.e., probes that were presented in the current trial, but associated with a
different element; 25 % of probes). Task difficulty was adjusted to individual performance by
increasing the set size (i.e., number of sequentially presented pairs) and reducing the time limit to
respond to the probes.
Mixed-paradigm training. Mixed-paradigm training consisted of a memory updating task
binding task (Oberauer, 2005), and a figural-spatial complex span task (von Bastian & Eschen,
2016).
The memory updating task was identical to the locations task practiced by the
Young-Updating sample. Participants first had to memorize the locations of colored circles presented
simultaneously in a 4 x 4 grid for 500 ms per item. After the presentation of the circles, an arrow
was presented alongside one of the circles centrally on the screen for 500 ms. The circle had to
be mentally shifted up, down, left, or right to the adjacent cell as indicated by the arrow.
Participants indicated the new position of the circle by mouse click in the blank grid. As in the
Young-Updating Sample updating training, trials comprised nine updating steps, with half of the
trials using a cue presented for 500 ms to indicate which of the circles had to be updated.
The binding task was similar to the ones practiced by the Young-Binding sample.
Participants had to memorize a series of locations of colored triangles in a 4 x 4 grid. Each item
was presented for 900 ms followed by a 100 ms inter-stimulus interval. During recognition, each
association was probed by presenting a triangle in a location in the grid, and participants had to
decide whether it matched the triangle that was previously presented at that position. Across all
trials, 50 % of the probes were matches, 25 % were distractors, and 25 % were intrusions.
For the complex span task, participants had to memorize a series of red in a 5 x 5 grid,
each presented for 1000 ms. Each trial of the series was interleaved by a distractor task, in which
participants had to decide whether the long side of a L-shaped figure within the grid was oriented
vertically or horizontally. Response time during the distractor task was limited to 3000 ms.
During recall, participants had unlimited time to indicate the grid positions in correct serial order
In all three tasks, difficulty was adjusted by increasing the set size and reducing the
response time limit. For the complex span task, time to respond to the distractor task was limited,
and for the binding and memory updating tasks time to respond during the retrieval phase was
reduced.
Adaptive task difficulty. All participants started training on the same level of task
difficulty. To maximize the time participants were exposed to challenging task demands, we
ensured that participants quickly reached their individual baseline cognitive performance limit by
implementing a fast evaluating adaptive algorithm during the first training session. Participants’
performance was evaluated after every 10 % of trials in the younger samples, and every 7 % of
trials in the older sample (corresponding to one trial in the Young-Updating sample and the
Old-Mixed sample, and two trials in the Young-Binding sample). If participants reached a
performance criterion (i.e., accuracy above 85 % in the younger samples, 80 % in the older
sample), task difficulty was raised by reducing the response time limit (by 500 ms in the younger
samples and 300 ms in the older sample) for four subsequent level-ups, or by increasing the set
size by one additional memorandum every fifth level-up (which also reset the response time limit
to the starting value). After the first session, performance was evaluated after every 40% of trials
(corresponding to five trials in the Young-Updating sample, ten trials in the Young-Binding
sample and six trials in the Old-Mixed sample). The first training session started with a set size
of two and a response time limit of 3500 ms per response for the younger samples, and 5000 ms
per response in the older sample. The maximum set size was set to eight in the Young-Updating
and the Old-Mixed samples and seven in the Young-Binding sample.
Assessment of individual differences variables. Individual differences variables were
training sessions (see below). Participants completed most computer-based questionnaires at
home. In addition, older adults completed the following questionnaires during an individual
in-lab assessment at the University of Zurich: a demographic questionnaire, a computer- and
Internet questionnaire, and an adapted German, multiple-choice version of the Everyday
Performance Test (EPT; Willis & Marsiske, 1993). Mean rating was used as the dependent
variable for the questionnaire measures.
Demographics. Age and gender were assessed with a demographic questionnaire.
Real-world cognition. Education level was assessed on a scale ranging from 0 to 7 (0 =
no formal education, 7 = doctorate). As younger adults were only included in the study if they
obtained at least a higher education entrance qualification (corresponding to education level 4),
variance in this measure was limited. Thus, we refrained from using education level as a
predictor in younger adults. Older adults additionally completed the Cognitive Failure
Questionnaire (CFQ; Broadbent, Cooper, FitzGerald, & Parkes, 1982), assessing self-reported
failures in perception, memory, and motor function. Items such as “Do you find you forget
people’s names?” were rated on a 5-point scale (0 = never, 4 = very often). Further, we assessed
older adults’ everyday problem solving abilities using an adapted multiple-choice version of the
EPT. The EPT is an objective assessment of everyday competence to perform complex tasks of
daily living. Participants were presented with 15 everyday tasks (e.g., a recipe for twelve
biscuits) and asked to solve two problems associated with each stimulus (e.g., calculate the
amount of flour to bake half of the biscuits) by choosing one of four answers. EPT score
represents the number of correctly solved items within 45 minutes.
Motivation. In the younger samples, participants’ training motivation was assessed at the
Questionnaire on Current Motivation (Rheinberg, Vollmeyer, & Bruns, 2001). On a 7-point scale
(1 = disagree, 7 = agree) they had to rate items such as “I am fully determined to give my best
during training”. In addition, the younger participants completed an adapted version of the
Intrinsic Motivation Inventory (IMI; Deci & Ryan, 2016) at the end of the last training session,
rating items such as “Today’s training session was fun to do” on a 7-point scale (1 = does not
apply at all, 7 = does apply very well). In the older sample, participants’ training motivation was
assessed at the beginning of and mid-way through training (sessions 2 and 14) using an adapted
version the IMI (Deci and Ryan, 2016). Because the motivation measures were highly correlated
in the younger (all rs ≥ .48, all ps < .001) and older samples (r = .76, p < .001) across time
points, we computed one single motivation composite score by averaging the z-transformed
scores.
Cognition-related beliefs. Beliefs were measured using four different constructs. First,
we assessed participants’ passion and perseverance for long-term goals using the 12-item Grit
scale (Duckworth, Peterson, Matthews, & Kelly, 2007). Items such as “I finish whatever I begin”
were rated on a 5-point scale (1 = not like me at all, 5 = very much like me). Second, we assessed
the degree to which participants enjoy effortful cognitive activities using the 16-item1 NFC scale
(Cacioppo & Petty, 1982). Items (e.g., “I really enjoy a task that involves coming up with new
solutions to problems”) were rated on a 7-point scale (1 = strongly disagree, 7 = strongly agree).
Third, participants’ implicit beliefs about the malleability of intelligence was assessed using the
TIS (Dweck, 2000). Items such as “No matter who you are, you can significantly change your
intelligence level” were rated on a 6-point scale (1 = strongly disagree, 6 = strongly agree).
Higher levels indicate an incremental view (a “growth mindset”, i.e., viewing intelligence as a
1
malleable, changeable construct). Finally, to assess participants’ sense of perceived self-efficacy,
we administered the General Self-Efficacy scale (GSE; Schwarzer & Jerusalem, 1995).
Participants rated the items (e.g., “I can always manage to solve difficult problems if I try hard
enough”) on a 4-point scale (1 = not at all true, 4 = exactly true). Younger adults additionally
completed an adapted version of the Self-Efficacy to Regulate Exercise scale (EXSE; Bandura,
2006). Participants rated the items (e.g., “How certain are you that you can get yourself to
perform your training routine regularly when you have other time commitments”) on a visual
analogue scale ranging from 1 to 100.2
Personality. Personality traits were assessed using the 60-item NEO Five Factor
Inventory (Costa & McCrae, 1992), including subscales for neuroticism, agreeableness,
openness, conscientiousness, and extraversion. All items were rated on a 5-point scale (0 =
strongly disagree, 4 = strongly agree).
Leisure activities. Leisure activities were assessed using an adapted version of the Adult
Leisure Activity Questionnaire (Jopp & Hertzog, 2010). Items were grouped into 11 activity
categories (i.e., physical, developmental, and experiential activities, activities with close social
partners, group-centered public activity, religious activities, crafts, game playing, TV watching,
travel, and technology use), across which participants indicated how often they partook in these
activities on a 6-point scale (1 = never, 6 = daily).
Computer literacy and training experience. Older participants completed a questionnaire
regarding their computer and Internet experience. Participants were asked “How confident do
you feel using the computer?” and responded on a 7-point scale (1 = not confident at all, 7 = very
confident). Further, participants were asked if they had any previous cognitive training
2As the two measures for self-efficacy were not correlated (r = 0.03, p = .715), we analyzed both measures
experience (i.e., through commercially available training programs and/or through participating
in other studies).
Data Analysis
We fitted LGC models to the training data (1) to estimate the individual trajectories of
performance change over time and (2) to investigate the effect of baseline cognitive performance
on change in training performance, and (3) to identify possible individual differences that predict
change in training performance. Ideally, all training sessions would have been included
individually in the models (see also Bürki et al., 2014). However, due to the relatively small
sample sizes and to increase the signal-to-noise ratio, we reduced the data to five training blocks
for each sample by averaging across four sessions in the younger adults (i.e., sessions 1-4, 5-9,
10-14, 15-20) and five sessions in the older adults (i.e., sessions 1-5, 6-10, 11-15, 16-20, 21-25).
Further, as we were interested in estimating and predicting general rather than task-specific WM
training performance, we used an average of the set size achieved at the end of each session
across the four binding or memory updating tasks in the younger adults, and across the three
training tasks in the older adults as dependent measure.
By modeling two latent variables, the intercept and the slope, LGC modeling allows for
parsimoniously describing both linear and non-linear longitudinal trajectories within the SEM
framework by accounting for error variance in the manifest variables. Whereas the value in the
dependent variable at the beginning of training ( i = baseline cognitive performance) is
represented by the intercept, the rate of change in the dependent variable ( s = increase/decrease
in cognitive training performance) is expressed by the slope. Both latent factors are defined by a
set of manifest variables (i.e., the training blocks). The model further allows for individual
variance in change of training performance), and this variance can in turn be predicted by
additional variables (i.e., individual differences). The covariance between the intercept and the
slope ( i,s) indicates the degree to which baseline performance and change of training
performance are correlated, with a positive covariation supporting a magnification effect, and a
negative covariation supporting a compensation effect. Finally, the model includes error
covariances ( ,) accounting for correlated error terms ( 1-5) between the adjacent training
blocks. Error variances ( 2 1-5) were constrained to be equal across the five error terms.
Model fit was evaluated using the chi-square statistic ( 2), the standardized
root-mean-square residual (SRMR), and the comparative fit index (CFI). Conventionally, good fit is
indicated by values between 0 and 2df for the 2, by values smaller than 0.08 for the SRMR and
greater than 0.95 for the CFI (Hu & Bentler, 1999; Schermelleh-Engel, Moosbrugger, & Müller,
2003). Although the root-mean-square error of approximation (RMSEA) is a popular measure of
goodness-of-fit, we do not report it following the recent suggestion of Kenny, Kaniskan, and
McCoach (2015). Using Monte Carlo simulations, they showed that the RMSEA tends to
over-reject properly specified models with small degrees of freedom, which is the case for all our
baseline models (dfs = 7).
All analyses were conducted in R (version 3.2.3; R Core Team, 2015) using the “lavaan”
package (version 0.5.23; Rosseel, 2012). Figures depicting training performance were conducted
using the “longCatEDA” package (version 0.31; Tueller, Van Dorn, & Bobashev, 2016). The
package depicts categorical longitudinal data (in our case the dependent variable set size) by
using shades of color instead of vertical position to indicate changes on categorical variables
Results
Data and analyses scripts are available on the Open Science Framework
(https://osf.io/qgkp2). First, to test whether participants training performance increased over the
course of the intervention and whether this increase follows a linear or non-linear pattern, we ran
three baseline models for each sample (i.e., a no-growth, a linear growth, and a non-linear
growth model). We selected the best fitting model using nested model comparisons. Second, we
investigated whether baseline cognitive performance is associated with change in training
performance and, if so, in which direction. Third, to examine how individual differences are
associated with change in training performance, we included the individual differences variables
to predict cognitive training trajectories.
To avoid potential issues caused by multicollinearity of predictors, we ran separate
models for (1) demographic variables, (2) real-world cognition, (3) motivation, (4)
cognition-related beliefs, (5) personality, (6) leisure activities, and (7) computer literacy and training
experience. To estimate multicollinearity within the predictor categories, we assessed the
Variance Inflation Factor (VIF) in both younger and older samples. The VIFs indicated no signs
of multicollinearity, with the highest VIF = 2.18 (for correlation coefficients of the individual
differences see Tables S1 and S2 in the supplemental materials). For each of these seven models,
all measures were included simultaneously and regressed on the latent intercept and slope
concurrently, although the primary interest lies on the prediction of change in training
performance (i.e., the slope). Ordinal and metric predictors were z-transformed prior to data
Missing Data
For data analysis, data were included for all participants who performed above chance
level during at least 75 % of training sessions (i.e., ≥15 sessions for the younger samples, and ≥
19 sessions for the older sample). We did not include data from three older participants because
they (contrary to the instructions) concurrently trained on two computers on two different levels
of difficulty. One older participant had to re-install the training software after six training
sessions due to technical issues and we used the following 19 sessions for data analyses.
All participants from the Young-Updating sample completed 20 training sessions.
However, due to a programming error, the feedback presented during training was incorrect for
two participants for the first 2 and 4 sessions, respectively. Consequently, we treated the data
from those sessions as missing. In the Young-Binding sample, most participants completed 20
sessions (M = 19.83, SD = 0.70, range = 15-20). However, four participants did not complete one
training session, one participant did not complete two training sessions, and one participant
restarted training after 15 sessions. Therefore, we also treated those sessions as missing. Also,
most older participants completed 25 sessions (M = 24.85, SD = 0.98, range = 19-28), except for
three participants who completed less due to scheduling problems (i.e., 21, 23, and 24 sessions)
and the one person who re-installed the training software (i.e., 19 sessions). If participants
completed more than 25 training sessions, these additional sessions were omitted from data
analysis.
As we only had missing data for continuous variables but not for categorical or ordinal
variables (e.g., gender or education), missing data were handled using Full Information
Maximum Likelihood (FIML) estimation, thereby using all available information for estimating
Bayes Factors
We computed BFs for the effect of each predictor on the slope or intercept, allowing for
quantifying the evidence for both the alternative hypothesis (i.e., predictor is associated with
slope or intercept) and the null hypothesis (i.e., predictor is not associated with slope or
intercept). Further, we computed BFs for the variances of the intercept and the slope, as well as
for the covariance between the intercept and the slope. BFs were approximated based on the
Bayesian Information Criterion (BIC), which evaluates model fit based on the log-likelihood
taking the degrees of freedom into account, with a lower BIC reflecting a better model fit. The
BF is computed using the difference in BICs when comparing the model freely estimating the
predictor of interest and the model in which the predictor of interest is fixed to zero
(Wagenmakers, 2007):
BFH1 = exp(0.5*(BIC2 - BIC1),
with BIC1 being the BIC for the alternative model freely estimating the predictor of
interest, and BIC2 being the BIC for the identical model with the predictor of interest fixed to
zero (i.e., the null model). BFs range from 0 to infinity, with higher values indicating stronger
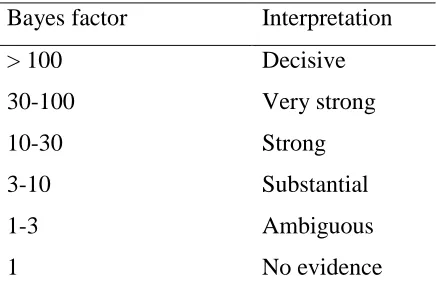
evidence for the alternative model. BFs are evaluated according to an adapted version of Wetzels
and Wagenmakers (2012) to facilitate verbal interpretation (see Table 3). For example, a BF of 3
indicates that the data is three times more likely to occur under the alternative hypothesis. BFs
Table 3
Verbal Labels to Guide Interpretation of Bayes Factors
Bayes factor Interpretation
> 100 Decisive
30-100 Very strong
10-30 Strong
3-10 Substantial
1-3 Ambiguous
1 No evidence
Note. Adapted from Wetzels and Wagenmakers (2012).
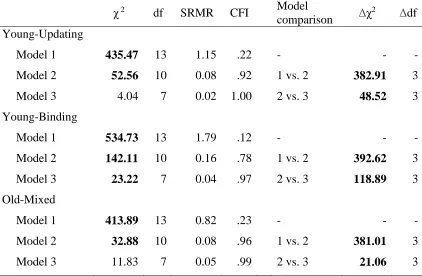
Specification of the Baseline Model
To identify the best fitting baseline model, we conducted several nested model
comparisons for each sample and assessed whether there was a significant improvement of the
relative fit (see Table 4). We compared three models: a no growth curve model assuming no
change in cognitive performance (Model 1), a linear model assuming linear change in cognitive
performance (Model 2), and a non-linear model assuming non-linear change in cognitive
performance (Model 3). Model 3 was modeled according to Kline (2016) by fixing the first two
coefficients of the slope factor to constants (0, 1) and freeing the remaining coefficients for the
slope factor. This specification allows for estimating an empirical curvilinear trend that optimally
[image:27.612.74.293.126.270.2]Table 4
Nested Model Comparisons and Fit Indices for Baseline Latent Growth Curve Models
2 df SRMR CFI Model
comparison
2 df
Young-Updating
Model 1 435.47 13 1.15 .22 - - -
Model 2 52.56 10 0.08 .92 1 vs. 2 382.91 3
Model 3 4.04 7 0.02 1.00 2 vs. 3 48.52 3
Young-Binding
Model 1 534.73 13 1.79 .12 - - -
Model 2 142.11 10 0.16 .78 1 vs. 2 392.62 3
Model 3 23.22 7 0.04 .97 2 vs. 3 118.89 3
Old-Mixed
Model 1 413.89 13 0.82 .23 - - -
Model 2 32.88 10 0.08 .96 1 vs. 2 381.01 3
Model 3 11.83 7 0.05 .99 2 vs. 3 21.06 3
Latent Analysis of Training Performance
Results for the baseline models are summarized in Figure 1. Training performance for
each training task is visualized in Figure 2 for younger adults, and Figure 3 for older adults.
Training performance across tasks for the three samples is visualized in Figure 4.
The non-linear baseline LGC model fitted the data from the Young-Updating sample
well, 2(7) = 4.04, p = .775, SRMR = 0.02, CFI = 1.00. Results indicate that individuals started
training at block 1 with a mean set size of 2.98 ( i = 2.98, SE = 0.05, p < .001) and significantly
increased their performance by 0.49 ( s = 0.49, SE = 0.03, p < .001), resulting in estimated mean
levels of training performance across the five blocks of 2.98 (block 1), 3.47 (block 2), 3.86
(block 3), 4.19 (block 4), and 4.45 (block 5).3 We found strong evidence for a positive
association between the intercept and the slope ( i,s = 0.03, SE = 0.01, p = .004, BFH1 = 11.98),
suggesting that individuals who showed higher baseline cognitive performance also showed
larger training performance gains. Further, there was decisive evidence for individual differences
in the variance of baseline cognitive performance ( 2i = 0.15, SE = 0.03, p < .001, BFH1 > 100)
and change therein ( 2s = 0.03, SE = 0.01, p < .001, BFH1 > 100).
In the Young-Binding sample, the non-linear baseline LGC model’s fit was acceptable,
2(7) = 23.22, p = .002, SRMR = 0.04, CFI = 0.97. The Young-Binding sample started training at
block 1 with a mean set size of 3.46 ( i = 3.46, SE = 0.05, p < .001) and significantly increased
their performance by 0.69 ( s = 0.69, SE = 0.04, p < .001), resulting in estimated mean levels of
training performance across the five blocks of 3.46 (block 1), 4.15 (block 2), 4.62 (block 3), 4.94
(block 4), and 5.19 (block 5). Again, we found decisive evidence for a positive association
between the intercept and the slope ( i,s = 0.05, SE = 0.01, p < .001, BFH1 > 100), suggesting that
3Estimated means are determined by the factor mean of the intercept i and pattern coefficients and were
individuals who showed higher baseline cognitive performance also showed larger training
performance gains. Further, we found decisive evidence for individual differences in the variance
of baseline cognitive performance ( 2i = 0.12, SE = 0.03, p < .001, BFH1 > 100) and change
therein ( 2s = 0.05, SE = 0.01, p < .001, BFH1 > 100).
Finally, the non-linear baseline LGC model fit the data from the Old-Mixed sample well,
2 (7) = 11.83, p = .106, SRMR = 0.05, CFI = 0.99, and showed that older adults started training
at block 1 with a mean set size of 3.08 ( i = 3.08, SE = 0.05, p < .001) and significantly increased
their performance by 0.40 ( s = 0.40, SE = 0.03, p < .001), resulting in estimated mean levels of
training performance across the five blocks of 3.08 (block 1), 3.48 (block 2), 3.84 (block 3), 4.13
(block 4), and 4.38 (block 5). We found ambiguous evidence for the absence of an association
between the intercept and the slope ( i,s = 0.02, SE = 0.01, p = .056, BFH0 = 1.39), but again we
found decisive evidence for individual differences in the variance of baseline cognitive
performance ( 2i = 0.17, SE = 0.03, p < .001, BFH1 > 100) and change therein ( 2s = 0.02, SE =
Figure 1. Baseline non-linear latent growth curve model of change in training performance. Bold numbers indicate
significance (p < .05). Unstandardized estimates are presented for the Updating sample (S1), the
circles represent latent factors, and the triangle is modeled to represent the means of the latent factors ( i = mean of the
intercept, s = mean of the slope). 2i = variance of the intercept; 2s = variance of the slope; i,s = covariance of
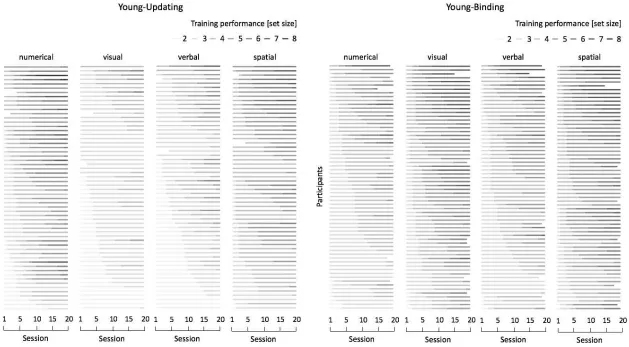
Figure 2. Growth curve plot of task-specific training performance for the Young-Updating and Young-Binding samples. Each line
represents an individual, ordered vertically separately for each task using the sorter function implemented in the “longCatEDA”
package (Tueller et al., 2016). Shades of grey represent set size achieved at the end of each training session. Thus, lines are darker
Figure 3. Growth curve plot of task-specific training performance for the
Old-Mixed Sample. Each line represents an individual, ordered vertically
separately for each task using the sorter function implemented in the
“longCatEDA” package (Tueller et al., 2016). Shades of grey represent set
size achieved at the end of each training session. Thus, lines are darker with
Figure 4. Training performance averaged across training tasks for
each individual (grey) and on the group level (black). Estimated
means are presented for each training block.
Association of Individual Differences with Change in Training Performance and Baseline
Cognitive Performance
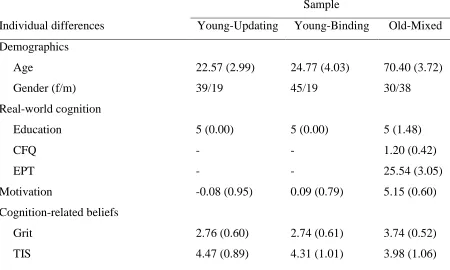
Descriptive statistics for the individual differences variables are presented in Table 5. To
predict training trajectories, we included all variables measuring the same aspect of individual
differences simultaneously in the baseline model. Note that although results will be reported
separately for the slope and the intercept, the individual differences variables were regressed on
both latent factors concurrently.
Table 5
Descriptive Statistics for Individual Differences Variables
Sample
Individual differences Young-Updating Young-Binding Old-Mixed
Demographics
Age 22.57 (2.99) 24.77 (4.03) 70.40 (3.72)
Gender (f/m) 39/19 45/19 30/38
Real-world cognition
Education 5 (0.00) 5 (0.00) 5 (1.48)
CFQ - - 1.20 (0.42)
EPT - - 25.54 (3.05)
Motivation -0.08 (0.95) 0.09 (0.79) 5.15 (0.60)
Cognition-related beliefs
Grit 2.76 (0.60) 2.74 (0.61) 3.74 (0.52)
GSE 2.98 (0.37) 3.00 (0.35) 3.06 (0.37)
EXSE 65.66 (18.22) 62.84 (17.38) -
NFC 5.07 (0.69) 5.03 (0.68) 5.24 (0.84)
Personality
Neuroticism 1.70 (0.63) 1.60 (0.65) 1.13 (0.53)
Agreeableness 2.73 (0.60) 2.81 (0.42) 2.82 (0.34)
Extraversion 2.40 (0.65) 2.39 (0.61) 2.39 (0.50)
Openness 2.73 (0.57) 2.77 (0.54) 2.73 (0.43)
Conscientiousness 2.71 (0.58) 2.75 (0.53) 2.90 (0.51)
Leisure activities
Crafts - - 2.31 (1.17)
Developmental activities - - 2.41 (0.46)
Experiential activities - - 3.40 (0.68)
Game playing - - 2.56 (0.89)
Physical activities - - 3.13 (0.90)
Religious activities - - 2.43 (1.45)
Activities with close social partner - - 3.15 (0.55)
Group centered public activities - - 1.77 (0.55)
Technology use - - 3.14 (0.79)
TV watching - - 3.62 (0.90)
Travel - - 2.53 (0.57)
Training / Computer
Computer literacy - - 5.04 (1.52)
Training experience (y/n) - - 23/45
Note. Values are means and standard deviations in parentheses (median and median absolute
deviation in parentheses for education). CFQ = Cognitive Failure Questionnaire; EPT = Everyday
Problems Test; TIS = Theories of Intelligence; GSE = General Efficacy scale; EXSE =
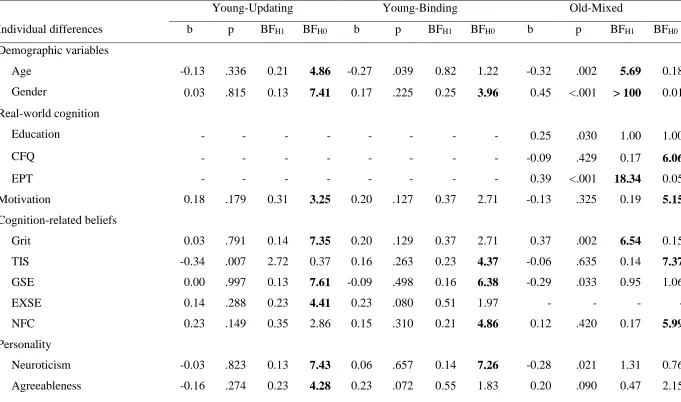
Individual differences predicting change in training performance. Overall, we found
only limited evidence for individual differences predicting change in training performance, with
most estimates supporting the null hypothesis (see Table 6). There was only one exception. In
the Old-Mixed sample, we found substantial evidence for a negative association of growth
mindset with change in training performance (b = -0.37, p = .005, BFH1 = 3.26), however
indicating that individuals who believed more strongly that intelligence is malleable showed less
increase in training performance.
For most other individual differences, including demographic variables, real-world
cognition, motivation, personality, leisure activities, and computer literacy and training
experience, we found evidence against an association with change in training performance, with
at least substantial evidence in favor for the null hypothesis (BFH0 ≥ 3).
Individual differences predicting baseline cognitive performance. We found some
evidence for individual differences predicting baseline cognitive performance, with all evidence,
however, being observed in the older adults only (see Table 7).
We found decisive evidence for an association of gender with baseline cognitive
performance (b = 0.45, p < .001, BFH1 > 100), indicating that male individuals started training at
a higher level of performance. Further, there was substantial evidence that age was negatively
associated with baseline cognitive performance (b = -0.32, p = .002, BFH1 = 5.69), indicating that
within the older age group, younger individuals showed higher baseline cognitive performance.
Regarding real-world cognition, we found strong evidence for a positive association of EPT
performance with baseline cognitive performance (b = 0.39, p < .001, BFH1 = 18.34), indicating
that individuals who performed better in the EPT also showed higher baseline cognitive
baseline cognitive performance (b = 0.37, p = .002, BFH1 = 6.54), indicating that grittier
individuals showed higher baseline cognitive performance. Regarding personality, we found very
strong evidence for a negative association of extraversion with baseline cognitive performance (b
= -0.44, p < .001, BFH1 = 43.40), indicating that individuals scoring high on extraversion showed
lower baseline cognitive performance. Finally, we found substantial evidence for a negative
association of religious activities with baseline cognitive performance (b = -0.34, p = .003, BFH1
= 5.01), indicating that individuals with high levels of religious activities (e.g., frequent church
attendance) started training at a lower level of performance. For most other individual
differences, however, we found evidence against an association with baseline cognitive
Table 6
Associations of Individual Differences with Change in Training Performance
Young-Updating Young-Binding Old-Mixed
Individual differences b p BFH1 BFH0 b p BFH1 BFH0 b p BFH1 BFH0
Demographic variables
Age -0.30 .014 1.61 0.62 -0.26 .046 0.74 1.35 0.12 .396 0.17 5.80
Gender 0.15 .244 0.25 3.98 0.27 .035 0.88 1.14 0.01 .937 0.12 8.22
Real-world cognition
Education - - - - - - - - 0.31 .021 1.24 0.81
CFQ - - - - - - - - 0.07 .600 0.14 7.19
EPT - - - - - - - - 0.09 .511 0.15 6.66
Motivation 0.08 .563 0.15 6.46 0.24 .058 0.63 1.59 -0.13 .366 0.18 5.54
Cognition-related beliefs
Grit 0.19 .138 0.37 2.71 0.11 .439 0.17 5.97 -0.02 .864 0.12 8.13
TIS -0.29 .028 1.06 0.95 -0.16 .250 0.24 4.23 -0.37 .005 3.26 0.31
GSE -0.12 .467 0.17 5.87 -0.20 .121 0.38 2.60 -0.07 .673 0.13 7.55
EXSE -0.11 .424 0.18 5.57 0.24 .070 0.56 1.79 - - - -
NFC 0.07 .698 0.14 7.07 0.09 .562 0.15 6.77 0.05 .767 0.13 7.89
Personality
Neuroticism 0.01 .961 0.13 7.61 0.00 .978 0.12 8.00 -0.13 .412 0.17 5.93
Extraversion -0.20 .196 0.29 3.44 -0.29 .037 0.85 1.18 0.08 .614 0.14 7.27
Openness -0.05 .688 0.14 7.03 0.04 .784 0.13 7.71 -0.32 .018 1.34 0.75
Conscientiousness -0.27 .038 0.88 1.14 -0.08 .562 0.15 6.77 -0.29 .055 0.65 1.54
Leisure activities
Crafts - - - - - - - - -0.07 .637 0.14 7.38
Developmental activities - - - - - - - - 0.16 .337 0.19 5.27
Experiential activities - - - - - - - - -0.09 .652 0.13 7.46
Game playing - - - - - - - - 0.05 .696 0.13 7.64
Physical activities - - - - - - - - -0.06 .646 0.13 7.42
Religious activities - - - - - - - - -0.05 .703 0.13 7.67
Activities with social partner - - - - - - - - 0.00 .992 0.12 8.24
Public activities - - - - - - - - 0.14 .380 0.18 5.66
Technology use - - - - - - - - -0.19 .193 0.27 3.68
TV watching - - - - - - - - -0.13 .352 0.19 5.40
Travel - - - - - - - - -0.34 .011 1.84 0.54
Computer/Training
Computer literacy - - - - - - - - -0.28 .039 0.80 1.25
Training experience - - - - - - - - 0.05 .702 0.13 7.66
Note. Bold values represent Bayes factors ≥ 3 indicating substantial evidence for the respective hypothesis. b = standardized estimates; BF =
TIS = Theories of Intelligence; GSE = General Self-Efficacy scale; EXSE = Self-Efficacy to Regulate Exercise scale; NFC = Need for
Table 7
Associations of Individual Differences with the Baseline Cognitive Performance
Young-Updating Young-Binding Old-Mixed
Individual differences b p BFH1 BFH0 b p BFH1 BFH0 b p BFH1 BFH0
Demographic variables
Age -0.13 .336 0.21 4.86 -0.27 .039 0.82 1.22 -0.32 .002 5.69 0.18
Gender 0.03 .815 0.13 7.41 0.17 .225 0.25 3.96 0.45 <.001 > 100 0.01
Real-world cognition
Education - - - - - - - - 0.25 .030 1.00 1.00
CFQ - - - - - - - - -0.09 .429 0.17 6.06
EPT - - - - - - - - 0.39 <.001 18.34 0.05
Motivation 0.18 .179 0.31 3.25 0.20 .127 0.37 2.71 -0.13 .325 0.19 5.15
Cognition-related beliefs
Grit 0.03 .791 0.14 7.35 0.20 .129 0.37 2.71 0.37 .002 6.54 0.15
TIS -0.34 .007 2.72 0.37 0.16 .263 0.23 4.37 -0.06 .635 0.14 7.37
GSE 0.00 .997 0.13 7.61 -0.09 .498 0.16 6.38 -0.29 .033 0.95 1.06
EXSE 0.14 .288 0.23 4.41 0.23 .080 0.51 1.97 - - - -
NFC 0.23 .149 0.35 2.86 0.15 .310 0.21 4.86 0.12 .420 0.17 5.99
Personality
Neuroticism -0.03 .823 0.13 7.43 0.06 .657 0.14 7.26 -0.28 .021 1.31 0.76
Extraversion 0.11 .504 0.16 6.11 -0.18 .213 0.26 3.81 -0.44 <.001 43.40 0.02
Openness -0.02 .868 0.13 7.51 0.15 .247 0.24 4.21 -0.04 .722 0.13 7.74
Conscientiousness -0.15 .292 0.22 4.46 -0.03 .833 0.13 7.83 0.32 .007 2.94 0.34
Leisure Activities
Crafts - - - - - - - - 0.25 .046 0.75 1.33
Developmental activities - - - - - - - - 0.24 .085 0.49 2.05
Experiential activities - - - - - - - - -0.31 .061 0.62 1.62
Game playing - - - - - - - - 0.08 .514 0.15 6.68
Physical activities - - - - - - - - -0.03 .838 0.12 8.07
Religious activities - - - - - - - - -0.34 .003 5.01 0.20
Activities with social partner - - - - - - - - -0.09 .490 0.15 6.51
Public activities - - - - - - - - 0.21 .134 0.35 2.83
Technology use - - - - - - - - 0.08 .563 0.14 6.98
TV watching - - - - - - - - 0.07 .572 0.14 7.03
Travel - - - - - - - - 0.03 .838 0.12 8.07
Computer/Training
Computer literacy - - - - - - - - 0.20 .114 0.39 2.57
Training experience - - - - - - - - 0.17 .173 0.29 3.41
Note. Bold values represent Bayes factors ≥ 3 indicating substantial to decisive evidence for the respective hypothesis. b = standardized
Problems Test; TIS = Theories of Intelligence; GSE = General Self-Efficacy scale; EXSE = Self-Efficacy to Regulate Exercise scale; NFC =
Additional Analyses of the First Training Block
A limitation of our modeling approach is that the intercept represents the mean
performance across the first block (i.e., the average set size of the first 4 or 5 training sessions,
depending on the sample). Thus, this analysis does not allow to directly predict change in
training performance during this first training block in the context of overall change in training
performance. Therefore, to investigate how individual differences are associated with baseline
cognitive performance at the first training session and change in training performance across the
first training block, we additionally ran the same models for the first training block only, with the
first training session as the intercept and change modeled across the first four to five training
sessions, depending on the sample. Detailed results of these analyses are reported in the
supplemental material (see Tables S3 to S6, Figure S1).
Overall, although the BFs were somewhat lower in these additional analyses (possibly
due to the increased noise in the non-averaged data), the pattern of results was largely similar to
the findings of our primary analyses, with a few exceptions. Whereas a model assuming a
non-linear change in training performance still fitted the data of the Old-Mixed sample best, nested
model comparisons indicated the best fit for a model assuming a linear change in both younger
samples (see Table S3 in the supplemental material). Hence, younger, but not older adults
showed steeper performance increases during the first few sessions than across all sessions. As
for the primary analyses, evidence for the variance of baseline cognitive performance and change
in cognitive performance was decisive for all samples (see Table S4 in the supplemental
material). However, different to the primary analyses, we found substantial evidence for the
for this association was again ambiguous for the older adults (see Table S4 in the supplemental
material).
Similar to the primary analyses, most predictors were also unrelated to change in training
performance over the first few training sessions (see Table S5 in the supplemental material). In
addition to the now strong evidence for a negative association with growth mindset (b = -0.44, p
= .001, BFH1 = 10.37), we found substantial evidence for a negative association with age (b =
-0.36, p = .004, BFH1 = 3.38), indicating that, within the older sample, younger individuals
changed more during the first training block. Taken together with the finding that the slope
followed a linear function in the younger samples, but a non-linear function in the older sample,
this suggests that age differences play a bigger role at the beginning of training than at later
stages.
Results were also largely similar for the predictors of baseline cognitive performance at
the first session, with a few exceptions (see Table S6 in the supplemental material). First, in the
Old-Mixed sample, there was substantial evidence for a negative association of general
self-efficacy with performance in the first session (b = -0.39, p = .001, BFH1 = 7.03). Second, in the
Young-Updating sample, we found substantial evidence for a negative association of a growth
mindset (b = -0.38, p = .002, BFH1 = 5.35). Third, the associations of the intercept with age and
Discussion
The objectives of the present work were threefold. First, we estimated individual training
trajectories. Second, we related baseline cognitive performance (i.e., the intercept) to change in
training performance across the training phase (i.e., the slope). Third, we examined the extent to
which individual differences were predictive of change in training performance. We modeled
LGCs for three WM training interventions in younger and older adults that comprised a broad set
of potential individual differences variables previously discussed in the literature, including
demographic variables, motivation, cognition-related beliefs, and personality traits. Using BFs
enabled us to evaluate the strength of evidence for the presence as well as the absence of a
possible association between individual differences in the above variables and change in training
performance.
Performance improved non-linearly across the training phase in all three samples. In line
with the magnification account, this change in training performance was positively associated
with baseline cognitive performance, indicating that individuals who started off on higher
performance levels also improved more throughout the training phase. However, whereas
evidence for the presence of this relationship was strong to decisive in the two younger samples,
we found ambiguous evidence for the absence of it in the older sample. Finally, although
baseline cognitive performance was predicted by individual differences in some variables (i.e.,
demographics, real-world cognition, cognition-related beliefs, personality, and leisure activities),
only 1 out of 29 variables predicted change in training performance, and did so only
inconsistently across samples. More specifically, we found that, in the older sample, growth
mindset was negatively associated with change in training performance. Taken together, our