This is a repository copy of
Specimen-agnostic guided wave inspection using recursive
feedback
.
White Rose Research Online URL for this paper:
http://eprints.whiterose.ac.uk/110218/
Version: Accepted Version
Proceedings Paper:
Adams, C orcid.org/0000-0002-3992-0555, Harput, S, Cowell, D
orcid.org/0000-0003-0854-542X et al. (2 more authors) (2016) Specimen-agnostic guided
wave inspection using recursive feedback. In: IEEE International Ultrasonics Symposium,
IUS. 2016 International Ultrasonics Symposium, 18-21 Sep 2016, Tours, France. IEEE .
ISBN 9781467398978
https://doi.org/10.1109/ULTSYM.2016.7728811
© 2016, IEEE. This is an author produced version of a paper published in Ultrasonics
Symposium (IUS), 2016 IEEE International. Personal use of this material is permitted.
Permission from IEEE must be obtained for all other users, including reprinting/
republishing this material for advertising or promotional purposes, creating new collective
works for resale or redistribution to servers or lists, or reuse of any copyrighted
components of this work in other works. Uploaded in accordance with the publisher’s
self-archiving policy.
eprints@whiterose.ac.uk https://eprints.whiterose.ac.uk/
Reuse
Unless indicated otherwise, fulltext items are protected by copyright with all rights reserved. The copyright exception in section 29 of the Copyright, Designs and Patents Act 1988 allows the making of a single copy solely for the purpose of non-commercial research or private study within the limits of fair dealing. The publisher or other rights-holder may allow further reproduction and re-use of this version - refer to the White Rose Research Online record for this item. Where records identify the publisher as the copyright holder, users can verify any specific terms of use on the publisher’s website.
Takedown
If you consider content in White Rose Research Online to be in breach of UK law, please notify us by
Specimen-Agnostic Guided Wave Inspection Using
Recursive Feedback
Chris Adams, Sevan Harput, David Cowell and Steven Freear
Ultrasonics and Instrumentation Group,School of Electronic and Electrical Engineering, University of Leeds, Leeds,
LS2 9JT, UK Email: elca@leeds.ac.uk
David M. Charutz
NDT, SOREQ NRC,Yavne Israel
Abstract—Lamb waves, a configuration of guided waves are
often applied to the inspection of plate like structures. Their complex, multi-modal nature makes them well suited to the inspection of different defects. Control over their propagation direction allows the engineer to increase inspection distance and prospectively locate the defect. Schemes already exist, but they require knowledge of material and its dispersion curves. If the material composition is not known, or external factors are effecting its speed of sound then these schemes may not be appropriate. The recursive feedback algorithm can be used to enhance guided waves in a single direction without a-priori knowledge. In recursive feedback, a guided wave is generated using the first element of an array transducer. Over several subsequent iterations, this guided wave is reinforced by re-transmitting recorded out of plane displacements. In this work, recursive feedback has been applied to two inspection problems; a contaminated kissing bond and a plate with a defect. With the kissing bond, it is shown that the the contamination can be identified as the A0 mode of generated waves are absorbed. In
the defective plate, the defect direction is identified by a 10 dB increase in reflected energy when the guided waves are enhanced in one direction.
I. INTRODUCTION
In non destructive evaluation (NDE), guided waves are often applied to thin plate-like structures [1]. The close proximity of the boundaries means that when the plate is loaded, lamb waves form which are a superposition of longitudinal and shear waves. At any given a frequency, an infinite number of modes exist, each differentiated by their unique phase velocity and shape. The lowest order of these are A0 andS0. These low
order modes are applied to inspection of joints, welds and for the discovery of large defects like holes. Lamb waves are also applicable to multi layer structures for imaging of defects [2]. Alternatively, the S0 mode can also be generated for
pulse-echo to find defects [2]. Guided waves are often utilised in the petro-chemical industry for the inspection of pipes where one sided is loaded with a fluid [3]. More recently, authors have developed techniques for coupling lamb waves into complex corrugated materials [4]. Guided waves are still an area of intense research, with authors continuing to characterise guided wave [5] behaviour at increasing frequencies [6].
Control over propagation direction is highly advantageous
in NDE; it allows the engineer to locate defects and increases propagation distance. Guided wave specific techniques already exist to control propagation direction [7]. However, they require knowledge of the specimen’s dispersion curves. This is problematic as the exact material composition may not be known, or external factors, such as temperature may affect the speed of sound. Here, recursive feedback is applied to the inspection of several materials. Using an array transducer, the algorithm allows the direction of propagation of lamb waves to be controlled without knowledge of the material parameters. It is not within the scope of this work to fully describe the intricacies of the recursive feedback algorithm, it is described elsewhere [8]. However a brief description will be given.
Consider anN element array transducer which is mounted normally to a specimen such as a plate. Before inspection is undertaken, a short process called recursive feedback is undertaken which allows excitation waveforms and delays for each element of the transducer to be found. The process allows uni-directional guided wave inspection to be undertaken. It consists ofN short iterations, which are as follows:
1) i = 1 Initially, the first element of the transducer is
excited with a linear chirp. As the first element loads the material, longitudinal and shear waves combine and create multi modal Lamb waves that travel in both di-rections. Simultaneously element two records the surface pressure of the material.
2) i= 2Now the first element transmits the same stimulus
as it did before. This time however the second element transmits back its recording from the previous iteration. The third element records.
3) i= 3 In the third step of the scheme, the first element
transmits its stimulus, the second its recording from step one and the third its recording from step two. The forth element records.
4) i = N This process is continued until all N elements
are transmitting.
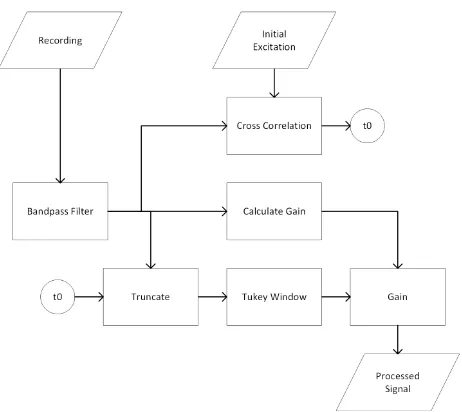
Fig. 1. Signal processing chain. The chain rejects noise and ensures that the region of interest is re-transmitted.
propagate in the opposite direction but with less energy. The scheme will amplify forward any modes generated by the first element.
A degree of signal conditioning is required: Lamb waves are dispersive, so excitation sequences grow in length and the algorithm by design will amplify forward any noisy un-conditioned signals. To solve this, recordings are cross-correlated with the original excitation on the first element. This approximates delay, a process similar to pulse compression in medical imaging. From here the playback can be truncated and Tukey windowed. A bandpass filter is also applied to reject frequencies outside the bandwidth of the original excitation. Finally gain is applied to equate the signal maximums. The chain is shown diagrammatically in Figure 1.
II. METHOD
For the first time, the recursive feedback scheme will be applied to two inspection problems. The problems will be described and tested. In each problem a different material will be used, but an identical pitch transducer and excitation frequency will be used. The first problem will highlight the scheme’s ability to excite several modes without a-prior knowledge of the material’s properties. The second will be show that the uni-directional capability can be used to resolve the direction of a defect.
In both cases, an 8 element transducer is simulated with pressure loads separated by 3 mm. The contact area is 400µm. The excitation is a 700 - 800 kHz chirp. This simplification reduces simulation complexity.
A. Contaminated Kissing Bond Inspection
Kissing bonds are common place in aeronautics, they consist of two plates that are glued together with an overlap. Causes of failures include inclusions (contamination) and voids. These are caused by poor curing, poor surface preparation or stress.
Fig. 2. A kissing bond that has been contaminated. Two plates are epoxied together. Guided waves are generated in the lower plate and will couple into the top plate.
A cross section of a kissing bond with an inclusion is shown in Figure 2.
When poor quality kissing bonds are subjected to guided waves, mode conversions, phase velocity changes and attenu-ation occur when the waves interact with contaminants. The amplitude of the S0 mode can indicate the location of a
delamination [9]. TheA0 is most sensitive to bond state, and
the easiest to transduce [10]. Fully cured bonds transmit the most energy and inclusions introduce fluid modes. The A0
mode will become a multilayer mode (2h) while it crosses
the bond [10]. In this experiment, a kissing bond will be modelled using an FEA tool. 2 mm thick aluminium sheets will be used for the plates. 600 µm thick epoxy and a 200
µm thick inclusion of castor oil will be used for the defective joint. The defect consumes a third of the 60 mm wide overlap and is placed 500µm from the incoming edge of the epoxy.
Recursive feedback will be performed on the lower of the two plates with the aim of generating a guided wave toward the joint. The process will be repeated on an uncontaminated joint so that a comparison can be made.
B. Defect Localisation in a Titanium Plate
In this experiment, guided wave inspection will be applied to a 500 mm wide, 2 mm thick titanium plate with a defect. At one end lies the edge. At the other end lies a blind hole, 5 mm in diameter and 1 mm deep.
The recursive feedback will be used in two ways. Firstly the scheme will be used to excite toward the edge of the material. In the second operation, the waves will be directed toward the hole. The out of plane surface displacements over the trans-mitting area will be monitored for reflections. Comparisons between the two enhancement directions should indicate from where the defect lies. The higher intensity reflections from the two directions will indicate which direction the defect exists. Exact localisation is difficult because of the dispersion of the propagating waves. In Structural Health Monitoring (SHM) however, this can be compensated for [11]. Dispersion relations will be acquired to observe any specific attenuation or reflection of modes.
III. RESULTS ANDDISCUSSION
Fig. 3. The dispersion relations of kissing bonds with and without contami-nation. The peak value of the uncontaminated has been used as a reference. Attenuation and mode conversions have occurred in the contaminated case.
move the sensor [12]. Transducer choice is important as modes behave differently when interacting with different materials [13]. Laser vibrometery is desirable for this reason [5] as it is non contact. When two dimensional Fourier analysis is performed, an image that shows the relationship between frequency and wavenumber is produced [14]. This technique is commonly used to quantify the interaction of lamb waves with defects [15]. Phase velocity dispersion relations are often more useful but are harder to obtain experimentally, although au-thors have obtained them using opto-acoustics [16]. The same process is applied to the defective plate experiment, results of which are presented in Figure 4. The results are given in power (dB). In the case of the kissing bond, the reference is the maximum value taken from the non-contaminated recording. In the case of the defective plate, the maximum value from the edge enhanced direction dispersion is used.
Returning to the uncontaminated kissing bond, two modes are visible,A0at the top andS0 at the bottom. TheA0 mode
is the most predominant. Both modes are centred around the 700 kHz-800 kHz frequency range which is the bandwidth of the excitation waveforms. The same is true for both the dispersion relations in Figure 4.
There is a significant loss of energy in theA0mode when a
contaminant has been introduced into the kissing bond. Either the contaminant has absorbed the A0 entirely or there has
been general attenuation of signals and a mode conversion has taken place fromA0toS0. By comparing with the dispersion
relation of a known good joint, it has been shown the the bond is defective.
In the defective titanium sheet (Figure 4), A0 and S0
[image:4.612.318.547.61.249.2]modes can also be found. In the top image, guided waves have been excited toward the edge and thus away from the defect. Although the enhancement direction is away from the defect there is some small reflection from the residual energy propagating in the opposite direction. The modes are
Fig. 4. Dispersion relations reflected from a defect in each enhancement direction. Top: Guided waves are enhanced in the opposite direction to the defect, there is a small reflection from the defect. Bottom: Guided waves are enhanced toward the defect, there is a much larger reflection.
not complete in the edge direction, there is some loss of both modes at 700 kHz. When the guided waves are directed toward the defect, a 10 dB increase ofA0 and a 5 dB increase inS0
is observed. From this magnitude increase it can be deduced that this is the direction of the defect.
Further investigation of the kissing bond dispersion might indicate more about the defect to the engineer. The exact cause of loss of theA0mode attenuation might become apparent if a
multi-layer dispersion relation were acquired from the overlap of the two materials. Phase velocities might also pertain to the composition of the inclusion.
The method used here for the inspection of the bond requires knowledge of the dispersion relationship of a known good bond for comparison. Alternatively, the dispersion of the guided waves prior and post entry to the bond may be compared to identify a flaw.
With the defective titanium plate, computational limitations meant that only 8 pressure loads were applied to the material. This achieved a 10 dB increase in power when directed toward the defect. Practically, it’s feasible that this increase will be significantly larger. Modern transducer arrays often contain 64 or more elements and it has been shown in prior work that the recursive feedback scheme’s ability to direct guided waves improves as more elements are used [8].
IV. CONCLUSION
Recursive feedback is a scheme that allows propagation direction to be controlled without full knowledge of the specimen’s parameters. In recursive feedback, the first element of an array is excited. Simultaneously the adjacent element records the shear component of the propagating wave. In the next iteration, this recording is transmitted in conjunction with the initial excitation of the first. The 3rd element records. This process is continued until all elements in the array are transmitting. The effect is that guided waves travel in the direction of the array’s spatial influence.
In this work, recursive feedback has been applied to the inspection of two specimens. The first was a kissing bond, a cured epoxy joint between two aluminium sheets. The kissing bond was compared with an otherwise identical joint with an inclusion of castor oil. The second application was a titanium sheet with a blind hole defect.
In both applications, the dispersion relation was acquired from an FEA tool. Out of plane displacements across at a number of points were recorded. Two dimensional Fourier analysis is then undertaken to find the frequency-wavenumber dispersion relation.
For the defective plate, dispersion relations are acquired from the transmitting excitation area. The guided waves reflect off the defect and back over the transducer. The scheme enhances in each direction and the dispersion relations are compared. Since there was a 10 dB increase in reflected power from one direction, it is deduced that this is the direction of the defect.
With the kissing bonds, guided waves are generated in the bottom plate and they propagate through the bond into the top plate. Dispersion relations are acquired from the out of plane displacements on the top surface. The contaminated and un-contaminated bonds are compared. Attenuation of the A0
mode has occurred, but may possibly have converted to S0
as there is still some energy present here. Further work might involve comparing dispersion relations acquired at different parts of the joint; before the joint and at the multi-layer overlap.
REFERENCES
[1] K. Edalati, A. Kermani, M. Seiedi, and A. Movafeghi, “Defect detection in thin plates by ultrasonic lamb wave techniques,”International Journal of Materials and Product Technology, vol. 27, no. 3-4, pp. 156–172, 2006.
[2] V. Mustafa, A. Chahbaz, D. R. Hay, M. Brassard, and S. Dubois, “Imaging of disbond in adhesive joints with lamb waves,” in Nondestruc-tive Evaluation Techniques for Aging Infrastructure and Manufacturing. International Society for Optics and Photonics, 1996, pp. 87–97. [3] T. Hayashi and D. Inoue, “Guided wave propagation in metallic and
resin plates loaded with water on single surface,” in42ND ANNUAL REVIEW OF PROGRESS IN QUANTITATIVE NONDESTRUCTIVE EVALUATION: Incorporating the 6th European-American Workshop on Reliability of NDE, vol. 1706. AIP Publishing, 2016, p. 030003. [4] O. Asfar, B. Morvan, and J.-L. Izbicki, “Three-mode coupling of
sym-metric and antisymsym-metric lamb waves in plates with finite corrugations,”
IEEE transactions on ultrasonics, ferroelectrics, and frequency control, vol. 62, no. 3, pp. 524–530, 2015.
[5] X. Chen, J. E. Michaels, and T. E. Michaels, “A methodology for estimating guided wave scattering patterns from sparse transducer array measurements,” IEEE transactions on ultrasonics, ferroelectrics, and frequency control, vol. 62, no. 1, pp. 208–219, 2015.
[6] P. Khalili and P. Cawley, “Excitation of single-mode lamb waves at high-frequency-thickness products,” IEEE transactions on ultrasonics, ferroelectrics, and frequency control, vol. 63, no. 2, pp. 303–312, 2016. [7] J. Li and J. L. Rose, “Implementing guided wave mode control by use of a phased transducer array,” IEEE transactions on ultrasonics, ferroelectrics, and frequency control, vol. 48, no. 3, pp. 761–768, 2001. [8] D. M. Charutz, E. Mor, S. Harput, D. M. J. Cowell, P. R. Smith, and S. Freear, “Guided wave enhancement phased array beamforming scheme using recursive feedback,” in2013 IEEE International Ultra-sonics Symposium (IUS), July 2013, pp. 166–169.
[9] N. Guo and P. Cawley, “The interaction of lamb waves with delamina-tions in composite laminates,”The Journal of the Acoustical Society of America, vol. 94, no. 4, pp. 2240–2246, 1993.
[10] F. L. di Scalea, P. Rizzo, and A. Marzani, “Propagation of ultrasonic guided waves in lap-shear adhesive joints: Case of incident a0 lamb wave,”The Journal of the Acoustical Society of America, vol. 115, no. 1, pp. 146–156, 2004.
[11] J. B. Harley and J. M. Moura, “Data-driven and calibration-free lamb wave source localization with sparse sensor arrays,”IEEE transactions on ultrasonics, ferroelectrics, and frequency control, vol. 62, no. 8, pp. 1516–1529, 2015.
[12] B. Ren and C. J. Lissenden, “Pvdf multielement lamb wave sensor for structural health monitoring,” IEEE transactions on ultrasonics, ferroelectrics, and frequency control, vol. 63, no. 1, pp. 178–185, 2016. [13] S. Fateri, P. S. Lowe, B. Engineer, and N. V. Boulgouris, “Investigation of ultrasonic guided waves interacting with piezoelectric transducers,”
IEEE Sensors Journal, vol. 15, no. 8, pp. 4319–4328, 2015.
[14] D. Alleyne and P. Cawley, “A two-dimensional fourier transform method for the measurement of propagating multimode signals,”The Journal of the Acoustical Society of America, vol. 89, no. 3, pp. 1159–1168, 1991. [15] D. N. Alleyne and P. Cawley, “The interaction of lamb waves with defects,”IEEE transactions on ultrasonics, ferroelectrics, and frequency control, vol. 39, no. 3, pp. 381–397, 1992.