District Education
Operational Planning and
Performance Review
March 2012
Ghana Education Service
Training Manual
Updating the knowledge and skills required to accomplish tasks is crucial in the achievement of organisational goals. Especially in the current situation, strong capacity of district officers in planning and management is the key for successful decentralisation of the education system. This manual has been designed in response to such needs in the Ghana Education Service. Consequently, experts have been duly constituted to compile this training manual “District Education Operational Planning and Performance Review”.
This manual is mainly meant to equip district officers with necessary knowledge and skills required for development of the Annual District Education Operational Plan (ADEOP) and the Annual District Performance Report (ADPR) though the guidelines of the ADEOP and the ADPR themselves are not included in this manual as these guidelines are subject to periodical update according to the situation.
This manual is divided into the following four sections: Sector Performance Management, Education Policies and Strategies, Educational Planning, and Monitoring and Evaluation. The section of Sector Performance Management explains result-based management and project cycle management which are essential knowledge for all planning and management processes. Then the section of Education Policies and Strategies covers key policies and strategies such as the Millennium Development Goals, Education for All, Education Strategic Plans and some major education programmes. The next section of Educational Planning goes through critical concepts and techniques such as School Mapping, target setting and projection of educational indicators, how to plan capacity development, how to estimate necessary costs and how to raise funds for required activities. The last section of Monitoring and Evaluation covers key concepts on statistical analysis, review of annual plans, expenditure review, unit cost analysis, and how to evaluate results of the plan through Project Design Matrix. It should be noted that each section has plenty of applications exercises, case studies and discussion topics in order to make learning more practical and joyful.
It is important that this manual is seen by all those involved in planning and management, at different levels, as a source of information and guidance. The manual has been designed as a practical guide and should be particularly useful for anybody involved in education delivery in any sort of planning, coordination or governance capacity.
The GES wishes that this manual contributes to the establishment of firm management cycles at the decentralised levels and to the delivery of better quality education services to children in the country.
ACKNOWLEDGEMENT
The Ghana Education Service sincerely acknowledges the immense technical and financial support of the Japanese International Cooperation Agency (JICA) both for the development as well as the printing of this manual.
The GES gratefully acknowledge valuable inputs received from the expertise and experiences of the following Institutions which formed the Consortium to develop this manual: Ghana Institute of Management and Public Administration (GIMPA), Institute for Educational Planning and Administration (IEPA) University of Cape Coast, Centre for Educational Policy Studies (CEPS) and the National Centre for Research into Basic Education (NCRIBE) both from the University of Education, Winneba.
Contributors: MOE:
Ms. Emelia Aning Mr. Ernest Otoo GES:
Mr. Stephen Adu Mr. Chris Koramoah Mr. Samuel Manteaw Mr. Seth O. Baiden Mr. Fred Birikorang Mr. Sulemana Yusif Mr. Richard Ayitey Mr. Daisuke Kanazawa (JICA Expert)
GIMPA:
Dr. Fred Kofi Asiedu Dr. Albert Tenga Mr. Daniel Hammond IEPA:
Dr. George K.T. Oduro
Dr. Michael Amakyi Dr. Yaw A. Ankomah Mr. Stephen K. Atakpa
CEPS:
Dr. George Kankam Mr. Edison Pajibo Mr. Cosmos K. Dzikunu
Mr. Daniel Yelkpieri Mr. Peter Kwegyir - Aggrey
Ms. Benedicta Akrono
Dr. Samuel Asare-Amoah
NCRIBE:
Dr. Richard Ofori Dr. Eric D. Ananga Dr. Luke Akaguri Ms. Patricia M. Amos Mr. Benjamin
Aiduenu
Dr. Seidu Alhassan
1 | P a g e
SECTION 1: GENERAL INTRODUCTION
Objectives of this manual
Strong capacity of district officers in planning and management in education is the key for successful decentralisation of the education system and for improving access to and quality of education services in the country. This manual is mainly meant to expose trainees to necessary knowledge and skills for operational planning and performance review at the district level. However, the knowledge and skills introduced in this manual are not restricted to district officers but also quite useful to education officers at the headquarters and regional offices for management at their levels.
Structure of this manual
This manual has the following sections:
Section 1: General Introduction
Section 2: Sector Performance Management Section 3: Education Policies and Strategies Section 4: Educational Planning
Section 5: Monitoring and Evaluation
These are the areas that need good understanding for preparation of the operational plans and its monitoring and evaluation. Each section is divided into two to six units according to its necessity.
Each section provides not only theoretical details of the key concepts but also various application exercises for acquiring practical skills to utilise the knowledge.
At the end of each unit, information on reference documents is provided for further studies.
How to use this manual
This manual is mainly used for the training programme organised by the GES headquarters for district education operational planning and performance review, targeting district planning and statistics officers. However, this should be always referred to whenever the ADEOP and the ADPR are prepared by district offices.
2| P a g e
INTRODUCTION
The Sector Performance Management section of the Ghana Education Service District Planning and Performance Review Training Programme is designed to equip district educational planners and managers in charge of implementing educational policies, programmes and projects with the right tools and techniques to determine if their programs and initiatives are on track and in consonance with the national education strategic plan. The section will introduce new concepts and ideas on how to improve planning activities and encourage planners to work productively with all stakeholders and communities.
The section will take the participants through how to build and use performance measurement framework based on the Annual District Education Operational Plan (ADEOP) and the Annual District Performance Review (ADPR). The Annual District Education Operational Plan and the Annual District Performance Review templates provide guidelines for performance reporting in the education sector. The preparation of the ADEOP presents an opportunity for the District Education Director to involve all stakeholders and partners in the processes. In other words District Education officers must see this new process as an opportunity to share with the stakeholders the authority and responsibility for results by working together towards achieving common goals and mutual benefits.
The section is divided into two units. These are Result Based Management (RBM) as Unit 1 and Project Cycle Management (PCM) as Unit 2. Unit 1 will cover Result Based Management and other related topics such as performance measures and performance indicators. The second unit will cover Project Cycle Management, Quality Management (Plan–Do-Check-Act), Project Logical Framework and Problem Tree.
The RBM unit discusses the key concepts, principles and features of Results Based Management. The objective is to deepen participants understanding of result chains, indicators and performance measurement. It will equip participants with knowledge and skills to establish performance measurement related instruments for monitoring, controlling and evaluating the projects and programs in the education sector.
The Project Cycle Management unit introduces the concept of Total Quality Management. It also describes the project cycle and the various activities that take place at the stages of the cycle. The section will also discuss some key issues and concepts and other related tools such as the Logical Framework and Problem Analysis.
3 | P a g e
Learning objectives
By the end of the Sector Performance Management section participants will be able to;
Under RBM:
explain the key concepts of results-based management
describe the features and phases of result-based management differentiate between activities and results
determine the appropriate method, procedures and techniques for collecting and analysing data for performance measurement.
develop a strategy for communicating results,
Under PCM:
explain the purpose and benefits of process approach and quality management appreciate the PDCA cycle and its application in project planning, monitoring and
evaluation.
understand the role of project cycle and the key activities to be undertaken at each stage
understand the principles of project cycle management (PCM) and the logical framework approach
explain the principles of project cycle management identify the phases of project cycle management
explain the usefulness and benefits of the log frame in project planning, monitoring and evaluation
4 | P a g e
UNIT 1: RESULTS BASED MANAGEMENT (RBM)
It is said that if you do not know where you are going, any road will take you there. This lack of direction is what results-based management approach is designed to avoid. It is about choosing a direction and destination (first) and then deciding on the route and intermediary stops required to get there, checking progress against a map and making course adjustments as required in order to realise the desired objectives.
Traditionally, the emphasis of MMDAs has been on managing inputs and activities, hence most agencies have not been able to demonstrate credible results to stakeholders. Increasingly, public institutions including ministries, departments and agencies are being asked to account for resources allocated for developmental activities. Specifically, in the education sector, the citizenry are demanding better quality education. In response to these demands, the Ghana Education Service (GES) has introduced some measures to improve and increase effectiveness and efficiency in service delivery. As part of the decentralisation process for the sector, new processes and methods are being introduced to enhance service delivery. This accounts for the introduction of Result-based Management or Performance Management approaches for addressing some common challenges and issues confronting the District and Regional Education offices.
Currently, all Regional and District Education Offices are expected to complete an annual performance report. The Annual District Performance Report indicates the results achieved in relation to planned activities, programs, projects and policies within a given time frame. Specifically, the District Education Office must provide the head office with information on key education sector performance indicators in the following areas:
Equitable access to education; Quality education;
Education management;
Science and technology and TVET.
What is Results-Based Management?
Results Based Management also referred to as Performance management can be defined as a broad management strategy aimed at achieving important changes in the way government agencies operate, with improving performance (achieving better results) as the central orientation.. Results Based Management focuses on:
Performance issues ( efficiency, effectiveness and quality of service) Devolution of management authority and responsibility
Orientation to stakeholder needs, expectation and preferences Reform of budget processes and financial management systems Application of modern management practices
5 | P a g e
The approach focuses on getting the right design early in a process, focusing on outcomes, implementing performance measurement, learning and changing, and reporting performance.
Performance measurement is concerned more narrowly with the production or supply of performance information; it focuses on clarifying objectives, developing indicators, collecting and analysing data on results. Performance management encompasses performance measurement, though it is broader in essence. It is also concerned with generating management demand for performance information. In an effective performance management system, achieving results and continuous improvement based on performance information is central to the management process.
Why Result Based Management
RBM seeks to overcome what is commonly called the “activity trap”, i.e. getting so involved in the nitty-gritty of day-to-day activities that the ultimate purpose or objectives are forgotten. This problem is pervasive in many organisations. For instance, project and programme managers frequently describe the expected results of their project/programme as, “We provide policy advice to partners”, “We conduct in-service training for teachers", “We provide the pupils with adequate feeding from capitation grant", etc. These descriptions focus more on the type of activities undertaken rather than on the ultimate changes that these activities are supposed to introduce, (e.g. in relation to school pupils performing well in external examinations such as BECE and WASCE, etc ).
An emphasis on results requires more than the adoption of new administrative and operational systems, it needs above all a performance-oriented management culture that supports and encourages the use of new management approaches. While from an institutional point of view, the primordial purpose of the RBM approach is to generate and use performance information for accountability reporting to external stakeholders and for decision-making, the first beneficiaries are the managers themselves. They will have much more control over the activities they are responsible for, be in a better position to take well-informed decisions, be able to learn from their successes or failures and be better equipped to share this experience with their colleagues and all other stakeholders.
Rationale for Results-Based Management in the Educational Sector
The ESP 2012- 2020, ADEOP and ADPR have all adopted the result based approach, which focuses on management improvement and performance reporting (accountability). The rationale for using this approach is to promote the use of performance information for management learning and decision-making processes. The ADPR provides information on performance indicators and results achieved in operations and projects planned in the ADEOP. ADEOP is to guide in resource allocation. In performance based budgeting, funds are allocated across an agency's program based on results rather than inputs or activities.
6| P a g e
Accountability –for- results is when performance information is used for reporting to external stakeholder audiences such as head office, donors, communities and agencies etc.
Managing for Results- it refers to the situation when performance information is used in internal management processes with the aim of improving performance and achieving better results. Too often, the District Education Office's emphasis is on performance measurement for external reporting only- that is to the Head Office. Very little attention is given to putting performance reporting to use in internal management decision –making processes.
Decentralised education planning and decision making require that performance information becomes integrated into key management systems and processes at the DEO; such as strategic planning, policy formulation, programme and project management, financial and budget management and human resource management.
Improving Budgetary Decisions and Allocation of Resources- Resource based management ensures that resources are allocated to those programs that achieve the best results and move away from poor performing activities. There is emphasis on performance based -budgeting rather than the cost of inputs and activities which has been the traditional approach. GES is moving away from activity based budgeting to performance/results based budgeting.
Discourage the Dominance of Political Consideration in Resource Allocation: Political considerations will continue to play a role in budget allocation. However, performance measurement must become an important source of information that feeds into the budget decision–making process.
The Processes or Phases of RBM
The formulation of expected results is part of an iterative process which goes along with the definition of a strategy for a particular challenge or task. The two concepts – strategy and expected results - are closely linked, and both have to be adjusted throughout the programming process so as to obtain the best possible desired end.
In general, organisational RBM practices can be cast into twelve processes or phases, of which the first seven relate to results-oriented planning.
1) Analysing the problems to be addressed and determining their causes and effects; 2) Identifying key stakeholders and beneficiaries, involving them in identifying
objectives and in designing interventions that meet their needs; 3) Formulating expected results, in clear, measurable terms;
4) Identifying performance indicators for each expected result, specifying exactly what is to be measured along a scale or dimension;
5) Setting targets and benchmarks for each indicator, specifying the expected or planned levels of result to be achieved by specific dates;
7 | P a g e
results shall be realised, identifying main modalities of action reflective of constraints and opportunities and related implementation schedule;
7) Balancing expected results and the strategy foreseen with the resources available; 8) Managing and monitoring progress towards results with appropriate performance
monitoring systems drawing on data of actual results achieved;
9) Reporting and self-evaluating, comparing actual results vis-à-vis the targets and reporting on results achieved, the resources involved and eventual discrepancies between the “expected” and the “achieved” results;
10) Integrating lessons learned and findings of self-evaluations, interpreting the information coming from the monitoring systems and finding possible explanations to eventual discrepancies between the “expected” and the “achieved”.
11) Disseminating and discussing results and lessons learned in a transparent and iterative way.
12) Using performance information coming from performance monitoring and evaluation sources for internal management learning and decision-making as well as for external reporting to stakeholders on results achieved.
What is a Result?
A result can be defined as a describable and measurable change in state due to a cause and effect relationship induced by an intervention. Expected results are answers to problems identified and focus on changes that an intervention is expected to bring about. A result is achieved when the outputs produced further the purpose of the intervention.
It often relates to the use of outputs by intended beneficiaries and is therefore usually not under full control of an implementation team
How to Formulate Expected Result
Formulate expected results from the Perspective of the beneficiary
Formulating expected results from the beneficiaries' perspective will facilitate focusing on the changes expected rather than on what is planned to be done or the outputs to be produced. This is particularly important for educational planning at all levels, where the MOE seeks to respond to the national education development priorities (of a country). The planning for expected results begins at the school level to the cluster level and then to district, regional and national level. Participation in educational planning at all these levels is the key for improving the quality, effectiveness and sustainability of interventions in the sector.
When defining an intervention and related expected results one should therefore ask: Who participated in the definition of the expected results?
Were key project stakeholders and beneficiaries involved in defining the scope of the project and key intervention strategies?
8| P a g e
Use Change Language Rather than Action Language
The expected result statement should express a concrete, visible, measurable change in a state of affairs or a situation. It should focus on what should be different rather than what is to be done and should express the difference as concretely as possible.
Make sure your expected results are SMART
Although the nature, scope and form of expected results differ considerably, an expected result should meet the following criteria (be “SMART”):
Specific: It has to be exact, distinct and clearly stated. Vague language or generalities are not results. It should identify the nature of expected changes, the target, the region, etc. It should be as detailed as possible without being wordy. Measurable: It has to be measurable in some way, involving qualitative and/or
quantitative characteristics.
Achievable: It has to be achievable with the human and financial resources available ('Realistic').
Relevant: It has to respond to specific and recognised needs or challenges and to be within mandate.
Time-bound: It has to be achieved in a stated time-frame or planning period.
Action Language Change Language
… Expresses results from the provider’s perspective:
To promote literacy by providing
schools and teaching material.
….can ofte n be interpreted in many ways:
To promote the use of computers.
…. Focuses on completion of activities:
To train teachers in participatory
teaching
… describes changes in the conditions of beneficiaries:
Young children have access to school
facilities and learn to read and write.
… sets precise criteria for success:
People in undersupplied areas have
increased knowledge of how to benefit from the use of a computer and have access to a computer.
… focuses on results, leaving options on how to a chieve them (how this will be achieved will be clarified in the activity description):
Teachers know how to teach in a
9 | P a g e
Once a draft expected results statement has been formulated, it is useful to test its formulation by going through the SMART criteria. This process enhances the understanding of what is pursued, and is of help in refining an expected result in terms of their achievability and meaningfulness. Example: if we consider a work plan to be undertaken in a specific country that includes the expected results statement “Quality of primary education improved”, the application of the SMART questioning could be as follows:
1. Is it “Specific”?
What does “quality” actually mean in this context? What does an “improvement” of quality in primary education amount to concretely? Who are the relevant stakeholders involved.”
2. Is it “Measurable”?
Can I find manageable performance indicators that can tell about the level of achievement? Possible Performance Indicators could be:
- % of teachers following the curriculum developed on the basis of the new education plan (baseline 0%, benchmark 60%).
- % of schools using quality teaching material (baseline 10%, benchmark 90%).
3. Is it “Achievable”?
Do I have enough resources available to attain the expected result? I need to consider both financial and human resources. If the answer is negative, I have to either reconsider and adjust the scope of the project or mobilize additional resources.
4. Is it “Relevant”?
Is the expected result coherent with the upstream programming element based on its domains? If the answer is negative I should drop the activity.
5. Is it “Time-bound”?
The expected result should be achievable within the given timeframe for programming processes this period.
Find a proper balance among the three Rs
Once an intervention is formulated, it can be useful to check and improve its design against yet another concept – namely, establishing a balance between three variables Result, Reach and Resources. Results (describable and measurable change in state that is derived from a cause and effect relationship), Reach (the breadth and depth of influence over which the intervention aims at spreading its resources) and Resources (human, organisational, intellectual and physical/material inputs that are directly or indirectly invested in the intervention).
10| P a g e
What is the Relationship among Interventions, Outputs and Results?
Interventions, outputs and results are often confused. Interventions describe what we do in order to produce the changes expected. The completion of interventions leads to the production of outputs. Results are finally the effects of outputs on a group of beneficiaries. For example, the implementation of training workshops (activity) will lead to trainees with new skills or abilities (outputs). The expected result identifies the behavioural change among the people that were trained leading to an improvement in the performance of, say, an institution the trainees are working in, which is the ultimate purpose of the activity. If we move our focus from what we do to what we want the beneficiaries to do after they have had the benefits of our intervention, we may realise that additional types of activities could be necessary to make sure that we will be able to achieve the expected results. It is important that a project is driven by results and not activities.
Defining expected results: Is not an exact science;
includes a solid understanding of the socio-economic, political and cultural context; is influenced by available resources, the degree of beneficiary reach and potential
risk factors ;requires participation of key stakeholders.
The Performance Measurement Strategy
On-going performance measurement is the regular collection of information for monitoring progress and accomplishment. In the education sector, key performance indicators are developed during the strategic planning stage and this is used in ADEOP and for other budgetary purposes. There is always the need to collect regular performance data on the key indicators in order to have regular performance snapshots and ultimately to improve the access to quality education at the basic and secondary levels.
Obtaining objective and relevant performance data requires a robust performance measurement strategy that addresses the following:
1. Performance indicators; 2. Data collection; and
3. The analysis and use of data
Identifying Indicators
Indicators are based on the programme or project's logical links and provide qualitative and quantitative information about the occurrence of an activity, output or outcome:
Qualitative indicators: This is expressed in a narrative form, for example, people reporting easier access to information.
Quantitative indicators: This is expressed numerically, for example, the percentage of school pupils provided with the required text books.
11 | P a g e
indicators will provide a measure of the success of the project/programme in terms of efficiency and effectiveness. Is the project or programme effective in meeting its intended outcomes, within budget and without unwanted negative outcomes? Is the initiative making progress toward the achievement of the final outcomes?
When selecting performance indicators, it is important to bear the following in mind:
Uses and users: Ask, senior management and other stakeholders what their information wants and needs are (they may have specific reporting commitments or important management decision time lines which will benefit from your indicators).
Comparability: Select indicators that are consistent with those specified in the Education strategic plan of other departments. This allows comparisons to be made and helps in gauging the relative effectiveness of the initiatives.
Timing: Certain indicators will show earlier progress and others will require more time to enable relevant interpretation. Aim to schedule a progression of indicators to support timely decision making and reporting.
Balancing: Achieve a balance between both qualitative and quantitative indicators to create a more powerful performance story about the impact of the initiative.
The performance measurement framework team leads the process for developing performance indicators. It is essential to include a validation with partners, as they are accountable for demonstrating success against these indicators.
Collecting Data
Measuring performance against indicators requires a supporting data collection strategy, a system to store and retrieve data, and the data itself.
The following factors should be considered when developing a data collection strategy:
Method of collection: Choose a data collection method that is a good match for the type of indicator and purpose of the data being gathered. For example, qualitative feedback is often gathered through interviews, focus groups and case studies. Quantitative feedback is often gathered from questionnaires, and initiative records such as number of applicants or recipients. Each collection method has its advantages and inconveniences.
12| P a g e
Responsibility for collection: When determining roles and responsibilities be sure to define who is responsible for collecting and analysing which data throughout the initiative's life cycle and that appropriate resources are available.
Cost: Estimate the human resource and financial requirements for collecting data..
A data collection system can be as simple as a paper system to collect data against a few indicators, a spreadsheet collecting actual data against a target, or a centralised automated data collection system that feeds off program transactions and other outputs. A small system is often sufficient for data collection. The cost of any system should be considered in relation to the size of the initiative being measured. As the data collection process begins, it will become apparent what works well and what does not, and modifications can be made along the way.
Try to establish a baseline measure for at least some of the indicators, i.e., establishing the “pre-initiative” performance picture. This baseline will help in establishing “in initiative” and “post initiative” targets and in gauging the progress made. Targets can be expressed quantitatively, as an absolute or relative value, or qualitatively.
The performance measurement framework team is responsible for leading the development of the data collection strategy. Ultimately, the strategy will be an appropriate trade-off between ease of collection, balance, time lines, relevancy and cost. Remember to seek stakeholders' involvement in the process and to obtain their approval before going ahead with the strategy.
Analysing Data and Using Information
From an application perspective, there will be a time lapse between building the performance measurement framework and using it to manage better. Between the data collection and performance reporting phases of the lifecycle, it is necessary to analyse data
and interpret what the numbers and qualitative feedback are saying. Although the
performance measurement framework team may not be responsible for conducting the analysis, it has to identify who will be analysing data and who will be involved in the attribution conversations. Data analysis begins with reviewing the data for accuracy, completeness, and consistency and then choosing the analytical strategy that provides the best evidence upon which to make decisions. Data can be summarised and organised using some of the following techniques:
Describing and counting: These are two of the most common analytical techniques, and are often required as the basis or context for further data analysis. Aggregating: This is the process of grouping (or clustering) data by identifying
characteristics or patterns that seem to link them. It is the beginning of the process to determine whether or not relationships exist among different variables.
13 | P a g e
units. Disaggregated data can be examined in different ways (e.g. over time, cross different populations and between two comparison groups). If the data are coded, they may already be broken down into categories.
Comparing: This covers a range of methods that can be used to draw conclusions about the relationships among data and make generalisations to large populations. It involves contrasting a person or population against itself or another comparison group/standard, and is typically done later in the initiative's life cycle. Data can also be compared using a variety of analytical approaches, such as regression and correlation analyses.
Using independent assessments: In the case of a large, high profile, programme to which significant funding has been allocated, it may be necessary to involve independent experts in the field, such as academics, auditors, consultants and independent think-tanks to assist in the data analysis and interpretation process. This will also promote a perception of fairness and objectivity in the assessment of results.
The analysed data become the evidence that the performance measurement framework team and partners will use in assessing the efficiency and effectiveness of the initiative and in determining where modifications could create performance improvements (e.g. modifying the target population, producing additional volume of outputs, changing the delivery mechanism to beneficiaries, modifying outputs and so on).
Evaluation
Evaluation is a periodic in-depth look at how the initiative is doing. It is used early in the initiative's lifecycle to identify opportunities for improvements, to facilitate the achievement of outcomes, and later in the cycle to determine the degree to which the initiative led to the achievement of desired outcomes.
In order to be able to evaluate the initiative, data that respond to specific evaluation issues must be collected. Identify these issues early in the initiative and, ideally, with the participation of evaluation specialists. The periodic or formative evaluation focuses on examining management issues such as how the initiative is being implemented, whether or not adjustments are necessary, and whether or not progress toward the achievement of outcomes is occurring. The later or summative evaluation is undertaken when the initiative has been in place long enough to realistically expect that some outcomes have been achieved. The evaluation focuses on the following three primary issues:
Relevance: Does the initiative continue to be consistent with departmental and government-wise priorities, and does it realistically address an actual need?
Success: Is the policy, program or initiative effective in meeting its intended outcomes, within budget and without unwanted negative outcomes? Is the policy, program or initiative making progress toward the achievement of the final outcomes?
14| P a g e
Application Exercises
It is important to identify the initiative-specific criteria that relate to the evaluation issues and to plan how to collect the data that will support these criteria. Ideally, aim to integrate the collection methods for the evaluation data with those for the ongoing performance measurement.
The Reporting Strategy
The reporting strategy outlines a plan for systematically reporting on performance results gleaned from on-going measurement, and formative and summative evaluation. The following are examples of some reporting strategies:
Time lines: Establish clear reporting time lines for all officers and stakeholders. Reporting formats: Have a template format for collecting data.
Selecting evidence: Select, from the analysed data, the pieces of evidence that collectively tell the balanced story, and not just the “subjective best story”. Judgment and transparency should prevail.
Discussing attribution: Use the report to illustrate the cause and effect between the programme outputs and the set of outcomes as well as to discuss how other factors have influenced results.
Making the report accessible: Know whom you are trying to reach with the reports and how to make the reports accessible to them on a timely basis. Include a communications and distribution plan in the reporting strategy.
Estimating costs: Determine the funding necessary to successfully carry out the reporting strategy.
The reporting strategy reinforces transparency and accountability, and helps stakeholders' meet their reporting and governance obligations.
Exercise 1
Inyour group discuss the following questions with regard to educational planning and your work
1. What happens when an objective is vague? 2. What can happen if objective is not achievable?
15 | P a g e
Exercise 2
It is time to check your understanding of the difference among activity, output and results. Please indicate the column that best describes each item.
Further Reading
1) Results-Based Management and Accountability Lexicon
http//www.tbs-sct.gc.ca/eval/pubs/RMAF – CGRR/rmaf-cgrr-06-e.asp.
2) Guide for the Development of Results-Based Management and Accountability Frameworks
http//www.tbs-sct.gc.ca/eval/tools-outils/rmaf_cvgar-e.asp.
3) “A Handbook for Measuring Employee Performance” www.feddesk.com
No. Items Activity Output Result
1 Trains employees 2 A completed case 3 Writes Agency Policy
4 Promote the use of computers
5
Increased awareness of causes of Mal Nutrition among under 5 years olds (under 5 year olds are now fed adequate and more nutritious food due to increased awareness of causes of mal nutrition)
6
Better understanding of the benefits of computers has made more people in deprived areas to now use
computers
7 Train teachers in participatory teaching
8 Teachers adopt participatory methods to improve teaching and learning in all basic schools 9 Develops software program
16| P a g e
UNIT 2: PROJECT CYCLE MANAGEMENT
Introduction
As planners and managers of basic and second cycle education at the district level, you need tools and techniques which will help you to support the implementation of the education sector strategic plan. The Project Cycle Management Unit introduces the project cycle, describes its phases and explains its role in the planning and management of education sector projects and programme. The Unit will also introduce key concepts of project quality management and other related tools such as the Logical Framework and Problem Analysis which a planner may use for effective and efficient project or programme implementation.
Total Quality Management
The task of a manager is to allocate and use all the resources under his or her control to meet the purposes of the organisation. The successful management of all resources depends on effective planning. You must understand the essentials: first the Education Sector Strategic Plan and the Annual District Education Operation Plans that follow. An introduction to the discipline of Total Quality Management (TQM) or an alternative programme for continuous improvement will help you optimise the use of resources, while a good monitoring of the implementation of your plan will give accurate feedback and allow you to react dynamically.
TQM embodies all the essentials of planning; TQM comprises a continuous set of action plans, involving all activities, all units and sub units, and all individuals in the organisation. Such a discipline optimises the use of all resources. TQM must start with the overall strategic aim. This aim can be revised and reoriented regularly but within unchanged context.
The process of continuous approach never ends, so improvement is always possible, both in planning and operations. Another tool that promotes continual improvement is Process Approach.
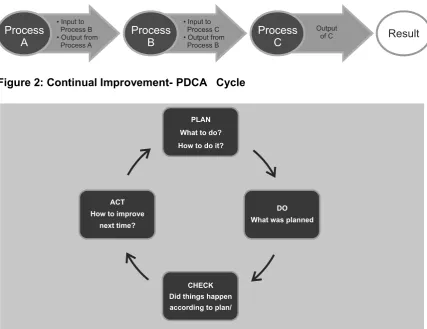
Process Approach
Any activity that receives inputs and converts them into output can be considered as a process, often the output from one process will directly be the input to the next process.
17 | P a g e
Figure 2: Continual Improvement- PDCA Cycle Figure 1: Process Approach
A well-structured planned process will respond to the growing needs and expectations of
Stakeholders:
Process A
• Input to Process B • Output from Process A
Process B
• Input to Process C • Output from Process B
Process C
Output
of C Result
PLAN What to do? How to do it?
ACT How to improve
next time?
DO What was planned
CHECK Did things happen according to plan/
Continual improvement is assured by utilisation of the PDCA Cycle which is a basic process in TQM. Each plan for improvement leads to implementation: monitoring for deviations is followed by corrections. As plans are put into action, inevitably things go wrong. Deviations may be major or minor but the requirement is the same. You must receive accurate feedback that will generate action to resolve or rescue the situation.
Project Cycle Management
The way in which projects are planned and carried out follows a sequence that has become known as the project cycle. The cycle starts with the identification of an idea and develops that idea into a working plan that can be implemented and evaluated.
Ideas are identified in the context of an agreed strategy. It provides a structure to ensure that stakeholders are consulted and relevant information is available, so that informed decisions can be made at key stages in the life of a project.
18| P a g e
differ between institutions, reflecting differences in procedures. However, within all institutions the cycle shares three common themes:
1. The cycle defines the key decisions, information requirements and responsibilities at each phase.
2. The phases in the cycle are progressive – each phase needs to be completed for the next to be tackled with success ct Cycle
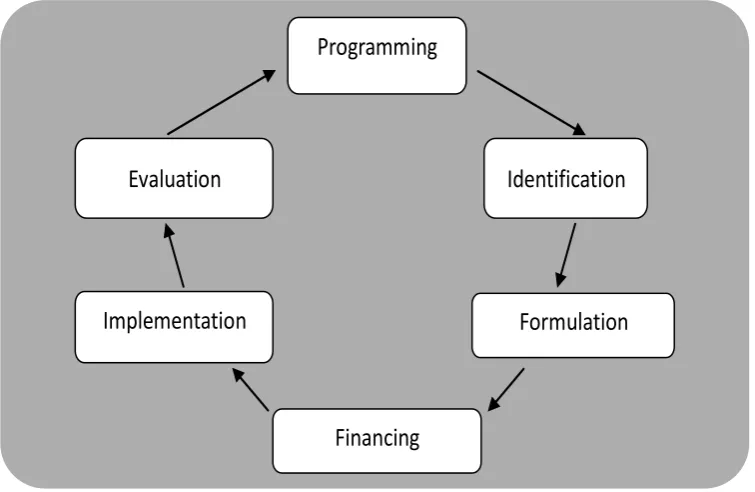
3. The cycle draws on evaluation to build experience from existing projects into the design of future programmes and projects. The phases of the project cycle can be described as follows:
i. Programming
ii. Identification iii. Formulation
iv. Financing
v. Implementation
[image:25.595.110.488.366.612.2]vi. Evaluation
Figure 3: Project Cycle
1. During the Programming phase of the project cycle, the situation is analysed to identify problems, constraints and opportunities which a project could address. This involves a review of socio-economic indicators, and of national and stakeholder priorities. The purpose is to identify and agree on the main objectives and priorities for the education sector, and thus to provide a relevant and feasible programming framework within which projects can be identified and prepared. For each of these priorities, strategies will be formulated that take account of the lessons of past experience.
Identification
Formulation
Financing
Implementation
Evaluation
19 | P a g e
2. During the Identification phase, ideas for projects and other development actions are identified and screened for further study. This involves consultation with the intended beneficiaries of each action, an analysis of the problems they face, and the identification of options to address these problems. A decision can then be made on the relevance of each project idea (both to the intended beneficiaries and to the programming framework), and on which ideas should be further studied during the Formulation phase.
3. During the Formulation phase, relevant project ideas are developed into operational project plans. Beneficiaries and other stakeholders participate in the detailed specification of the project idea that is then assessed for its feasibility (whether it is likely to succeed) and sustainability (whether it is likely to generate long term benefits for the beneficiaries). On the basis of this assessment, a decision is made on whether to draw up a formal project proposal and seek funding for the project.
4. During the Financing phase, project proposals are examined by the funding agencies, and a decision is taken on whether to fund the project. The funding agency and partner country agree the modalities of implementation and formalise these in a legal document which sets out the arrangements by which the project will be funded and implemented.
5. During the Implementation phase, the project is mobilised and executed. This may require the tendering and award of contracts for technical assistance or works and supplies. During implementation, and in consultation with beneficiaries and stakeholders, project management assesses actual progress against planned progress to determine whether the project is on track towards achieving its objectives. If necessary the project is re-oriented to bring it back on track, or to modify some of its objectives in the light of any significant changes that may have occurred since its formulation.
6. During the Evaluation phase, the funding agency and partner country assess the project to identify what has been achieved, and to identify lessons that have been learned. Evaluation findings are used to improve the design of future projects or programmes.
Although in the generic cycle the evaluation phase comes after implementation, it is common practice also to conduct a mid-term evaluation during implementation, to identify lessons that can be applied during the remaining life of the project.
The Project Cycle Management (PCM) method is a tool for managing the entire cycle of development assistance project- Planning, implementation, evaluation- by using a format of project summary called a Project Design Matrix (PDM). PDM includes such components as “objectives”, “activities” “inpu ts” and shows logical relationship of these components.
20| P a g e
Too often the conceptualisation and programming for interventions does not involve stakeholders at the community level in the process. Successful programme implementation requires the active involvement and participation of the stakeholders (Stakeholder Analysis must cover institutions and people who have interest such as beneficiaries, potential opponents, implementing agencies, decision –makers and funding agencies) for the programme. The purpose of the project cycle is to ensure that the stakeholders take the decisions, and that decisions are based on relevant and sufficient information.
The separation of the cycle into six phases provides the minimum basis for effective project preparation, implementation and evaluation. The separation of the Identification and Formulation phases is particularly important. Project preparation takes place in a social and political context, where expectations are raised and often-conflicting demands and aspirations must be reconciled. By adhering to the identification phase, the relevance of project ideas can be systematically established before the preparation process is too far advanced for the idea to be dropped. During the formulation phase, project ideas can then be fully developed in the knowledge that they are based on real beneficiary needs and are sufficiently ‗owned‘ by the main stakeholders.
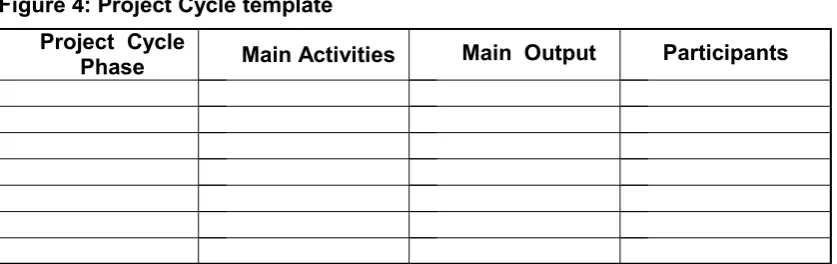
[image:27.595.83.502.551.683.2]In practice, the project cycle might differ according to the type of programme being operated. Nevertheless, it is very useful to reconcile the current practice within your area of work with the steps of the project cycle as outlined here. The following blank table provides you with a framework to do so.
Figure 4: Project Cycle template Project Cycle
Phase Main Activities Main Output Participants
Rationale for Project Cycle Management
Project Cycle Management (PCM) is a tool for improving the quality of project design and management and thereby to improve effectiveness of programme implementation at both the national and district levels. PCM developed out of an analysis of the
Participatory Methods
The better and more participatory the method for identification, the more likely it is that the project will be beneficial to the community. Participatory methods also give particular insight into the distribution of power within the target groups. The challenge is how to manage these interest and opportunities with them.
21 | P a g e
effectiveness of development aid undertaken by the OECD Development Assistance Committee during the late 1980‘s. Evaluation findings from the DAC members indicated that a significant proportion of development projects had performed poorly, and identified a number of causes:
Poor project planning and preparation Many projects not relevant to beneficiaries Risks were insufficiently taken into account
Factors affecting longer-term sustainability of project benefits were ignored Lessons from past experience were rarely incorporated into new policy and
practice
Principles of Project Cycle Management
The principles of PCM can be summarised as follows:
1. Adherence to the phases of the project cycle to ensure a structured and well-informed decision-making process.
2. Client orientation through the use of participatory planning workshops at key phases of the project cycle, and the formulation of the Project Purpose in terms of sustainable benefits to be delivered to beneficiaries.
3. Incorporation of aspects of sustainability into project design to ensure sustainable benefits.
4. Use of the Logical Framework Approach to ensure a consistent and analytical approach to project design and management.
5. An integrated approach which links the objectives of each project into the objectives of the national and sectoral objectives within the partner country; ensures that project workplans and budgets are prepared on the basis of the project logframe; and using the basic format to ensure consistent and comprehensive treatment of key issues throughout a project‘s life. PCM brings together management principles, analytical tools and techniques, and applies them within the structured decision-making process of the project cycle to ensure that projects relevant to agreed strategy and to the real needs of beneficiaries. The core tool used in project planning and management is described the Logical Framework Approach.
The Logical Framework Approach
The Logical Framework Approach (LFA), Logic model or log frame is an analytical tool for graphically conceptualising and presenting cause and effect relationships of how project resources and activities will contribute to achievement of objectives or results. It is an effective tool for project planning. It is therefore important for any planner to understand the tool and its application. In planning, log frame can be used to;
structure the analysis of the current situation; establish a logical hierarchy of objectives;
structure ways and means by which these objectives will be achieved;
identify the potential risks to achieving the objectives and expected outcomes; and
• • • • •
22| P a g e
establish how outputs and outcomes might be monitored, reviewed and evaluated.
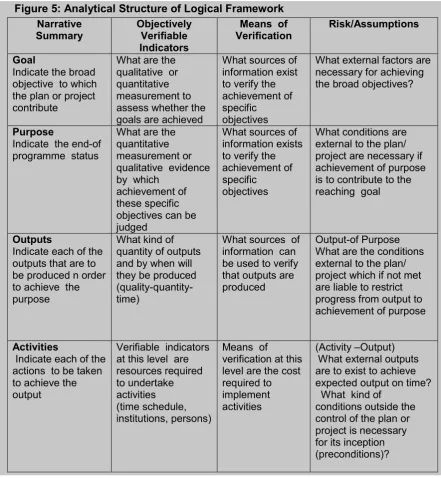
[image:29.595.74.516.256.735.2]The Logframe is often presented as a matrix format displaying the project design logic i.e. (a) it indicates the links and relationship among project inputs, activities, outputs, purpose and goals, (b) identifying the indicators and sometimes targets that will be used to measure progress (c) identifying data source or means of verification (d) assessing risks or assumptions about external factors beyond the control of the project management that may affect achievement of results. Figure 5 below is a an analytical structure of a logical frame work Approach (Logical Framework Matrix (LFM) is the output of LFA)
Figure 5: Analytical Structure of Logical Framework
Narrative
Summary Objectively Verifiable Indicators
Means of
Verification Risk/Assumptions
Goal
Indicate the broad objective to which the plan or project contribute
What are the qualitative or quantitative measurement to assess whether the goals are achieved
What sources of information exist to verify the achievement of specific
objectives
What external factors are necessary for achieving the broad objectives?
Purpose
Indicate the end-of programme status
What are the quantitative measurement or qualitative evidence by which
achievement of these specific objectives can be judged
What sources of information exists to verify the achievement of specific
objectives
What conditions are external to the plan/ project are necessary if achievement of purpose is to contribute to the reaching goal
Outputs
Indicate each of the outputs that are to be produced n order to achieve the purpose
What kind of quantity of outputs and by when will they be produced (quality-quantity-time)
What sources of information can be used to verify that outputs are produced
Output-of Purpose What are the conditions external to the plan/ project which if not met are liable to restrict progress from output to achievement of purpose
Activities
Indicate each of the actions to be taken to achieve the output
Verifiable indicators at this level are resources required to undertake activities (time schedule, institutions, persons)
Means of verification at this level are the cost required to implement activities
(Activity –Output) What external outputs are to exist to achieve expected output on time?
23 | P a g e
Adapted from the National Education Sector Development Plan: A result- Based Handbook
For its effective use, the log frame must be prepared using a collaborative process involving all the stakeholders both internal and external. This approach may be time consuming but it‘s essential that a participatory approach is used to enhance ownership of the project by all those who have interest in the project. Many projects have become white elephants because the beneficiaries of the project were not consulted by the designers of the project.
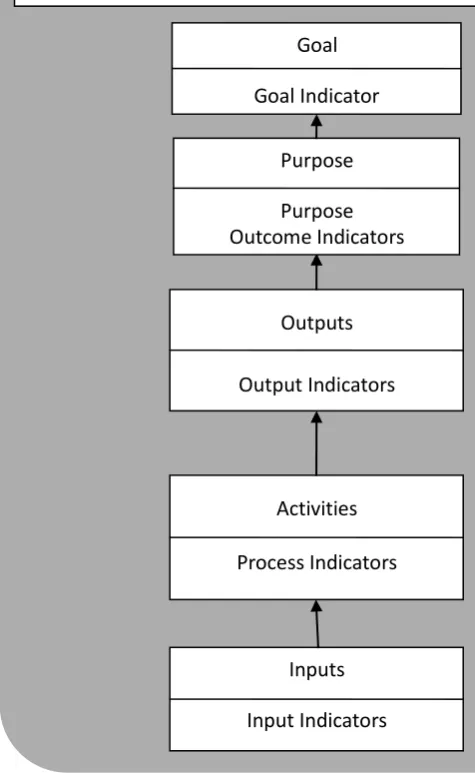
Figure 6 provides a typical version of the analytical structure of a Log frame, showing the five- level hierarchy used mostly in planning and the type of indicators associated with each level. Note that for some levels the terms used for the hierarchy level may differ from the term used for its associated indicator.
The Log frame as a tool is built on the planning concept of a hierarchy of levels that link project inputs, activities, outputs, purpose and goal, therefore it is based on a cause-and-effect relationship among these elements, with those objectives at the lower level contributing to the attainment those of the higher levels. Inputs are used to undertake project activities (processes) that lead to the delivery of outputs, that lead to the achievement of project purposes (outcomes) that contribute to a longer-term and broader project goal (impact).
24| P a g e
Figure 6: Project Log frame Hierarchy Levels and Types of Indicators
Basic Components of the Log frame
As you conceptualise your program, begin by describing your basic assumptions and then add the following program components in the order that they should occur. Conceptualising your program is the beginning of the planning stage of your project. It must therefore start by envisioning what you want to see/achieve at the end of the project i.e. the impact/goal followed by purpose/outcomes, outputs, activities and inputs.
1. Inputs are the financial, material and human resources used on predetermined activities to produce project outputs.
2. Activities are the processes, techniques, events, and actions of the planned program that are executed to produce the outputs (products and services) which are then used by the beneficiaries to bring about the desired changes (outcomes/purpose). The products may include —
Inputs
Input Indicators
Activities Process Indicators
Outputs
Output Indicators
Purpose Purpose Outcome Indicators
Goal
Goal Indicator
25 | P a g e
promotional materials, educational curricula, constructed school buildings/infrastructure, etc; services include—education and training, counselling, or health screening.
3. Outputs are the direct results of program activities. They are usually described in terms of the size and/or scope of the services and products delivered or produced by the program. They indicate if a program was delivered to the intended audiences at the intended “dose”. A program output, for example, might be the number of classes taught, meetings held, or materials produced and distributed; program participation rates or hours of each type of service provided.
4. Outcomes are specific changes in attitudes, behaviours, knowledge, skills, status, or level of functioning expected to result from the application/use of outputs (the products and services) of the program and are most often expressed at an individual level.
5. Impacts are organisational, community, and/or system level changes expected to result from continuous long-term outcomes of the programme. They might include improved conditions, increased capacity, and/or changes in the policy arena. Thinking about a program in logic model terms prompts the clarity and specificity required for success, and is often demanded by funders and your community. Using a simple logic model produces (1) an inventory of what you have and what you need to operate your program; (2) a strong case for how and why your program will produce your desired results; and (3) a method for program management and assessment.
Problem Analysis
Another tool which is a useful expansion of the idea of the logframe is the problem analysis or problem tree. Like the Logframe, it is a participatory technique in which stakeholders investigate the causes and effects of a problem and to highlight the relationships between them. There are three stages in the process and these are;
the analysis of problems; the analysis of objectives the analysis of strategies
i) Problem Analysis
The problem analysis is of major importance with regard to project planning, since it affects the design of interventions and provides the justifications for undertaking project activities. The activities carried out at the problem analysis stage include;
verification of the subject of analysis,
identification of problems related to the subject- making an inventory of all problems using a participatory approach
establishing the cause and effects hierarchy between the problems visualisation of the cause and effects relations in a diagram
It uses graphic tree diagram to identify the causes and effects of problems (problem tree).
• • •
• •
26| P a g e
ii) Objective Analysis
After problem analysis follow the objective analysis, the output of the objective analysis can be presented as an objective tree. This objective tree resolves those problems presented in the problem tree. In other words, the problems are transformed into the objectives. The objective tree is presented as a mirror image of the problem tree. The analysis therefore require one to:
Translate the negative situations in the problem tree into a positive state Verify the hierarchy of objectives
Visualise the means-end relationship in a diagram
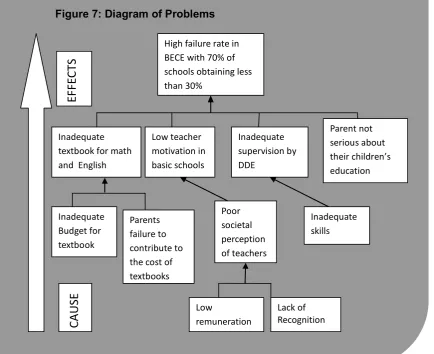
[image:33.595.82.517.302.656.2]The problem tree can be used to identify and structure the hierarchy of problems in the education sector, Figure 8 below is a demonstration case of a problem tree for the poor performance of pupils in the Basic Education Certificate Examinations.
Figure 7: Diagram of Problems
High failure rate in BECE with 70% of schools obtaining less than 30%
Inadequate textbook for math and English
Low teacher motivation in basic schools
Inadequate supervision by DDE
Parent not serious about their children’s education
Inadequate Budget for textbook
Parents failure to contribute to the cost of textbooks
Poor societal perception of teachers
Low
remuneration
Lack of Recognition
Inadequate skills
EF
FE
CT
S
CA
USE
27 | P a g e
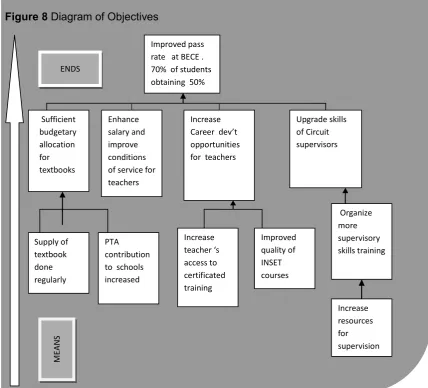
Figure 8 Diagram of Objectives
By turning the core problem identified into a positive statement, you can identify the project‘s purpose- the broader goal to which they will contribute.
Identifying the objective will help project planners to come up with activities - concrete actions that will achieve those objectives. This will provides a general and clear picture of the desired future state w contracts the current reality depicted by the problem tree.
Analysis of Strategy - (Logical links among the problem tree, the objective tree and the log frame)
The problem analysis leads to the formulation of project objectives. After you have formulated the desired future situation in the objective tree, the next task is the selection of interventions or programmes to be rolled out for implementation. The logical framework Matrix illustrates the linkages and logic of activities by identifying and clarifying why possible group of objectives contribute to higher objective, thus, it can be used to establish the relationship between inputs, activities, outputs, outcomes and goals. Outcomes could be classified as immediate outcomes, intermediate outcomes and long- term outcome. Immediate outcomes are the first consequences of
Improved pass rate at BECE . 70% of students obtaining 50%
Sufficient budgetary allocation for textbooks Enhance salary and improve conditions of service for teachers
Increase Career dev’t opportunities for teachers
Upgrade skills of Circuit supervisors
28| P a g e
the output on a targeted population. They tend to be manifested by awareness or knowledge of the output, intermediate tend to be associated with changes in behaviour or state in the target population as a consequence of being informed. The long-term outcomes tend to manifest themselves by changes in societal behaviour beyond the initial target population.
We will attempt to demonstrate how an objective tree can be converted to a log frame. For the purpose of this task we shall use the objective tree for the improved pass rate for the Basic Examination Certificate.
Narrative Summary Objectively Verifiable
Indicators Means of Verification Assumptions/ Risks IMPACT
Improvement in the performance of Pupil at BECE.
Percentage of pupil who passed the BECE increase by 50 %
BECE final results obtainable from WAEC Credible commitment towards improvement of education by all stake holders OUTCOME
Improved access to textbooks and other teaching and learning Materials
Pupil Textbook Ratio Pupil Teacher Ratio
EMIS National budgets for textbook and INSET increased
OUTPUT
Increase in number of Textbooks for all subjects. Increase Workshops for professional development of teachers.
Incentives for teachers increases
# of new textbooks # Number of teachers who have received INSET.
% Increase in the salary of teachers
Human Resource and other Admin data. IPPD Equitable distribution of textbooks at the National and District levels
ACTIVITIES
Support the design of INSET and other professional curriculum for teachers. Develop Awareness campaigns for parents to send their children to #school.
# Number of INSET workshops.
# Number of
Awareness campaigns for parents District Education Office Resources for INSET available Application Exercises Exercise 3
29 | P a g e
how you will apply the steps in the Project Cycle and list the various activities that you think should be conducted at each stage of the cycle. (You may use the project cycle template in figure).
Exercise 4
In your district 40% of children do not have access to good quality child friendly universal basic education. The Ghana Education Service has asked the DEO to submit a plan for improving opportunities for all children in the first cycle of education at kindergarten, primary and junior high school levels, in your group follow the steps below to create a problem tree.
1. Based on the above situation ask why does the problem of lack of access and low quality exist (or what is the cause of the problem?) Write this problem on a card and place it underneath the problem on the flip chart. If there are multiple cause, write each on a separate card and place them next to each other but below the problem
2. For each cause or sub problem continue to ask why until you have reached the root cause of the branch of the problem tree. Write each cause on a separate card and place it under the associated problem
3. If the first cause that your group identifies leads directly to a root cause, then go back to the top of your problem tree and ask why does the problem exist(or what is the cause of the problem?) and complete a second branch of your problem tree
4. Continue this process until you have at least one branch that has tree- sub tree-problems leading to root cause
5. Once your group agrees that the l problem tree is correct and that your cards are placed in the proper Cause- effect, draw arrows between the causes and related effects.
Exercise 5
Convert the problem tree that has just been developed into an objective tree and develop a logic model/log frame for a project to provide equitable access to good-quality child –friendly universal basic education by improving opportunities for all chi ldren in the first cycle education at kindergarten, primary and junior high school levels in your district. You will be provided with a template covering each of the four levels of the Log frame. It is often easier to start at the impact level and work back to inputs. (See Appendix A for an example of Logframe template)
Summary
30| P a g e
activities you will be conducting and what outcomes and impacts are expected to occur as a result of the activities. Project Cycle Management, Logical frameworks and other related tools such as Problem tree analysis are important tools in project planning, implementation and evaluation in that they are simple ways of indicating how to both set and measure attainment of goals and objectives for inputs, outputs, outcomes, and impacts.
Further Reading
Participatory Approaches for an Impact-Oriented Project Cycle. Strengthening the impact orientation of IFAD‘s Project Cycle IFAD, 2001
31 | P a g e
APPENDIX A: Example of a Logframe Template Narrative
Description Defines the intervention logic of each level Verifiable Indicator An Objectively Standard against which we measure performance Means of verification The data source or method used to determine whether the indicators have been attained or not
Assumptions That which is assumed to be in place for the intervention to work and whose absence would entail potential risk Impacts The major health of social changes that occur in our target
population as a result of the outcomes. Outcomes The major behavioural, knowledge, attitudinal & skills changes that occur in our target population as a result of our outputs. Outputs The services we deliver as a result of the inputs.
Inputs The
resources & materials we put into a project