R E S E A R C H A R T I C L E
Open Access
Weather effects on hand, foot, and mouth
disease at individual level: a case-crossover
study
Zhicheng Du
1, Shao Lin
2, Tia Marks
2, Wangjian Zhang
2, Te Deng
3, Shicheng Yu
4and Yuantao Hao
1*Abstract
Background:Hand, foot, and mouth disease (HFMD) raises an urgent public health issue in the Asia-Pacific region, especially in China. The associations between weather factors and HFMD have been widely studied but with inconsistent results. Moreover, previous studies utilizing ecological design could not rule out the bias of exposure misclassification and unobserved confounders.
Methods:We used case-crossover analysis to assess the associations of weather factors on HFMD. Individual HFMD cases from 2009 to 2012 in Guangdong were collected and cases located within 10 km of the meteorological monitoring sites were included. Lag effects were examined through the previous 7 days. In addition, we explored the variability by changing the distance within 20 km and 30 km.
Results:We observed associations between HFMD and weather factors, including temperature and relative humidity. An approximately U-shaped relationship was observed for the associations of temperature on HFMD across the same day and the previous 7 days, while an approximately exponential-shaped was seen for relative humidity. Statistically significant increases in rates of HFMD were associated with each 10-unit increases in temperature [Excess rate (ER): 7.7%; 95% Confidence Interval (CI): 3.9, 11.7%] and relative humidity (ER: 1.9%; 95% CI: 0.7, 3.0%) on lag days 0–6, when assessing within 10 km of the monitoring sites. Potential thresholds for temperature (30.0 °C) and relative humidity (70.3%) detected showed associations with HFMD. The associations remained robust for 20 km and 30 km.
Conclusions:Our study found that temperature and relative humidity are significantly associated with the increased rates of HFMD. Thresholds and lag effects were observed between weather factors and HFMD. Our findings are useful for planning on targeted prevention and control of HFMD.
Keywords:Hand, foot, and mouth disease, Case-crossover, Weather effect
Background
Hand, foot, and mouth disease (HFMD) is a pediatric infectious disease causing outbreaks worldwide [1]. At least in mainland China, HFMD was reported as the infectious disease with highest yearly incidence with a 9 year average (114.48 per 100,000) from 2004 to 2013 [2]. Although HFMD cases are often mild, severe and fatal cases among children are not rare [3]. HFMD has become a vital public health concern due to its threat to children and its huge burdens on society.
Weather factors (e.g., temperature and relative humid-ity) have been widely reported as having associations with HFMD in previous studies. Temperature was esti-mated to have a risk ratio of 1.30 (95% CI: 1.23, 1.37) at the 91st percentile compared to the 50th [4]. The com-monly hot days were found to increase HFMD burdens with a relative risk peaking at around 6 days of lag [5].
One of our preceding studies also found that
temperature (relative risk, RR: 1.039; 95% CI: 1.028, 1.050) and relative humidity (RR: 1.015; 95% CI: 1.010, 1.021) were statistically associated with HFMD incidence using a Bayesian spatiotemporal model [6].
Biases from exposure misclassification were major lim-itations in previous studies. For studies using a
time-© The Author(s). 2019Open AccessThis article is distributed under the terms of the Creative Commons Attribution 4.0 International License (http://creativecommons.org/licenses/by/4.0/), which permits unrestricted use, distribution, and reproduction in any medium, provided you give appropriate credit to the original author(s) and the source, provide a link to the Creative Commons license, and indicate if changes were made. The Creative Commons Public Domain Dedication waiver (http://creativecommons.org/publicdomain/zero/1.0/) applies to the data made available in this article, unless otherwise stated. * Correspondence:haoyt@mail.sysu.edu.cn
1Department of Medical Statistics and Epidemiology, School of Public Health,
Sun Yat-sen University, Guangzhou 510080, China
series design or other ecological designs, the mean value of weather factors from limited monitoring sites were usually assigned to all HFMD cases located throughout a large region no matter how far they lived from the monitor (e.g., a city or a province) [7–11]. Including cases farther away from monitoring sites and using the same values as those near the monitoring sites can result in an underestimation due to the bias of exposure mis-classification or exposure error [12–15]. Moreover, these studies were analyzed at the population level (i.e., eco-logical design) [16], which usually assigns the mean value of weather factors to a group of subjects rather than a single subject. In addition, these studies might miss some important confounders at individual levels such as age, gender, and race/ethnicity.
To address these biases of exposure misclassification and unobserved confounders, we conducted this case-crossover study to examine the association between short-term (within 1 week) increases in weather factors and HFMD, weather factors’ lag effects (0–7 days) and potential thresholds on HFMD, and validate the exposure-health association by evaluating difference residential distances to monitor sites (10, 20, and 30 km).
Methods
Study design
To estimate the associations between HFMD and temperature and relative humidity, we used a case-crossover design and conditional logistic regression models [17]. The fixed 28-day-window case-crossover approach was used in this study and was recently used in previous studies of environmental health [18, 19]. Each HFMD case was defined as “case” in the matched case-control study. Each HFMD case in other weeks with the same calendar month and weekday when they did not get infection served as their own controls. Therefore, each HFMD case were compared to three or four controls within the same month. And the outcome in this study was a dichotomous variable with the “case” coded as“1”and the“control”coded as“0”. This design contrasts weather factors immediately before the HFMD cases onset to the weather factors of their own controls.
Study population and HFMD cases data
Information on HFMD cases were obtained from the China Center for Disease Control and Prevention (China CDC), which we have used previously [3, 10]. HFMD has been included as a notifiable infectious disease since May 2008. Data on HFMD cases are collected in a legis-latively mandated database, covering almost all cases in China [20]. HFMD data include patient information on the laboratory testing results and severity, as well as demographic characteristics including date of birth, gender, residential address, occupation, and onset information.
Anyone who reports cases to the system must be strictly certified to ensure accuracy and completeness of data. We geocoded the residential address for all cases using the Geocoder service of Baidu Maps [21].
HFMD cases aged <18 years old with an onset date from January 1, 2009 to December 31, 2012 for residents of Guangdong were obtained. We then included all study subjects living within 10, 20, and 30 km (km) of any of the 36 weather monitoring sites in Guangdong (described below), leavingN= 100,669, 280,957, 490,497 available cases for analyses. Missing values in virus types and severity were recoded as“missing”. No missing data on other variables was observed for the HFMD cases data. This study was reviewed and approved by the Insti-tutional Review Board at the School of Public Health, Sun Yat-Sen University.
Weather data
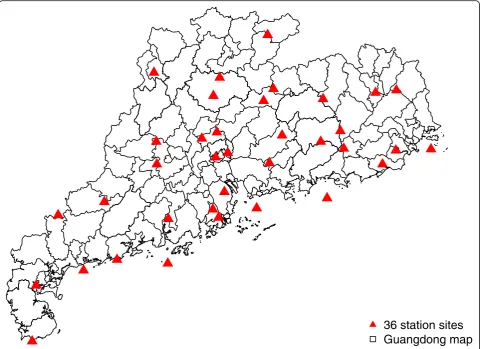
Daily temperature and relative humidity data were re-trieved from the National Meteorological Information Center (http://data.cma.cn/) for each of the 36 monitoring sites (Fig. 1) where measurements were collected (19 out of 21 cities in Guangdong): Shaoguan, Qingyuan, Heyuan, Meizhou, Zhaoqing, Guangzhou, Dongguan, Huizhou, Jieyang, Shantou, Maoming, Yunfu, Jiangmen, Zhongshan, Zhuhai, Shenzhen, Shanwei, Zhanjiang and Yangjiang. At each site, hourly temperature and relative humidity were measured using platinum resistance temperature detectors and capacitive thin-film polymer sensors, respectively. In our study, 24-h daily averages were used. We assigned the measurements of each monitoring site to the cases within 10, 20, and 30 km. Consistent with previous studies [5,7, 18,22], we calculated the mean of weather factors for the onset day (lag day 0), and previous 2 to 14 days (lag days 0–1 to 0–13) to estimate the cumulative lagged effects. Another reasoning for setting lag days is HFMD has an in-cubation period of 3–7 days [23]. No missing data was ob-served for the weather data.
Statistical analyses
Using descriptive analyses, we assessed the distribution of case characteristics (sex, age, occupation, virus, and severity) by distance away from each meteorological monitoring site (within 10, 20, and 30 km).
Conditional logistic regression model was used to esti-mate the relative risk (RR) and 95% confidence interval (CI) of HFMD associated with each 10-unit increases in temperature and relative humidity during each lag period. The conditional logistic regression model can then be specified as below:
logitð Þ ¼p βXþastratum ið Þ
weather factors (i.e., temperature or relative humidity).β is the regression coefficients, and they can be converted to RR by eβ. stratum (i)indicates each case-control pair, andαis the stratum constant.
Moreover, we calculated the excess rate (ER) using (RR-1) × 100% to make it easier to interpret and compare. Piecewise linear regression [24] was used to identify the change points (thresholds at which the association be-tween HFMD and weather factors change) in the associ-ation between HFMD and weather factors. We also conducted the subgroup analyses by sex, age, and occupa-tion to estimate the ERs among different populaoccupa-tion groups on lag days 0–6 within 10 km. R version 3.5.1 (R Foundation for Statistical Computing, Vienna, Austria; https://www.r-project.org/) was used for all data manage-ments and statistical analyses in this study.
Results
Table 1 shows case characteristics, by distance away from monitoring sites. Of the 921,499 HFMD cases
during the study period, 10.92% of cases were included within 10 km of the monitoring sites, 30.49% cases for 20 km, and 53.23% cases for 30 km. Across different dis-tances, cases were primarily male (exceed 63%), 3 years old and younger (exceed 80%), home-care children (ex-ceed 69%), and mild cases (ex(ex-ceed 99%). With the excep-tion of the missing values, the viruses of Coxsackievirus A16 (CoxA16), Enterovirus 71 (EV71), and others showed similar values of proportions. However, the proportions of different characteristics showed statistical difference among different distances due to the large sample size.
Table 2 describes the weather factors using mean and median statistics. For weather factors without lags (lag day 0), temperature (mean of 10 km: 26.7 °C vs. 26.6 °C) of case periods were slightly higher than control periods, while the relative humidity (77% vs. 77.4%) was slightly lower during case periods than control periods. For wea-ther factors with lag days 0–6, temperature had the same distribution as lag day 0, while the relative humidity was equal (77.4%) during both case and control periods. For Fig. 1Locations of 36 national meteorological monitoring sites in Guangdong. This map was downloaded from OpenStreetMap (The
[image:3.595.58.541.88.437.2]weather factors with lag days 0–13, temperature had the same level (26.6 °C) between case periods and control periods, while the relative humidity (77.6% vs. 77.3%) was slightly higher during case periods than control periods.
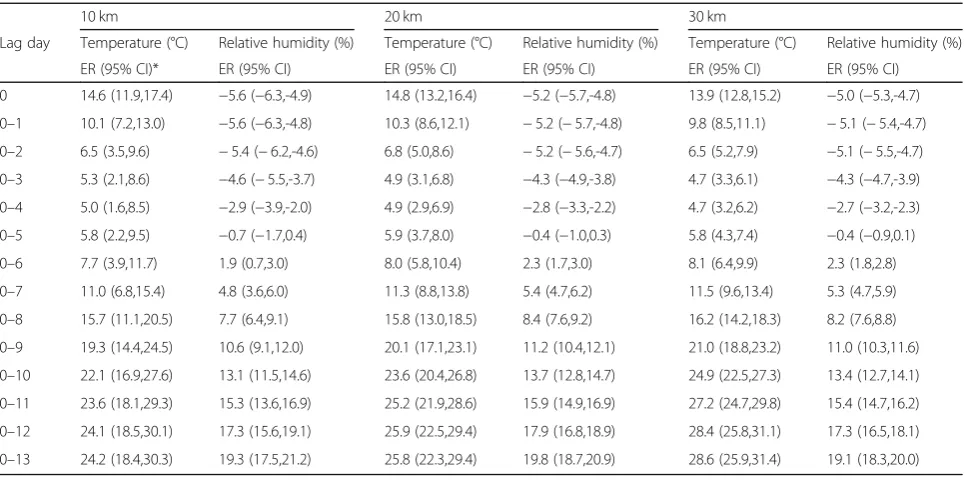
Table3 and Fig.2show the excess rates of HFMD as-sociated with each 10-unit increases in weather factors by lag days. When assessing within 10 km of the moni-toring sites, each 10-unit increases in temperature for all lag days were associated with 5.0–24.2% increased rates of HFMD. An approximately U-shaped relationship was observed for the relationship between HFMD and temperature. However, the excess rates of HFMD went up exponentially with each 10-unit increases in relative humidity across lag days, from −5.6% (lag day 0) to 19.3% (lag days 0–13). Overall, statistically positive excess rates were found since lag days 0–6 for both wea-ther factors. As seen in the sensitivity analyses, similar results were also observed for 20 km and 30 km. For the results of subgroup analyses by sex, age, and occupation (see Additional file 1: Table S1). We found that males, children younger than 1 year of age, and home-care
children were more sensitive to the effect of temperature and relative humidity. In addition, an earlier effect was observed among the serotype-specific analyses with the limited number of cases (see Additional file 1: Table S2).
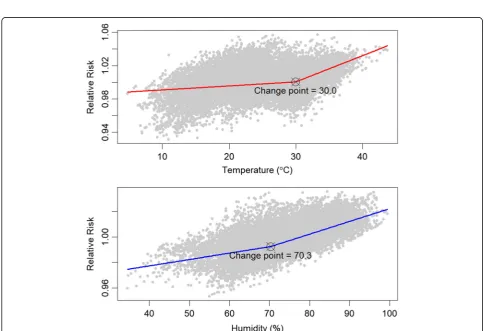
Figure 3 shows the change point of association be-tween HFMD and weather factors on lag days 0–6 within 10 km of the monitoring sites. The RR of HFMD increased with the range of temperature and relative hu-midity. The change points for temperature and relative humidity were 30.0 °C and 70.3%, respectively. Different slopes were found before and after the change points, and the later slopes were more precipitous.
Discussion
[image:4.595.58.538.99.444.2]Using a case-crossover design, the present study in-cluded 0.2–0.7 million HFMD cases determined by dis-tances away from monitoring sites through January 2009 to December 2012, accounting for 11–53% of reported cases in Guangdong. Similar demographic characteristics of cases across different distances away from monitoring sites indicated a random spatial distribution of HFMD
Table 1Cases characteristics and within different distance of the monitoring sites
Total N (%)
10 km N (%)
20 km N (%)
30 km
N (%) P
value*
Sample size 921,499 (100) 100,669 (10.92) 280,957 (30.49) 490,497 (53.23)
Sex 0.016
female 327,858 (35.58) 36,770 (36.53) 101,648 (36.18) 176,843 (36.05)
male 593,641 (64.42) 63,899 (63.47) 179,309 (63.82) 313,654 (63.95)
Age <0.001
(0, 1] 402,160 (43.64) 39,806 (39.54) 119,233 (42.44) 209,734 (42.76)
(1, 3] 362,151 (39.30) 43,096 (42.81) 115,171 (40.99) 199,021 (40.58)
(3, 5] 112,854 (12.25) 13,051 (12.96) 34,217 (12.18) 59,709 (12.17)
(5, 18] 44,334 (4.81) 4716 (4.68) 12,336 (4.39) 22,033 (4.49)
Occupation <0.001
student 27,126 (2.94) 2844 (2.83) 7616 (2.71) 13,786 (2.81)
preschool 182,051 (19.76) 27,330 (27.15) 64,607 (23.00) 111,652 (22.76)
home-care 709,310 (76.97) 70,364 (69.90) 208,133 (74.08) 363,730 (74.16)
others 3012 (0.33) 131 (0.13) 601 (0.21) 1329 (0.27)
Virus <0.001
CoxA16 6113 (0.66) 2345 (2.33) 4012 (1.43) 4806 (0.98)
EV71 8207 (0.89) 1848 (1.84) 3747 (1.33) 5353 (1.09)
others 7122 (0.77) 2843 (2.82) 4871 (1.73) 5840 (1.19)
missing 900,057 (97.67) 93,633 (93.01) 268,327 (95.50) 474,498 (96.74)
Severity <0.001
mild 916,653 (99.47) 100,213 (99.55) 279,505 (99.48) 487,676 (99.42)
severe 3737 (0.41) 364 (0.36) 1152 (0.41) 2244 (0.46)
missing 1109 (0.12) 92 (0.09) 300 (0.11) 577 (0.12)
cases, which showed the representativeness of the study population. While relative humidity was higher during control periods across different distances away from monitoring sites, temperature was higher during case pe-riods. Interquartile range increases in temperature and
[image:5.595.58.539.99.377.2]relative humidity imposed statistically significant excess rates on HFMD. Increased rates of 4.7 (95%CI: 2.4, 7.1) for temperature and 1.9 (95% CI: 0.8, 3.1) for relative hu-midity were associated with HFMD on lag days 0–6 within 10 km of the monitoring sites.
Table 2Distribution of weather factors for case periods and control periods
Lag Weather factor Distance Case Control
Mean ± SD* Median (IQR*) Mean ± SD Median (IQR)
0 Temperature (°C) 10 km 26.7 ± 5.4 27.6 (23.8,30.4) 26.6 ± 5.5 27.5 (23.7,30.3)
20 km 26.8 ± 5.6 27.7 (23.8,30.5) 26.7 ± 5.6 27.6 (23.7,30.4)
30 km 26.9 ± 5.5 27.7 (23.9,30.5) 26.8 ± 5.6 27.7 (23.7,30.5)
Relative humidity (%) 10 km 77 ± 11 78 (71,85) 77.4 ± 10.9 79 (71,85)
20 km 76.7 ± 10.9 78 (70,84) 77.1 ± 10.8 78 (71,85)
30 km 76.7 ± 10.9 78 (70,84) 77 ± 10.9 78 (71,85)
0–6 Temperature (°C) 10 km 26.7 ± 5 28 (23.9,29.9) 26.6 ± 5.1 28 (23.8,30)
20 km 26.7 ± 5.1 28 (23.8,30.1) 26.7 ± 5.2 28 (23.8,30.1)
30 km 26.8 ± 5.1 28.1 (23.9,30.1) 26.8 ± 5.1 28.1 (23.8,30.2)
Relative humidity (%) 10 km 77.4 ± 8.2 78.6 (73.1,83.3) 77.4 ± 8.3 78.6 (72.9,83.3)
20 km 77.2 ± 8.1 78.3 (72.7,83) 77 ± 8.3 78.1 (72.6,83)
30 km 77.1 ± 8.2 78.3 (72.6,83) 77 ± 8.3 78.1 (72.4,83)
0–13 Temperature (°C) 10 km 26.6 ± 4.8 28 (23.9,30) 26.6 ± 4.9 28 (23.6,30)
20 km 26.7 ± 4.9 28 (23.9,30.1) 26.7 ± 5 28 (23.6,30.2)
30 km 26.8 ± 4.9 28.1 (23.9,30.2) 26.7 ± 5 28 (23.7,30.2)
Relative humidity (%) 10 km 77.6 ± 7 78.9 (73.8,82.5) 77.3 ± 7.2 78.6 (73.3,82.4)
20 km 77.3 ± 7 78.5 (73.2,82.3) 77 ± 7.2 78.1 (72.8,82.1)
30 km 77.3 ± 7.1 78.4 (73.1,82.3) 76.9 ± 7.2 78 (72.6,82.1)
*SDStandard deviation,IQRInterquartile range
Table 3Excess rates of HFMD associated with each 10-unit increases in weather factors
10 km 20 km 30 km
Lag day Temperature (°C) Relative humidity (%) Temperature (°C) Relative humidity (%) Temperature (°C) Relative humidity (%)
ER (95% CI)* ER (95% CI) ER (95% CI) ER (95% CI) ER (95% CI) ER (95% CI)
0 14.6 (11.9,17.4) −5.6 (−6.3,-4.9) 14.8 (13.2,16.4) −5.2 (−5.7,-4.8) 13.9 (12.8,15.2) −5.0 (−5.3,-4.7)
0–1 10.1 (7.2,13.0) −5.6 (−6.3,-4.8) 10.3 (8.6,12.1) −5.2 (−5.7,-4.8) 9.8 (8.5,11.1) −5.1 (−5.4,-4.7)
0–2 6.5 (3.5,9.6) −5.4 (−6.2,-4.6) 6.8 (5.0,8.6) −5.2 (−5.6,-4.7) 6.5 (5.2,7.9) −5.1 (−5.5,-4.7)
0–3 5.3 (2.1,8.6) −4.6 (−5.5,-3.7) 4.9 (3.1,6.8) −4.3 (−4.9,-3.8) 4.7 (3.3,6.1) −4.3 (−4.7,-3.9)
0–4 5.0 (1.6,8.5) −2.9 (−3.9,-2.0) 4.9 (2.9,6.9) −2.8 (−3.3,-2.2) 4.7 (3.2,6.2) −2.7 (−3.2,-2.3)
0–5 5.8 (2.2,9.5) −0.7 (−1.7,0.4) 5.9 (3.7,8.0) −0.4 (−1.0,0.3) 5.8 (4.3,7.4) −0.4 (−0.9,0.1)
0–6 7.7 (3.9,11.7) 1.9 (0.7,3.0) 8.0 (5.8,10.4) 2.3 (1.7,3.0) 8.1 (6.4,9.9) 2.3 (1.8,2.8)
0–7 11.0 (6.8,15.4) 4.8 (3.6,6.0) 11.3 (8.8,13.8) 5.4 (4.7,6.2) 11.5 (9.6,13.4) 5.3 (4.7,5.9)
0–8 15.7 (11.1,20.5) 7.7 (6.4,9.1) 15.8 (13.0,18.5) 8.4 (7.6,9.2) 16.2 (14.2,18.3) 8.2 (7.6,8.8)
0–9 19.3 (14.4,24.5) 10.6 (9.1,12.0) 20.1 (17.1,23.1) 11.2 (10.4,12.1) 21.0 (18.8,23.2) 11.0 (10.3,11.6)
0–10 22.1 (16.9,27.6) 13.1 (11.5,14.6) 23.6 (20.4,26.8) 13.7 (12.8,14.7) 24.9 (22.5,27.3) 13.4 (12.7,14.1)
0–11 23.6 (18.1,29.3) 15.3 (13.6,16.9) 25.2 (21.9,28.6) 15.9 (14.9,16.9) 27.2 (24.7,29.8) 15.4 (14.7,16.2)
0–12 24.1 (18.5,30.1) 17.3 (15.6,19.1) 25.9 (22.5,29.4) 17.9 (16.8,18.9) 28.4 (25.8,31.1) 17.3 (16.5,18.1)
0–13 24.2 (18.4,30.3) 19.3 (17.5,21.2) 25.8 (22.3,29.4) 19.8 (18.7,20.9) 28.6 (25.9,31.4) 19.1 (18.3,20.0)
[image:5.595.57.540.486.726.2]Fig. 2Excess rates of HFMD associated with each 10-unit increases in weather factors in Guangdong
[image:6.595.55.541.87.309.2] [image:6.595.55.540.379.710.2]For the study population, the case characteristics were consistent with previous studies [3, 25]. Male children aged ≤3 years old, and cared for at home tend to have higher infection rates. For the distribution of weather factors, our study differed from the previous studies by not reporting the weather by months, years, or even the whole study period [7,26]. Our study was the first to de-scribe the weather factors by case periods and control periods using a case-crossover design.
For the effects of temperature, our study validated the results of previous studies. We found all excess rates of temperature across lag days were positive (3.0–9.6%). One of our prior studies using Bayesian spatiotemporal model also reported that temperature (RR: 1.039; 95% CI: 1.028, 1.050) was statistically associated with HFMD [6]. The study by Onozuka et al. revealed that every 1 °C in-crease in average temperature inin-creased by 11.2% for the weekly number of HFMD cases [27]. Higher temperature potentially enhances virus activity of HFMD and increases outdoor activities of children [9,28].
For the effects of relative humidity, we found excess rates of relative humidity across lag days increased from a negative association (−7.7%) to a positive association (1.9%). Similar trends were also observed in a time-series study using negative binomial regression [27] and another study which used distributed lag non-linear model [29]. Another study by Wu et al. found a negative effect of rela-tive humidity at lag 1 day and posirela-tive effects on lag 5–7 days [30]. Besides the evidence of 3–7 days of incubation period for HFMD, it may take time for an environment with higher relative humidity to culture enteroviruses and children’s outdoor activities have the potential to be mini-mized during days with higher rainfall. Therefore, the positive effect on lag days 0–6 was more biologically plausible for both temperature and relative humidity.
For the subgroup analyses, we found males, children younger than 1 year of age, and home-care children were more sensitive to the effect of temperature and relative humidity. Consistent findings were also reported by one previous study [30]. More environment exposure and lower level of immunity for this susceptible group might be the potential reasons to cause a disease.
For the threshold effects, we detected change points for temperature (30.0 °C) and relative humidity (70.3%) on HFMD. Which means more attention should be paid to temperature and relative humidity change points and strengthened early warning are an urgent need for suscep-tible population. A study by Hii et al. found higher risk of HFMD in maximum temperature above 32 °C and in rain-fall above 75 mm [9]. One of the previous studies also re-ported the threshold effects of weather factors on HFMD in China, with the temperature greater than 24.85 °C and the relative humidity between 80.59 and 82.55% [31]. Although different values were observed, both studies suggested
higher temperature and higher relative humidity impose higher risk on HFMD.
For different distances of monitoring sites, we found a slightly increased rate of HFMD with both temperature and relative humidity from 10 to 30 km. The further one was supposed to have more bias from exposure misclassification. So, our study showed that the associations would be overes-timated if the weather factors were assigned without consid-ering the distances of cases from the monitoring sites.
The present study stood out from prior studies by its strengths. First, this is the first study to estimate the weather effects on HFMD at the individual level using a case-crossover design, which can inherently control for demographic characteristics. Second, we limited the cases within a certain distance of monitoring sites to re-duce bias from exposure misclassification.
However, several limitations of this study should also be acknowledged. First, a limited number (i.e., thirty-six) of meteorological monitoring sites were available, resulting in an undercounting of the cases in our study due to further distance than 30 km. However, the distance of 30 km had included a large sample with 53.23% cases and the consist-ent findings from differconsist-ent distances (i.e., the statistically significant ERs were observed for both temperature and relative humidity since lag days 0–6) suggested that the ef-fects of weather factors on HFMD will hardly change with the distance covering more cases. Second, the validity of HFMD reporting is usually a major concern in most vector-borne disease research. However, as HFMD data is a legislatively mandated database and all reporting persons have special certification, the likelihoods of inaccuracy and under-reporting are relatively small. Third, we didn’t in-clude tropical cyclones and air pollution due to the avail-ability of the data. Further studies incorporating the multiple factors are needed. However, previous studies have suggested that the effects of air pollution on health are much lower than the effects of weather factors [32, 33]. And the relationship we observed between HFMD and the weather factors might be not substantially confounded by the air pollution. Finally, although we observed a significant association between HFMD and weather factors, the patho-genic mechanism still cannot be well understood.
Conclusions
Supplementary information
Supplementary informationaccompanies this paper athttps://doi.org/10. 1186/s12879-019-4645-4.
Additional file 1: Table S1.Excess rates of HFMD associated with each 10-unit increases in weather factors by demographics on lag days 0–6 within 10 km.Table S2.Excess rates of HFMD associated with each 10-unit increases in weather factors by serotypes and lag days within 10 km.
Abbreviations
CI:Confidence interval; ER: Excess rates; HFMD: Hand, foot, and mouth disease; IQR: Interquartile range; SD: Standard deviation
Acknowledgements
We thank the China Center for Disease Control and Prevention for providing the data of notified hand, foot, and mouth disease cases.
Authors’contributions
ZD participated in the design, performed data analysis and interpretation, and drafted the manuscript. SL, TM, WZ, ZD and SY participated in the design and results interpretation, and helped to finalize the manuscript. TD performed data analysis and interpretation. YH participated in the design and supervised the study, participated in interpretation of results, and helped to finalize the manuscript. All authors have read and approved the contents of the final version.
Funding
This work was supported by the National Natural Science Foundation of China (No. 81473064 and 81773543). The sponsor had no role in the design, data collection, data analysis, data interpretation, or writing of the report.
Availability of data and materials
All weather data we used are available as an open source and can be acquired according to the provenance listed in the“Methods”section (http://data.cma.cn/). The cases data are available from China CDC (http://www.phsciencedata.cn/Share/en/index.jsp), which were used under license and not publicly available.
Ethics approval and consent to participate
Data were collected from the official HFMD surveillance system in China and no confidential information was involved. The research study protocol was approved by the Institutional Review Board at Sun Yat-sen University School of Public Health (No. 201415).
Consent for publication Not applicable.
Competing interests
The authors declare that they have no competing interests.
Author details
1Department of Medical Statistics and Epidemiology, School of Public Health,
Sun Yat-sen University, Guangzhou 510080, China.2Department of Environmental Health Sciences, School of Public Health, University at Albany, State University of New York, Rensselaer, New York 12144, USA.3Healthcare Department, Nanshan Maternity & Child Healthcare Hospital of Shenzhen, Shenzhen 518000, China.4Chinese Center for Disease Control and Prevention, Beijing 102206, China.
Received: 16 April 2019 Accepted: 22 November 2019
References
1. WHO. Hand, Foot and Mouth Disease Information Sheet. [Cited 2018-10-13]. Available from:http://www.wpro.who.int/emerging_diseases/hfmd. information.sheet/en/.
2. Yang S, Wu J, Ding C, Cui Y, Zhou Y, Li Y, Deng M, Wang C, Xu K, Ren J, et al. Epidemiological features of and changes in incidence of infectious diseases in China in the first decade after the SARS outbreak: an observational trend study. Lancet Infect Dis. 2017;17(7):716–25.
3. Du Z, Zhang W, Zhang D, Yu S, Hao Y. Epidemiological characteristics of severe cases of hand, foot, and mouth disease in Guangdong, China. Biostatistics Epidemiol. 2018;2(1):99–114.
4. Xiao X, Gasparrini A, Huang J, Liao Q, Liu F, Yin F, Yu H, Li X. The exposure-response relationship between temperature and childhood hand, foot and mouth disease: a multicity study from mainland China. Environ Int. 2017;100:102–9. 5. Zhang W, Du Z, Zhang D, Yu S, Hao Y. Quantifying the adverse effect of
excessive heat on children: an elevated risk of hand, foot and mouth disease in hot days. Sci Total Environ. 2016;541:194–9.
6. Du Z, Lawrence WR, Zhang W, Zhang D, Yu S, Hao Y. Bayesian
spatiotemporal analysis for association of environmental factors with hand, foot, and mouth disease in Guangdong, China. Sci Rep-UK. 2018;8(1):15147. 7. Huang J, Chen S, Wu Y, Tong Y, Wang L, Zhu M, Hu S, Guan X, Wei S.
Quantifying the influence of temperature on hand, foot and mouth disease incidence in Wuhan, Central China. Sci Rep-UK. 2018;8(1):1934.
8. Zhang W, Du Z, Zhang D, Yu S, Huang Y, Hao Y. Assessing the impact of humidex on HFMD in Guangdong Province and its variability across social-economic status and age groups. Sci Rep-UK. 2016;6:18965.
9. Hii YL, Rocklöv J, Ng N. Short term effects of weather on hand, Foot and Mouth Disease. PLoS One. 2011;6(2):e16796.
10. Du Z, Xu L, Zhang W, Zhang D, Yu S, Hao Y. Predicting the hand, foot, and mouth disease incidence using search engine query data and climate variables: an ecological study in Guangdong, China. BMJ Open. 2017;7:e16263. 11. Liao J, Yu S, Yang F, Yang M, Hu Y, Zhang J. Short-term effects of climatic
variables on hand, foot, and mouth disease in mainland China, 2008–2013: a multilevel spatial Poisson regression model accounting for Overdispersion. PLoS One. 2016;11(1):e147054.
12. Zhang W, Lin S, Hopke PK, Thurston SW, van Wijngaarden E, Croft D, Squizzato S, Masiol M, Rich DQ. Triggering of cardiovascular hospital admissions by fine particle concentrations in New York state: before, during, and after implementation of multiple environmental policies and a recession. Environ Pollut. 2018;242:1404–16.
13. Bateson TF, Coull BA, Hubbell B, Ito K, Jerrett M, Lumley T, Thomas D, Vedal S, Ross M. Panel discussion review: session three - issues involved in interpretation of epidemiologic analyses - statistical modeling. J Expo Sci Env Epid. 2007;17:S90–6.
14. Zeger SL, Thomas D, Dominici F, Samet JM, Schwartz J, Dockery D, Cohen A. Exposure measurement error in time-series studies of air pollution: concepts and consequences. Environ Health Perspect. 2000;108(5):419–26. 15. Evans KA, Hopke PK, Utell MJ, Kane C, Thurston SW, Ling FS, Chalupa D,
Rich DQ. Triggering of ST-elevation myocardial infarction by ambient wood smoke and other particulate and gaseous pollutants. J Expo Sci Env Epid. 2016;27:198–206.
16. Levin KA. Study design VI - ecological studies. Evid Based Dent. 2006;7(4):108. 17. Levy D, Lumley T, Sheppard L, Kaufman J, Checkoway H. Referent selection
in case-crossover analyses of acute health effects of air pollution. Epidemiology. 2001;12(2):186–92.
18. Rich DQ, Utell MJ, Croft DP, Thurston SW, Thevenet-Morrison K, Evans KA, Ling FS, Tian Y, Hopke PK. Daily land use regression estimated woodsmoke and traffic pollution concentrations and the triggering of ST-elevation myocardial infarction: a case-crossover study. Air Qual Atmos Health. 2018; 11(2):239–44.
19. Shah ASV, Lee KK, McAllister DA, Hunter A, Nair H, Whiteley W, Langrish JP, Newby DE, Mills NL. Short term exposure to air pollution and stroke: systematic review and meta-analysis. BMJ. 2015;350:h1295.
20. Xing W, Liao Q, Viboud C, Zhang J, Sun J, Wu JT, Chang Z, Liu F, Fang VJ, Zheng Y, et al. Hand, foot, and mouth disease in China, 2008-12: an epidemiological study. Lancet Infect Dis. 2014;14(4):308–18. 21. Wikipedia. Baidu Maps. [Cited 2018-10-09]. Available from:https://en.
wikipedia.org/wiki/Baidu_Maps#Coordinate_system.
22. Chen C, Lin H, Li X, Lang L, Xiao X, Ding P, He P, Zhang Y, Wang M, Liu Q. Short-term effects of meteorological factors on children hand, foot and mouth disease in Guangzhou, China. Int J Biometeorol. 2014;58(7):1605–14. 23. Yang Z, Zhang Q, Cowling BJ, Lau EHY. Estimating the incubation period of hand, foot and mouth disease for children in different age groups. Sci Rep-UK. 2017;7(1):16464.
24. Toms JD, Lesperance ML. Piecewise regression: a tool for identifying ecological thresholds. Ecology. 2003;84(8):2034–41.
26. Wang P, Goggins WB, Chan EYY. Hand, foot and mouth disease in Hong Kong: a time-series analysis on its relationship with weather. PLoS One. 2016;11(8):e161006.
27. Onozuka D, Hashizume M. The influence of temperature and humidity on the incidence of hand, foot, and mouth disease in Japan. Sci Total Environ. 2011;410-411:119–25.
28. Zhu L, Yuan Z, Wang X, Li J, Wang L, Liu Y, Xue F, Liu Y. The impact of ambient temperature on childhood HFMD incidence in inland and coastal area: a Two-City study in Shandong Province, China. Int J Env Res Pub He. 2015;12(8):8691–704.
29. Yang H, Wu J, Cheng J, Wang X, Wen L, Li K, Su H. Is high relative humidity associated with childhood hand, foot, and mouth disease in rural and urban areas? Public Health. 2017;142:201–7.
30. Wu H, Wang H, Wang Q, Xin Q, Lin H. The effect of meteorological factors on adolescent hand, foot, and mouth disease and associated effect modifiers. Glob Health Action. 2014;7:24664.
31. Du Z, Zhang W, Zhang D, Yu S, Hao Y. The threshold effects of
meteorological factors on hand, foot, and mouth disease (HFMD) in China, 2011. Sci Rep. 2016;6:36351.
32. Chen R, Yin P, Wang L, Liu C, Niu Y, Wang W, Jiang Y, Liu Y, Liu J, Qi J, et al. Association between ambient temperature and mortality risk and burden: time series study in 272 main Chinese cities. BMJ. 2018;363:k4306. 33. Xie H, Yao Z, Zhang Y, Xu Y, Xu X, Liu T, Lin H, Lao X, Rutherford S, Chu C,
et al. Short-term effects of the 2008 cold spell on mortality in three subtropical cities in Guangdong Province, China. Environ Health Perspect. 2013;121(2):210–6.
Publisher’s Note