R E S E A R C H
Open Access
Development and internal validation of the
multivariable CIPHER (Collaborative
Integrated Pregnancy High-dependency
Estimate of Risk) clinical risk prediction
model
Beth A. Payne
1,2,3*, Helen Ryan
1,3,4, Jeffrey Bone
1,3, Laura A. Magee
1,3,5,6, Alice B. Aarvold
5, J. Mark Ansermino
2,3,
Zulfiqar A. Bhutta
7,8, Mary Bowen
9, J. Guilherme Cecatti
10, Cynthia Chazotte
11,12, Tim Crozier
13,
Anne-Cornélie J. M. de Pont
14, Oktay Demirkiran
15, Tao Duan
16, Marlot Kallen
14, Wessel Ganzevoort
14, Michael Geary
9,
Dena Goffman
11,12, Jennifer A. Hutcheon
1,3, K. S. Joseph
1,3, Stephen E. Lapinsky
17, Isam Lataifeh
18, Jing Li
1,3,
Sarka Liskonova
1,3, Emily M. Hamel
1, Fionnuala M. McAuliffe
19, Colm O
’
Herlihy
19, Ben W. J. Mol
14,20,
P. Gareth R. Seaward
17, Ramzy Tadros
18, Turkan Togal
15, Rahat Qureshi
7, U. Vivian Ukah
1,3, Daniela Vasquez
21,
Euan Wallace
13, Paul Yong
1,3, Vivian Zhou
15, Keith R. Walley
5,22, Peter von Dadelszen
1,3,6and the CIPHER Group
Abstract
Background:Intensive care unit (ICU) outcome prediction models, such as Acute Physiology And Chronic Health Evaluation (APACHE), were designed in general critical care populations and their use in obstetric populations is contentious. The aim of the CIPHER (Collaborative Integrated Pregnancy High-dependency Estimate of Risk) study was to develop and internally validate a multivariable prognostic model calibrated specifically for pregnant or recently delivered women admitted for critical care.
Methods:A retrospective observational cohort was created for this study from 13 tertiary facilities across five high-income and six low- or middle-high-income countries. Women admitted to an ICU for more than 24 h during pregnancy or less than 6 weeks post-partum from 2000 to 2012 were included in the cohort. A composite primary outcome was defined as maternal death or need for organ support for more than 7 days or acute life-saving intervention. Model development involved selection of candidate predictor variables based on prior evidence of effect,
availability across study sites, and use of LASSO (Least Absolute Shrinkage and Selection Operator) model building after multiple imputation using chained equations to address missing data for variable selection. The final model was estimated using multivariable logistic regression. Internal validation was completed using bootstrapping to correct for optimism in model performance measures of discrimination and calibration.
(Continued on next page)
* Correspondence:[email protected] 1
Department of Obstetrics and Gynaecology, University of British Columbia, 2329 West Mall, Vancouver V6T 1Z4, BC, Canada
2Department of Anesthesiology, Pharmacology and Therapeutics, University of British Columbia, 2329 West Mall, Vancouver V6T 1Z4, BC, Canada Full list of author information is available at the end of the article
(Continued from previous page)
Results:Overall, 127 out of 769 (16.5%) women experienced an adverse outcome. Predictors included in the final CIPHER model were maternal age, surgery in the preceding 24 h, systolic blood pressure, Glasgow Coma Scale score, serum sodium, serum potassium, activated partial thromboplastin time, arterial blood gas (ABG) pH, serum creatinine, and serum bilirubin. After internal validation, the model maintained excellent discrimination (area under the curve of the receiver operating characteristic (AUROC) 0.82, 95% confidence interval (CI) 0.81 to 0.84) and good
calibration (slope of 0.92, 95% CI 0.91 to 0.92 and intercept of−0.11, 95% CI−0.13 to−0.08).
Conclusions:The CIPHER model has the potential to be a pragmatic risk prediction tool. CIPHER can identify critically ill pregnant women at highest risk for adverse outcomes, inform counseling of patients about risk, and facilitate bench-marking of outcomes between centers by adjusting for baseline risk.
Keywords:Risk prediction model, High-risk pregnancy, Maternal mortality, Maternal morbidity, Critical care
Background
Most women who die during or soon after pregnancy in a health facility do so in an intensive care unit (ICU), if one is available [1–3]. Maternal ICU admissions result from both obstetric and non-obstetric complications in pregnancy; about two thirds of admissions are due to obstetric causes, such as hemorrhage, pre-eclampsia, and sepsis, and one third are due to maternal medical or surgical complications [1–3].
ICU clinical prediction models—including Acute Physi-ology And Chronic Health Evaluation II (APACHE II), APACHE III, Multiple Organ Dysfunction Score (MODS), Simplified Acute Physiology Score 3 (SAPS 3), and Sepsis-related Organ Failure Assessment (SOFA)—were developed in general ICU populations to assess the likeli-hood of an adverse health outcome (such as death or se-vere morbidity) and guide counseling and clinical decision making [4–8]. However, most ICU outcome prediction models were designed in general critical care populations in high-income countries (HICs) and their use in obstetric populations and in low- and middle-income countries (LMICs) is contentious. These general ICU prediction rules tend to overestimate the risk of maternal death by up to 20-fold [1]. The two exceptions to this are the SOFA score for sepsis risk and the Maternal Severity Index rule [9,10]. None of the obstetric-focused ICU risk models has been developed to predict maternal death or prolonged organ support, an outcome reflective of severe maternal morbidity and of greater relevance in maternity popula-tions among whom death is unusual, even in the ICU.
Maternal Early Warning scores are being adopted in obstetric care in many settings across the globe. These scores have resulted in mixed results when validated [11] and are relevant only for care prior to ICU admis-sion. Given the unique physiology during pregnancy and post-partum, new pregnancy-specific clinical prediction rules, specific to the ICU setting, are required [12, 13]. Our objective was to develop and internally validate the globally relevant CIPHER (Collaborative Integrated Pregnancy High-dependency Estimate of Risk) model to
predict either death or severe morbidity for pregnant and post-partum women admitted for critical care.
Methods
Study setting
Thirteen collaborating sites with ICUs from 11 countries contributed data to the CIPHER cohort. These sites were identified through a literature review of published ob-stetric ICU cohorts. After initial contact to establish whether the investigators were interested in collaborat-ing, they were sent a survey to ensure suitability of the facility for participation in the CIPHER cohort. This sur-vey evaluated human resources, interventions, and infra-structure available at each ICU site to ensure that sites were similar with regard to type of care provided. The HICs were in Canada, the US, Ireland, the Netherlands, and Australia. The LMIC sites were in Brazil, Argentina, Jordan, Turkey, Pakistan, and China. (For details, please see Additional file1: Table S1.)
Inclusion and exclusion criteria
Women were included if they were admitted to a critical care unit for more than 24 h and were known to be ei-ther pregnant (diagnosed before or during their ICU stay) or no more than 42 days post-partum, irrespective of pregnancy duration, from 1 January 2000 to 31 De-cember 2012. Women admitted for less than 24 h who were neither pregnant nor recently pregnant were ex-cluded, as were women with 10 or more missing candi-date predictor variables or those who were missing primary outcome information or who met the definition of the primary outcome prior to admission.
Data collection
questions arose regarding data reliability, these data were confirmed by re-review of the primary health record.
Primary outcome
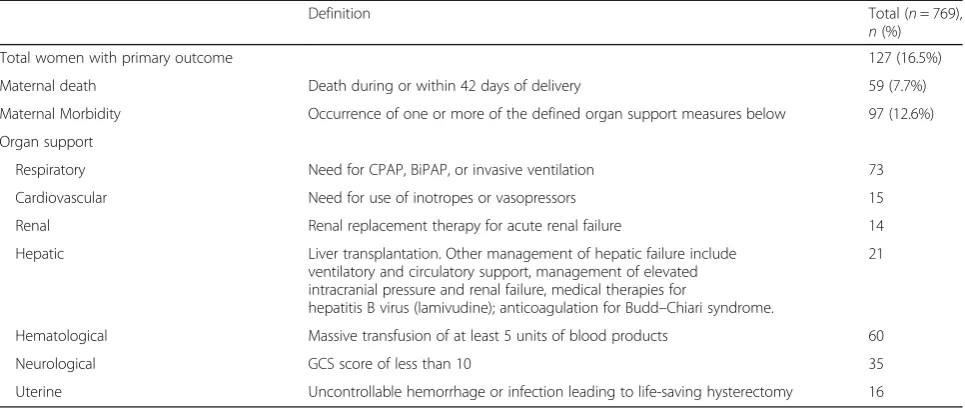
The composite primary outcome was defined as any one of (i) maternal death during pregnancy or within 42 days of delivery or (ii) organ support for more than 7 days or (iii) life-saving intervention or a combination of these. Organ support and life-saving interventions included in this composite were defined by organ system and are used as a surrogate for severe maternal morbidity. Spe-cifically, organ support outcomes include any one or more of (1) respiratory (continuous positive airway pres-sure (CPAP), bilevel positive airway prespres-sure (BiPAP), or invasive ventilation); (2) cardiac (positive inotrope or vasopressor use); (3) continuous renal replacement ther-apy for acute renal failure; (4) hepatic (liver transplant-ation and other management of hepatic failure (for example, ventilatory and circulatory support), manage-ment of elevated intracranial pressure and renal failure, and medical therapies for hepatitis B virus (for example, lamivudine)), and anticoagulation for Budd–Chiari syn-drome); (5) hematologic (transfusion of at least 5 units of blood products); (6) neurological (Glasgow Coma Scale score of less than 10); or (7) uterine (uncontrol-lable hemorrhage or infection leading to hysterectomy). These definitions were arrived at through study working group consensus and are based on definitions of organ support used in the APACHE studies [5] and the World Health Organization (WHO) near-miss approach [10].
Sample size
This sample size estimate is based on a rule of thumb for developing risk prediction models with unbiased esti-mates of regression coefficients [14]. The formula—[N = (n × 10) / I]—was used to calculate the sample size where N = the required sample size, n = the number of variables to be tested, and I = the incidence of the com-bined adverse outcome [14]. We assumed, on the basis of published reports,I= 12% for either maternal mortal-ity or prolonged organ support for obstetric women ad-mitted for critical care [15]. We estimated that to develop a reliable model with minimal overfitting withn = 10 candidate predictor variables at an assumed event rate of 12%, a cohort ofN= 833 women was required.
Model development
Dealing with missing data
Multiple imputation using chained eqs [16, 17] was undertaken to estimate missing data over 10 iterations to generate 10 complete datasets for model develop-ment. Two analysts replicated this process. We assumed that data were missing at random [17]. Women with and without missing data were compared to identify all
clinical, laboratory, and demographic variables that dif-fered between the groups. These variables were included in the imputation models along with all selected candi-date predictor variables and the primary outcome [18].
Selection of candidate predictor variables
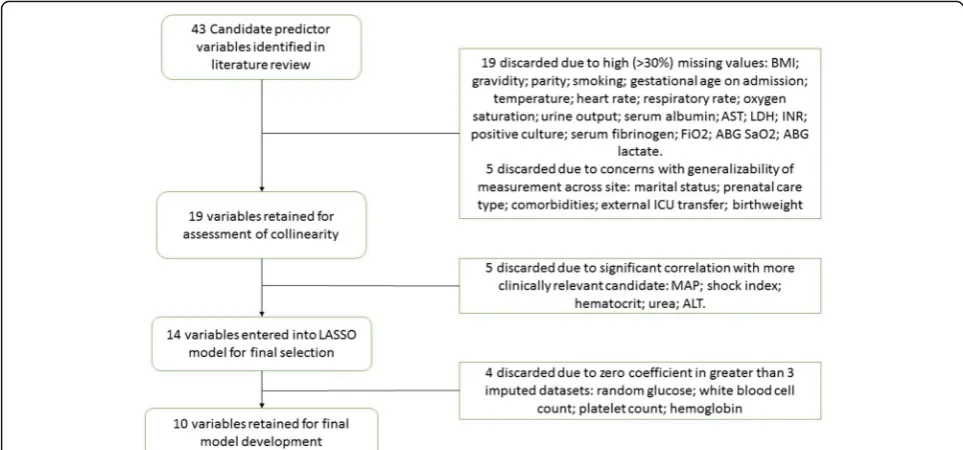
Initially, we performed a structured literature review of existing critical care outcome prediction models and their evidence for use in pregnancy to identify candidate pre-dictor variables [1]. This review has been published else-where [1]. Variables considered for the CIPHER model included patient demographic details, prior health status, indication for ICU admission, and clinical and laboratory measurements taken in the first 24 h following ICU ad-mission. The literature review identified 43 possible vari-ables to include in the modelling process. This list was refined and reduced to 19 after exclusion of variables that were not routinely available at all sites (defined as having more than 30% missing values in the dataset) and through iterative dialogue with the participating critical care, maternal-fetal-medicine, and epidemiology experts in the CIPHER team to identify concerns about generalizability of measurements and clinical policy relevant to each vari-able across study settings.
As a final step, Pearson’s correlation coefficient (for continuous predictors) or chi-squared test (for categor-ical variables) was used to estimate any correlation be-tween candidate predictors within each imputed dataset. Consultation within the study working group was used when collinearity was suspected to select which variable to retain on the basis of perceived clinical value, reliabil-ity of measurement, and availabilreliabil-ity. The 14 most clinic-ally relevant, available, and non-correlated variables were then included in the final variable selection step (Fig.1).
LASSO models were built using the glmnet package in R [20]. This variable selection technique was repeated within each imputed dataset, resulting in 10 models. A
priori, we set thresholds for inclusion in the final CIPHER model as any variable which retained a non-zero coefficient in the LASSO model in seven or more imputations. Variables that maintained a non-zero coefficient in fewer than seven of the LASSO models would not be retained for final parameter estimation.
Estimating parameter effects
Multivariable logistic regression was used to estimate variable effects of selected predictors in each of the 10 imputed datasets. A final pooled estimate of effect was then generated using Rubin’s rules implemented in STATA through the mi estimate command [21].
Assessing the model’s performance
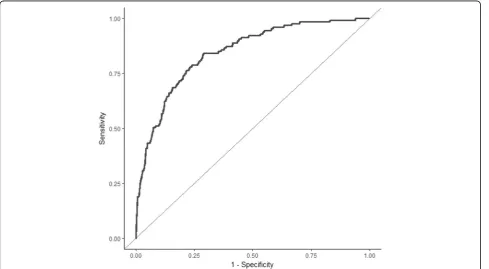
The discrimination ability of the final model was evaluated on the basis of AUROC [22]. Discrimination in this con-text refers to the ability of the model to distinguish be-tween women with and without outcomes. An AUROC of more than 0.7 indicates good model discrimination.
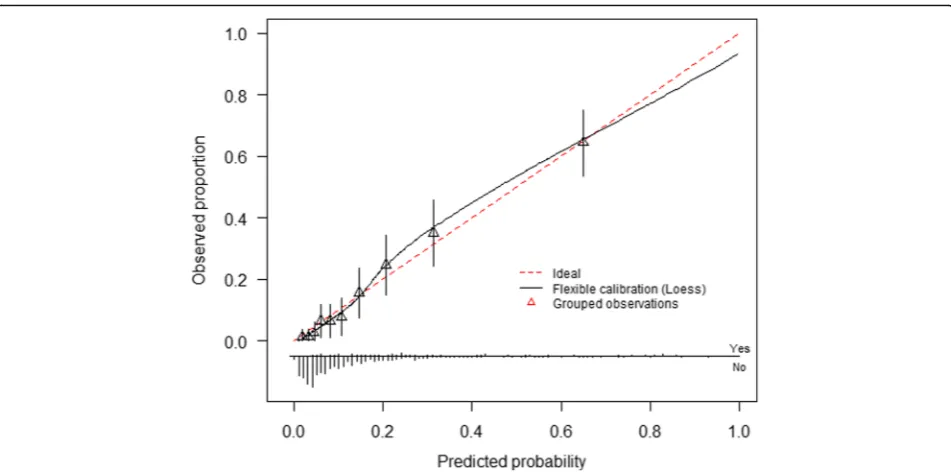
Model calibration was assessed by plotting deciles of the predicted probability of an adverse maternal out-come against the observed rate in each decile and fitting a smooth line using locally weighted scatterplot smooth-ing (lowess) ussmooth-ing the “rms” and “calibrationcurves”
packages in R [23,24]. This smooth line is used to deter-mine the calibration slope and intercept [25]. These cali-bration measures are used to describe the accuracy of the predicted probability compared with the observed outcome and are considered measures of model goodness-of-fit. Ideally, the slope would be close to one and intercept zero. Discrimination and calibration mea-sures were estimated for each of the imputed datasets and then pooled using Rubin’s rules. Graphs presented are drawn using the pooled linear predictor value for each woman in the dataset.
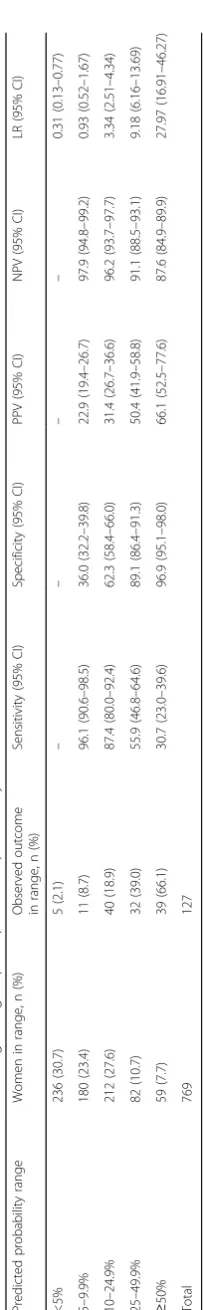
A risk stratification table was used to evaluate model classification accuracy and stratification capacity. Both classification accuracy, defined as the ability of the model to separate cases with an outcome into higher-risk groups and cases without an outcome into lower-risk groups, and stratification capacity, defined as the ability of the model to separate the population into distinct risk groups, give additional information on model calibration. A useful model will separate the population into distinct risk groups so that the majority of outcome cases result in a high predicted probability and the remaining cases have a visibly lower predicted probability, leaving few in the middle.
Categories within the stratification table were defined to be balanced around the population prevalence. By balancing around the population prevalence, we defined risk groups that have the potential to be meaningfully Fig. 1The process of selection of predictor variables for inclusion in the CIPHER (Collaborative Integrated Pregnancy High-dependency Estimate of Risk) model. Abbreviations:ABGarterial blood gas,ALTalanine aminotransferase,ASTaspartate aminotransferase,BMIbody mass index,FiO2 fraction of inspired oxygen,ICUintensive care unit,INRinternational normalized ratio,LASSOLeast Absolute Shrinkage and Selection Operator,
[image:4.595.56.538.88.313.2]different than the prevalence itself, which represents the total population risk. Specifically, the lowest and highest groups were set at predictive probability about three times greater and less than the prevalence. We calcu-lated the sensitivity, specificity, positive predictive value, negative predictive value, and likelihood ratios (LRs) for each risk group. A positive test was defined using the upper limit of the predicted probability range for each risk group, except for calculation of the LRs, which followed the method of Deeks and Altman [26]. These measures of diagnostic accuracy are used in this study to describe potential accuracy of the model if it were imple-mented as a decision rule using the defined risk groups. The following categories for interpretation of the LRs were used: strongly informative (LR <0.1 or >10),
moder-ately informative (LR 0.1–0.2 or 5–10), and
non-informative (LR 0.2–5). Uniformity of the model fit was tested by assessing model performance in various subsets of study data, including HIC versus LMIC, ante-natal versus post-partum admission, and in cases with obstetric versus other indication for admission.
Model internal validation and optimism correction
Internal validation of the model was assessed in each of the 10 imputed datasets using Efron’s enhanced bootstrap method [27]. Details of this approach have been described previously [28, 29]. Model optimism was calculated for discrimination (AUROC) as the average difference between model performance in the bootstrap sample and the original imputed dataset after 200 iterations of the bootstrap procedure. This resulted in 10 estimates of average optimism, which were pooled using Rubin’s rules to generate a final optimism result.
In addition, internal validation of the calibration slope and intercept was completed during the bootstrapping procedure using the same method as above. For these measures of model fit, we calculated the average slope and intercept for each bootstrap model applied to its original imputed dataset over 200 iterations. This re-sulted in 10 average slopes and intercepts that were then pooled using Rubin’s rules to generate final internally validated measures of model calibration.
All analyses were initially performed in R using the
“mice”, “rms”, “calibrationcurves”, and “glmnet” pack-ages. Pooling of parameter estimates and model per-formance estimates were repeated by a second analyst to confirm results using STATA version 13.0.
Results
At the 13 study sites, retrospective chart review was completed for 876 eligible women who met inclusion criteria. We excluded 107 women; 93 of these were ex-cluded because they were missing at least 10 out of 19
candidate predictor variables included in the imputation step and 14 because they were missing outcome data. A final cohort of 769 women was identified for analysis.
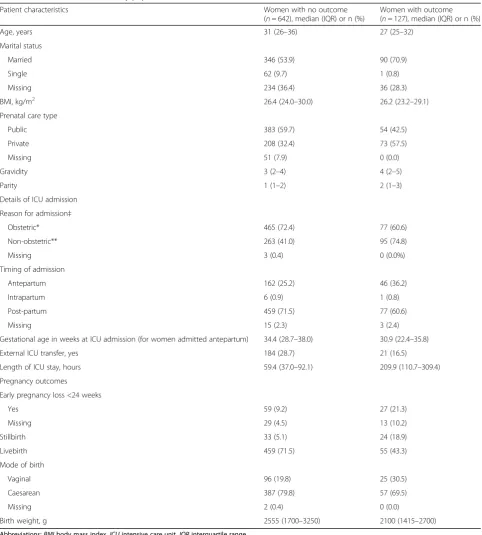
Characteristics of the study population are presented in Table1, comparing women with and without the primary adverse outcome of death or morbidity, as previously de-fined. Women with the primary adverse outcome were younger and more often accessed care through private fa-cilities, were admitted for non-obstetric reasons, were ad-mitted to the ICU earlier in gestation and for longer, and had a greater number of early pregnancy losses and still-births. The primary outcome was observed in 127 (16.5%) women. Of these, 59 (7.7%) were maternal deaths and 68 (8.8%) required one or more component of organ support alone. The most common organ support outcome was the need for respiratory support (Table2).
Imputation
A comparison of women with and without missing data shows that women with missing data were less severely ill and had shorter duration of ICU stay (Additional file 1: Table S3). Imputation models specified for this study included all variables that differed between women with or without one or more missing selected predictor variable to best account for these differences. Univariate odds ratios estimated for all candidate predictor vari-ables in both the imputed data (Table 3) and complete case cohorts (Additional file 1: Table S2) were similar, and an expected increase in precision was seen in the es-timates generated using the imputed data.
Model development
The final variables selected for inclusion in the CIPHER model were maternal age, surgical status in the preceding 24 h, systolic blood pressure, Glasgow Coma Scale score,
serum sodium, serum potassium, activated partial
thromboplastin time (aPTT), serum creatinine, and serum bilirubin, and arterial blood gas (ABG) pH (Table4). The odds of experiencing an adverse outcome increase as serum creatinine, total bilirubin, serum sodium, and aPTT increase; decrease as maternal age and systolic blood pres-sure decrease; and decrease if ABG pH and Glasgow Coma Scale score increase or if there was surgery in the 24 h preceding ICU admission (Table3).
Model performance
The apparent AUROC for the CIPHER model was 0.84 (0.83 to 0.85) (Fig.2). This model was well calibrated in the development data, as would be expected, with a cali-bration slope of 1.0 and intercept of −0.001 (Fig. 3). Stratification capacity and classification accuracy of the model as presented in Table5 were both good; the ma-jority of women identified in the two lowest risk groups
outcome (3.8%, n= 16). Women in the highest-risk group had a high incidence of adverse maternal outcome (66.1%, n= 59). This is meaningfully greater than the
[image:6.595.57.540.96.632.2]population prevalence of adverse outcome (16.5%), as is reflected by the high LR associated with this category (27.97, 95% confidence interval (CI) 16.91 to 46.27).
Table 1Characteristics of the study population
Patient characteristics Women with no outcome
(n= 642), median (IQR) or n (%)
Women with outcome (n= 127), median (IQR) or n (%)
Age, years 31 (26–36) 27 (25–32)
Marital status
Married 346 (53.9) 90 (70.9)
Single 62 (9.7) 1 (0.8)
Missing 234 (36.4) 36 (28.3)
BMI, kg/m2 26.4 (24.0–30.0) 26.2 (23.2–29.1)
Prenatal care type
Public 383 (59.7) 54 (42.5)
Private 208 (32.4) 73 (57.5)
Missing 51 (7.9) 0 (0.0)
Gravidity 3 (2–4) 4 (2–5)
Parity 1 (1–2) 2 (1–3)
Details of ICU admission
Reason for admission‡
Obstetric* 465 (72.4) 77 (60.6)
Non-obstetric** 263 (41.0) 95 (74.8)
Missing 3 (0.4) 0 (0.0%)
Timing of admission
Antepartum 162 (25.2) 46 (36.2)
Intrapartum 6 (0.9) 1 (0.8)
Post-partum 459 (71.5) 77 (60.6)
Missing 15 (2.3) 3 (2.4)
Gestational age in weeks at ICU admission (for women admitted antepartum) 34.4 (28.7–38.0) 30.9 (22.4–35.8)
External ICU transfer, yes 184 (28.7) 21 (16.5)
Length of ICU stay, hours 59.4 (37.0–92.1) 209.9 (110.7–309.4)
Pregnancy outcomes
Early pregnancy loss <24 weeks
Yes 59 (9.2) 27 (21.3)
Missing 29 (4.5) 13 (10.2)
Stillbirth 33 (5.1) 24 (18.9)
Livebirth 459 (71.5) 55 (43.3)
Mode of birth
Vaginal 96 (19.8) 25 (30.5)
Caesarean 387 (79.8) 57 (69.5)
Missing 2 (0.4) 0 (0.0)
Birth weight, g 2555 (1700–3250) 2100 (1415–2700)
Abbreviations:BMIbody mass index,ICUintensive care unit,IQRinterquartile range
*Obstetric reasons for admission included shock, massive postpartum hemorrhage, peripartum cardiomyopathy, amniotic fluid embolism, acute respiratory distress secondary to antepartum hemorrhage, pulmonary edema secondary to pre-eclampsia, eclampsia, septic abortion, other septic complications, and surgical trauma. **Non-obstetric reasons for admission included cardiac arrhythmia, pericardial effusions, cardiogenic pulmonary edema, pulmonary hypertension, cardiac arrest, pneumonia, respiratory failure or arrest, gastrointestinal perforation/obstruction, diabetic keto-acidosis, deep venous thrombosis, thrombotic thrombocytopenic purpura, posterior reversible encephalopathy syndrome, and severe infection with sepsis
Internal validation
After 200 iterations of bootstrapping in each of the 10 imputed datasets, the pooled average optimism for
the AUROC was 0.013, which results in an
optimism-corrected AUROC for the CIPHER model of 0.82 (95% CI 0.81 to 0.84). Minimal overestimation of risk was identified after bootstrap analysis with a resultant optimism-corrected calibration slope of 0.92 (95% CI 0.91 to 0.92) and intercept of −0.11 (95% CI −0.13 to −0.08).
Subgroup analysis
All subgroup analyses demonstrated uniformity of
model fit with maintenance of discriminative
[image:7.595.57.540.99.304.2]performance of the CIPHER model above our defined threshold for adequate performance of AUROC of more than 0.7. When the cohort was restricted to only those cases admitted to the ICU during the antenatal/intrapartum period, versus the post-partum period, the AUROCs were estimated as 0.84 (95% CI 0.78 to 0.91) and 0.83 (95% CI 0.79 to 0.89), respect-ively. When the cohort was restricted to only those cases admitted for obstetric causes versus those with non-obstetric causes, the AUROCs were 0.85 (95% CI 0.80 to 0.90) and 0.82 (95% CI 0.76 to 0.88), respect-ively. When the cohort was restricted to either LMIC facilities or HIC facilities, the AUROCs were esti-mated to be 0.851 (95% CI 0.812 to 0.894) versus
Table 3Univariate and multivariable odds ratios for selected candidate predictor variables pooled from 10 imputed datasets
Patient characteristics multivariate analysis Univariate OR (95% CI) Multivariate OR (95% CI)
Maternal age, years 0.95 (0.92–0.98) 0.95 (0.92–0.99)
Surgery in preceding 24 h, yes 0.47 (0.32–0.70) 0.46 (0.29–0.73)
Highest systolic blood pressure, mm Hg 0.99 (0.98–1.02) 0.99 (0.98–1.00)
Lowest Glasgow Coma Scale score 0.85 (0.82–0.89) 0.87 (0.83–0.91)
Lowest ABG pH 0.60 (0.28–1.29) 0.57 (0.22–1.44)
Highest aPTT 1.02 (1.02–1.03) 1.02 (1.01–1.03)
Highest serum potassium 0.90 (0.72–1.12) 0.73 (0.56–0.94)
Highest serum sodium 1.07 (1.04–1.10) 1.03 (1.00–1.08)
Highest creatinine, per 10 unit change 1.05 (1.03–1.07) 1.04 (1.03–1.07)
Highest bilirubin, per 10 unit change 1.10 (1.07–1.14) 1.05 (1.01–1.09)
[image:7.595.56.540.569.724.2]Abbreviations:ABGarterial blood gas,aPTTactivated partial thromboplastin time,CIconfidence interval,ORodds ratio
Table 2Incidence and definition of each of the components of the primary outcome
Definition Total (n= 769),
n(%)
Total women with primary outcome 127 (16.5%)
Maternal death Death during or within 42 days of delivery 59 (7.7%)
Maternal Morbidity Occurrence of one or more of the defined organ support measures below 97 (12.6%)
Organ support
Respiratory Need for CPAP, BiPAP, or invasive ventilation 73
Cardiovascular Need for use of inotropes or vasopressors 15
Renal Renal replacement therapy for acute renal failure 14
Hepatic Liver transplantation. Other management of hepatic failure include ventilatory and circulatory support, management of elevated intracranial pressure and renal failure, medical therapies for
hepatitis B virus (lamivudine); anticoagulation for Budd–Chiari syndrome.
21
Hematological Massive transfusion of at least 5 units of blood products 60
Neurological GCS score of less than 10 35
Uterine Uncontrollable hemorrhage or infection leading to life-saving hysterectomy 16
Abbreviations:BiPAPbilevel positive airway pressure,CPAPcontinuous positive airway pressure,GCSGlasgow Coma Scale
Maternal morbidities presented are not mutually exclusive and include those occurring in women who died. Morbidities have been grouped by organ system. All organ system outcomes required use of life-saving treatment for more than 7 days to meet outcome criteria with the exception of hematological and
0.774 (95% CI 0.663 to 0.868), respectively. There was a small but meaningful decrease in the point estimate of AUROC when the analysis was restricted to only HIC cases and the lower limit of the confidence interval falls below the 0.7 threshold for a good model.
When the CIPHER model was used to predict mater-nal death alone, the AUROC was 0.87 (95% CI 0.86 to 0.88). The discriminative performance of the APACHE 2 score for death during pregnancy or less than 6 weeks post-partum in our ICU cohort was also high (AUROC 0.84, 95% CI 0.72 to 0.96). This analysis included only 433 women who had complete data on all 17 APACHE 2 predictor variables.
Discussion
Main findings
We have developed and internally validated the CI-PHER clinical risk prediction model to accurately as-sess risk of either death or the need for life-saving prolonged organ support for pregnant or recently pregnant women admitted to an ICU at 13 inter-national sites. The final CIPHER model includes pre-dictor variables that are readily available globally and at relatively low cost. It is a simple model, including only 10 predictors. After internal validation, CIPHER affords high discrimination (0.82, 95% CI 0.81 to 0.84) and good calibration (slope of 0.92, 95% CI 0.91
to 0.92 and intercept of −0.11, 95% CI −0.13 to
−0.08). External validation of the model is now re-quired prior to implementation of the model in clin-ical practice.
Strengths and limitations
[image:8.595.57.291.108.197.2]We have built on the previously successful work of this collaborative team and developed the model on the basis of clinical knowledge and a priori information about relevant and globally available predictor variables. For this study, we chose to use a composite outcome that re-flects the important health burden of severe maternal morbidities and goes beyond the traditional focus of
Table 4Final CIPHER (Collaborative Integrated Pregnancy High-dependency Estimate of Risk) model
Logit(p) = 3.087 + [−1.912 × 10⁻⁵(maternal age)3] + [−0.776(positive surgical status within 24 h of admission)] + [−0.138 (Glasgow Coma Scale score)] + [−7.123 × 10⁻³(systolic blood pressure)] + [−0.319 (serum potassium)] + [1.373 × 10⁻⁴(serum sodium)2] + [4.934 × 10⁻³(serum bilirubin)] + [4.673 × 10⁻³(serum creatinine)] + [1.584 × 10⁻²(activated partial thromboplastin time)] + [−0.570 (arterial blood gas pH)] Maternal age (years); surgical status (yes/no); Glasgow Coma Scale score (ordinal units); systolic blood pressure (millimeter of mercury); serum bilirubin (micromole per liter); serum creatinine (micromole per liter)
[image:8.595.57.547.424.693.2]ICU risk scores on death alone. We believe that this greatly expands the clinical utility of the CIPHER model. Maternal mortality is thankfully on the decline. As mor-tality declines, severe maternal morbidity will become even more relevant as an outcome to structure manage-ment strategies around. This model can now be easily recalibrated for individual settings as long as the 10 pre-dictor variables are available.
The CIPHER model was developed specifically for use in obstetric ICU populations with a globally di-verse cohort involving collaboration across 11 coun-tries. Although inclusion of a diverse geographic sample leads to an increase in global relevance, it also likely contributed to a reduction in overall model per-formance at the local level. A reduction in overall performance is evident when we compare perform-ance seen in the high- and low- or middle-income country subgroups. In both settings, performance is maintained above the threshold for an adequate prog-nostic model (AUROC >0.7) but CIPHER is better at discriminating between women with and without out-comes in the low- or middle-income population, where the majority of outcomes occurred. A potential weakness of the dataset used is the variability in out-come rates between sites; 88.6% of outout-comes occurred in LMIC sites, 57.6% solely in the Pakistan site. For this reason, we recommend external validation and, if
required, recalibration of the model in each setting individually before application in clinical care.
Performance of the CIPHER model to predict mater-nal death alone was similar to the APACHE II model in our cohort. We chose to use both maternal death and the need for life-saving organ support as a primary out-come in order to make the CIPHER model more clinic-ally useful for a pregnant population than a model such as APACHE II, which predicts death alone. Severe ma-ternal morbidity is as significant in its life-altering con-sequences as mortality within this young and otherwise healthy population of women.
[image:9.595.60.536.86.322.2]same sample size formula with our observed outcome rate of 16.5%, a sample size of 606 would be considered adequate to generate robust estimates of model coeffi-cients. We far exceeded that with our sample size of 769 women in the cohort used for analysis.
Another limitation is that because clinicians were not masked to the results of the variables assessed in the modeling, CIPHER is vulnerable to treatment paradox [30]; this may be particularly true for the protective nature of post-surgical status that may modify both admission and intervention thresholds and surveillance intensity.
Interpretation
Identifying the variables that predict outcome in pregnant or recently pregnant women admitted to the ICU and de-veloping a prediction model enables estimation of the like-lihood of an adverse maternal event in the future on the basis of information available at the time of a woman’s ad-mission to the ICU. The candidate predictor variables for the CIPHER model were those that were routinely and re-liably measured, were readily available in hospitals world-wide, and had potential to inform or predict severity of illness or outcome. The definition of severe maternal mor-bidity was organ- and management-based, reflecting the true burden of disease in the ICU: both the need for organ support and the impact of prolonged duration of organ support and care.
In the development cohort, a threshold CIPHER score of at least 50% was deemed a “positive” test for the combined outcome to define a high-risk group. The LR of 27.97 (95% CI 16.91 to 46.27) for this group is strongly informative. In this group, with an at least 50% CIPHER risk, there is evidence for action as it identifies those women who are most at risk of a combined outcome. In areas where resources are available to manage additional case load or where greater concern exists around impact of missing true-positive cases, setting the threshold for high risk as greater than 25% predicted probability remains in-formative with an LR of 9.18 (95% CI 6.16 to 13.69) with only a small increase in associated false-positive rate. This means that useful clinical information can be gained from the CIPHER model in order to guide care in a variety of contexts.
Four published studies have focused on development of a maternal ICU outcome prediction model [10, 31–33]. Developed solely in Brazil, the Maternal Severity Index used predefined, rather than statistically driven, WHO se-verity markers, identifying seven predictors of maternal death, many of which were themselves composite predic-tors [10]. A secondary analysis of a cohort of maternal general ICU admissions from the UK that focused on evaluation of APACHE II variables identified medical
history, heart rate, systolic blood pressure, and especially Glasgow Coma Scale score as independently predictive of maternal death [31]; however, they did not develop a mul-tivariable prediction model. Nine independent variables predictive of maternal death were identified in a West Af-rican (non-ICU) hospital-based study [32]. Of these, many were indications for ICU admission in our study and were not included as candidate predictor variables, including severe anemia, malaria diagnosed during pregnancy, ob-stetric hemorrhage, pre-eclampsia or eclampsia, uterine rupture, and genital infection or sepsis. Again, these vari-ables were not formally combined to generate a compar-able predictive model. A US military cohort was used to develop a 13-variable risk assessment model to predict 38 maternal outcomes, including labor, delivery, maternal morbidity, and death [33]. Performance of this model was good with a reported AUROC of 0.75 for poor maternal outcome, but the model is applicable only to the antenatal period. None of these studies resulted in models overtly applicable to critical care of obstetric patients in both HICs and LMICs.
Future work in this area of research should focus on a number of translational biomarkers poised to become regular components of both maternity and critical care and with potential to modify CIPHER [34,35]. Prospect-ive external and temporal validation studies of CIPHER are required prior to its broad dissemination into com-munities of care, whether in LMICs or HICs. To support work towards external validation we have provided a CI-PHER calculator (see Additional file 2). An additional goal for validation could be to expand the scope of the CIPHER model to recalibrate in a population admitted to a high-risk maternity unit in order to guide decisions around admission to the ICU.
Conclusions
The CIPHER model determines the risk of death or need for significant organ support in a population of pregnant and post-partum women receiving critical care, with clinical utility in both HICs and LMICs. CIPHER has the potential to be a pragmatic risk prediction tool to iden-tify women at highest risk for adverse ICU outcomes and to assist with counseling patients and their families regarding management within the ICU. Ultimately, once validated, the CIPHER model could be applied globally to reduce the burden of pregnancy-related morbidity and mortality.
Additional files
Additional file 1:Table S1.CIPHER (Collaborative Integrated Pregnancy
High-dependency Estimate of Risk) cohort collaborators and site contribution.
through complete case analysis.Table S3.Characteristics of women with and without missing data. (DOCX 43 kb)
Additional file 2:CIPHER (Collaborative Integrated Pregnancy
High-dependency Estimate of Risk) model clinical calculator. (XLSX 12 kb)
Abbreviations
ABG:Arterial blood gas; APACHE: Acute Physiology And Chronic Health Evaluation; aPTT: Activated partial thromboplastin time; AUROC: Area under the curve of the receiver operating characteristic; CI: Confidence interval; CIPHER: Collaborative Integrated Pregnancy High-dependency Estimate of Risk; HIC: High-income country; ICU: Intensive care unit; LASSO: Least Absolute Shrinkage and Selection Operator; LMIC: Low- and middle-income countries; LR: Likelihood ratio; SOFA: Sepsis-related Organ Failure Assessment; WHO: World Health Organization
Acknowledgments
CIPHER Group: Joni Kooy, Brittany Tarras, Nancy Liu, Rebecca Gordon, Shannon Lockhart, Annie Tran, Run shan Felar Yu, Yisa Yen, Andy Dhaliwal, Chris Lim, Nelson Luk, Saba Marzara and Navdeep Dha (Vancouver), Niamh Barrett (Monash, Melbourne), Lucia Haritgan (National Maternity Hospital, Dublin), Evan Lambe, Aoife Doyle, Aisling McMahon and Richard Katz (Rotunda Hospital), Andrea Das Neves and Vanina Aphalo (Argentina), Marlot Kallen (AMC, the Netherlands), Colleen Lee (Montefiore, New York), Katey Austin, Mary Mahler, Dinusha Sen and Alina Blazer (Mount Sinai, Toronto), Xiaotian Ni (Shanghai, China), Sheikh Irfan and Azra Amerjee (AKU, Pakistan), Antonio F. Oliveira Neto, Mary Angela Parpinelli, Maria Laura Costa, Thais Giovarotti, and Etienne Cordeiro (Campinas, Brazil).
Funding
This project was funded the Canadian Institutes for Health Research catalyst grant: Maternal health: from Pre-conception to Empty Nest grant on 1/9/ 2010 # H10–00654.
Most data were collected and shared without funding using internal resources.
Availability of data and materials
This project brought together datasets from 13 sites from around the world. The data are available for other investigators use. Please contact PvD with access requests.
Authors’contributions
PvD, LAM, HR, KRW, BAP, and JAH were responsible for conceptualization of the study. PvD, LAM, HR, KRW, BAP, SL, JL, ML, JAH, KJ, SaL, RQ, and ZAB were responsible for planning the study, including design of the protocol, data collection tools, and database. ZAB, MB, JGC, CC, TC, ACJMdP, OD, TD, MK, JWG, MG, DG, StL, IL, EMH, FM, COH, BWM, PGRS, RT, TT, RQ, DV, EW, PY, VZ, and KRW contributed data and carried out the study. BAP, HR, UVU, and JB analyzed the data. BAP, HR, PvD, UVU, JB, LAM, and KRW drafted the manuscript. All authors approved the final version of the manuscript.
Ethics approval and consent to participate
Independent research ethics board (REB) approval was obtained at each site, and the CIPHER study was registered for REB approval in University of British Columbia (UBC) (H10–00654).
Consent for publication
Not applicable.
Competing interests
The authors declare that they have no competing interests.
Publisher’s Note
Springer Nature remains neutral with regard to jurisdictional claims in published maps and institutional affiliations.
Author details
1
Department of Obstetrics and Gynaecology, University of British Columbia, 2329 West Mall, Vancouver V6T 1Z4, BC, Canada.2Department of Anesthesiology, Pharmacology and Therapeutics, University of British Columbia, 2329 West Mall, Vancouver V6T 1Z4, BC, Canada.3BC Children’s
Hospital Research Institute and Women’s Health Research Institute, University of British Columbia, V3-336 950 W 28th Avenue, Vancouver, BC V5Z 4H4, Canada.4Department of Family Practice, University of British Columbia, 2329 West Mall, Vancouver V6T 1Z4, BC, Canada.5Department of Medicine, University of British Columbia, 2329 West Mall, Vancouver V6T 1Z4, BC, Canada.6School of Life Course Sciences, Faculty of Life Sciences and Medicine, King’s College London, Strand, London WC2R2LS, UK.7Center of Excellence in Women & Child Health, Aga Khan University, Block 2 Clifton, Karachi, Sindh, Pakistan.8Centre for Global Child Health, the Hospital for Sick Children, 555 University Ave, Toronto M5G 1X8, ON, Canada.9Rotunda Hospital, University College Dublin, 1, Parnell Square E, Dublin, Ireland. 10
Universidade Estadual de Campinas, Cidade Universitaria Zeferino Vaz -Barao Geraldo, Campinas 13083-970, Sao Paulo, Brazil.11Montefiore Medical Center, Columbia University Medical Center, 951 Prospect Ave, Bronx 10459, NY, USA.12Morgan Stanley Children’s Hospital & Sloan Hospital for Mothers, 10032, 3959 Broadway, New York, NY, USA.13Department of Obstetrics and Gynaecology, Monash University, Wellington Rd, Clayton 3800, Victoria, Australia.14Academic Medical Centre, Meibergdreef 9, Amsterdam 1105, AZ, The Netherlands.15Inonu University, Bulgurlu Mahallesi, Malatya 44000, Battalgazi, Turkey.16Shanghai 1st Maternity and Infant Hospital, 200000, 536 Changle Rd, Shanghai, Jingan Qu, China.17Mt Sinai Hospital, University of Toronto, 600 University Ave, Toronto M5G1X5, ON, Canada.18King Abdullah University Hospital, Ar Ramtha 3030, Ramtha, Jordan.19UCD Perinatal Research Centre, School of Medicine, University College Dublin, National Maternity Hospital, Belfield Downs, Dublin D14YH57, Ireland.20Department of Paediatrics and Women’s Health, University of Adelaide, Adelaide 5005, SA, Australia.21Hospital Interzonal General de Agudos Gral, Av. 101 Dr Ricardo Balbin, Buenos Aires 3200, Argentina.22Centre for Heart Lung Innovation, St Paul’s Hospital, 1081 Burrard Street, Vancouver V6Z1Y6, BC, Canada.
Received: 12 April 2018 Accepted: 3 October 2018
References
1. Ryan HM, Sharma S, Magee LA, Ansermino JM, MacDonell K, Payne BA, et al. The Usefulness of the APACHE II Score in Obstetric Critical Care: A Structured Review. J Obstet Gynaecol Can. 2016;38:909–18. 2. Crozier TM, Wallace EM. Obstetric admissions to an integrated general
intensive care unit in a quaternary maternity facility. Aust N Z J Obstet Gynaecol. 2011;51:233–8.
3. Lapinsky SE, Kruczynski K, Seaward GR, Farine D, Grossman RF. Critical care management of the obstetric patient. Can J Anaesth. 1997;44:325–9. 4. Cook R, Cook D, Tilley J, Lee K, Marshall J. Multiple organ dysfunction:
baseline and serial component scores. Crit Care Med. 2001;29:2046–50. 5. Knaus WA, Draper EA, Wagner DP, Zimmerman JE. APACHE II: a severity of
disease classification system. Crit Care Med. 1985;13:818–29.
6. Metnitz PG, Moreno RP, Almeida E, Jordan B, Bauer P, Campos RA, et al. SAPS 3--From evaluation of the patient to evaluation of the intensive care unit. Part 1: Objectives, methods and cohort description. Intensive Care Med. 2005;31:1336–44.
7. Moreno RP, Metnitz PG, Almeida E, Jordan B, Bauer P, Campos RA, et al. SAPS 3--From evaluation of the patient to evaluation of the intensive care unit. Part 2: Development of a prognostic model for hospital mortality at ICU admission. Intensive Care Med. 2005;31:1345–55.
8. Vincent JL, Moreno R, Takala J, Willatts S, De Mendonca A, Bruining H, et al. The SOFA (Sepsis-related Organ Failure Assessment) score to describe organ dysfunction/failure. On behalf of the Working Group on Sepsis-Related Problems of the European Society of Intensive Care Medicine. Intensive Care Med. 1996;22:707–10.
9. Oliveira-Neto A, Parpinelli MA, Cecatti JG, Souza JP, Sousa MH. Sequential organ failure assessment score for evaluating organ failure and outcome of severe maternal morbidity in obstetric intensive care. ScientificWorldJournal. 2012;2012:172145.
10. Souza JP, Cecatti JG, Haddad SM, Parpinelli MA, Costa ML, Katz L, et al. The WHO maternal near-miss approach and the maternal severity index model (MSI): tools for assessing the management of severe maternal morbidity. PLoS One. 2012;7:e44129.
12. Lockitch G. Handbook of diagnostic biochemistry and haematology in normal pregnancy. Boca Raton: CRC Press; 1993.
13. Philipp EE, Barnes J, Newton M. Scientific foundations of obstetrics and gynaecology. 3rd ed. Oxford: Butterworth-Heinemann Ltd; 1987.
14. Peduzzi P, Concato J, Kemper E, Holford TR, Feinstein AR. A simulation study of the number of events per variable in logistic regression analysis. J Clin Epidemiol. 1996;49:1373–9.
15. Lapinsky SE, Hallett D, Collop N, Drover J, Lavercombe P, Leeman M, et al. Evaluation of standard and modified severity of illness scores in the obstetric patient. J Crit Care. 2011;26:535–7.
16. van Buuren S, Groothuis-Oudshoorn K. mice:Multivariate Imputation by Chained Equations in R. J Stat Soft. 2016;45:1–67 url:http://www.jstatsoft. org/v45/i03/.
17. Donders ART, van der Heijden GJMG, Stijnen T, Moons KGM. Review: A gentle introduction to imputation of missing values. J Clin Epidemiol. 2006; 59:1087–91.
18. Moons KGM, Donders RART, Stijnen T, Harrell FE Jr. Using the outcome for imputation of missing predictor values was preferred. J Clin Epidemiol. 2006;59:1092–101.
19. Tibshirani R. Regression shrinkage and selection via the Lasso. J R Stat Soc. 1996;58:267–88.
20. Friedman J, Hastie T, Tibshirani R. Regularization Paths for Generalized Linear Models via Coordinate Descent. J Stat Softw. 2011;33:1–22 URL http://www.jstatsoft.org/v33/i01/.
21. Rubin D. Multiple Imputation for Nonresponse in Surveys. New York: Wiley; 1987.
22. Hanley JA, McNeil BJ. The meaning and use of the area under a receiver operating characteristic (ROC) curve. Radiology. 1982;143:29–36. 23. De Cock B, Nieboer D, Van Calster B, Steyerberg E, Vergouwe Y (2016).
CalibrationCurves:Calibration performance. R package version 0.1.2. 24. Harrell FE Jr. (2018). rms: Regression Modeling Strategies. R package version
5.1–2.https://CRAN.R-project.org/package=rms.
25. Steyerberg EW, Vickers AJ, Cook NR, Gerds T, Gonen M, Obuchowski N, et al. Assessing the performance of prediction models: a framework for traditional and novel measures. Epidemiology. 2010;21:128–38.
26. Deeks J, Altman D. Statistics notes - Diagnostic tests 4: likelihood ratios. Br Med J. 2004;329:168–9.
27. Efron B, Tibshirani R. Improvements on Cross-Validation: The .632 Bootstrap Method. J Am Stat Assoc. 1997;(438):548–60.https://doi.org/ 10.2307/2965703.
28. Payne BA, Hutcheon JA, Ansermino JM, Hall DR, Bhutta ZA, Bhutta SZ, et al. A risk prediction model for the assessment and triage of women with hypertensive disorders of pregnancy in low-resourced settings: the miniPIERS (Pre-eclampsia Integrated Estimate of RiSk) multi-country prospective cohort study. PLoS Med. 2014;11:e1001589.
29. von Dadelszen P, Payne B, Li J, Ansermino JM, Broughton PF, Cote AM, et al. Prediction of adverse maternal outcomes in pre-eclampsia: development and validation of the fullPIERS model. Lancet. 2011;377:219–27. 30. Harrell FE Jr, Lee KL, Mark DB. Multivariable prognostic models: issues in
developing models, evaluating assumptions and adequacy, and measuring and reducing errors. Stat Med. 1996;15:361–87.
31. Harrison DA, Penny JA, Yentis SM, Fayek S, Brady AR. Case mix, outcome and activity for obstetric admissions to adult, general critical care units: a secondary analysis of the ICNARC Case Mix Programme Database. Crit Care. 2005;9(Suppl 3):S25–37.
32. Huchon C, Dumont A, Traore M, Abrahamowicz M, Fauconnier A, Fraser W, et al. A prediction score for maternal mortality in Senegal and Mali. Obstet Gynecol. 2013;121:1049–56.
33. Novicoff WM, Wagner DP, Knaus WA, Kane EK, Cecere F, Draper E, et al. Initial development of a system-wide maternal-fetal outcomes assessment program. Am J Obstet Gynecol. 2000;183:291–300.
34. Staff AC, Burke O, Benton S, von Dadelszen P, Szafranski P, Zhang C, et al. Maternal circulating PlGF concentrations and placenta-related pregnancy complications: First results from the CoLab AngF Study. Pregnancy Hypertens. 2013;3:59.