R E S E A R C H A R T I C L E
Open Access
Viral aetiology of acute respiratory infections
among children and associated meteorological
factors in southern China
Binglin Cui
1, Dangui Zhang
2, Hui Pan
3, Fan Zhang
4, Jeremy Farrar
5, Frieda Law
6, H Rogier van Doorn
5,
Beiyan Wu
1and William Ba-Thein
3,7*Abstract
Background:Acute respiratory infections (ARIs) are common in children and mostly caused by viruses, but the significance of the detection of multiple viruses in ARIs is unclear. This study investigated 14 respiratory viruses in ARIs among children and associated meteorological factors in Shantou, southern China.
Methods:Paired nasal/throat-flocked swabs collected from 1,074 children with ARIs, who visited outpatient walk-in clinics in a tertiary hospital between December 2010 and November 2011, were examined for fourteen respiratory viruses - influenza viruses (FluA, FluB), respiratory syncytial viruses (RSV A and B), human coronaviruses (hCoV: 229E, OC43, HKU1, NL63), human metapneumoviruses (hMPV A and B), parainfluenza viruses (PIV1-4), human rhinoviruses (HRV A, B, C), enteroviruses (EV), adenoviruses (ADV), human bocavirus (hBoV), and human parechoviruses (hPeV) - by multiplex real-time PCR.
Results:We identified at least one virus in 82.3% (884/1,074) and multiple viruses in 38.6% (415/1,074) of patients. EV and HRV were the most frequently detected single viruses (42.3%, 374/884 and 39.9%, 353/884 respectively) and co-detected pair (23.1%, 96/415). Overlapping seasonal trends of viruses were recorded over the year, with dual peaks for EV and single peaks for the others. By logistic regression analysis, EV was positively associated with the average temperature and humidity, hCoV, and PIV4, but negatively with HRV, PIV3, and hBoV. HRV was inversely associated with EV and PIV3.
Conclusions:This study reports high viral detection and co-detection rates in pediatric ARI cases mainly due to EV and HRV. Many viruses circulated throughout the year with similar seasonal trends in association with temperature, humidity, and wind velocity. Statistically significant associations were present among the viruses. Understanding the polyviral etiology and viral interactions in the cases with multiple viruses warrants further studies.
Keywords:Virus, Acute respiratory infection, Meteorological factor, Children, China
Background
Acute respiratory infections (ARIs) are one of the illnesses of highest morbidity and mortality in children worldwide [1-3]. The pathogens causing ARIs vary geographically and by season, but globally viruses play a major role. Respira-tory syncytial virus (RSV) is by far the most common pathogen associated with severe respiratory diseases as
bronchiolitis, exacerbation of asthma, or pneumonia in early life, and is a leading cause of hospitalization in children under two [4]. Influenza viruses have the greatest potential to cause severe respiratory diseases in the very young, the elderly and those with underlying chronic con-ditions [5]. Enteroviruses including human rhinoviruses (HRV) and human enteroviruses (EV), previously identified in childhood upper respiratory tract infections, are com-monly associated with milder ARIs and have been sus-pected as major etiological agents of lower respiratory tract infections leading to bronchiolitis and pneumonia in infants [6]. It has also been reported that human metapneumovirus * Correspondence:wbathein@stu.edu.cn
3
Shantou-Oxford Clinical Research Unit, Shantou University Medical College, Shantou, Guangdong, P.R. China
7
Department of Microbiology and Immunology, Shantou University Medical College, Shantou, Guangdong, 515041, P.R. China
Full list of author information is available at the end of the article
© 2015 Cui et al.; licensee BioMed Central. This is an Open Access article distributed under the terms of the Creative Commons Attribution License (http://creativecommons.org/licenses/by/4.0), which permits unrestricted use, distribution, and reproduction in any medium, provided the original work is properly credited. The Creative Commons Public Domain Dedication waiver (http://creativecommons.org/publicdomain/zero/1.0/) applies to the data made available in this article, unless otherwise stated.
(hMPV) causes approximately 5-10% of all ARIs in chil-dren and adults [7] and adenoviruses (ADV) account for 5-15% of respiratory infections in children [8]. Respira-tory illnesses can be attributable to other viruses such as parainfluenza viruses (PIV) and human coronaviruses hCoV-229E, OC43 [7]. With rapid progress in mole-cular diagnostics, newly discovered viruses including human bocavirus (hBoV), human coronaviruses (hCoV-NL63, hCoV-HKU1), human parechoviruses (hPeV), and polyomaviruses WU (WUPyV) and KI (KIPyV) have also been detected in children with respiratory infections, with varying levels of proof of causation [9].
Hospital-based studies in children published over the last decade worldwide have identified viruses in up to 95% of ARI episodes, with a single virus found in 40-60% and multiple viruses in 1-40% of infected patients [7,8,10]. Co-infection is reportedly related to the time of year when cir-culations of multiple viruses occur [11]. Some studies have shown that the prevalence of co-infections is not related to the absolute prevalence of individual viruses [12]. Fac-tors such as young age, male gender, and history of im-munosuppression are associated with an increased chance of viral co-infections [11,13,14]. There could be likely in-teractions between climatic, environmental, and behav-ioral factors, and complex interplay between circulating viruses and population-level immunity regarding viral co-infections. Understanding these factors may help us pre-vent transmission of these infections.
Recent etiologic studies on pediatric respiratory infec-tions mostly report the prevalence in hospitalized chil-dren and the seasonality of viruses without elaborating viral co-infection. Therefore, the significance of the de-tection of multiple viral pathogens in ARIs is unclear. Here, we investigated fourteen common respiratory vi-ruses among pediatric outpatients in southern China during 2010–2011 and their associations with meteoro-logical factors.
Methods Study location
This study was conducted at the Pediatric Outpatient Walk-in Clinics, the First Affiliated Hospital of Shantou University Medical College. The Pediatric Department provides both primary and tertiary care (common prac-tice in China) for approximately 35,000 children per year in the Chaoshan region of southern China. The Chaoshan region is in the subtropical zone with an aver-age annual temperature of 21.3°C and excellent to lightly polluted air quality levels (air quality index, AQI: 17–142, in 2012–2013).
Study design
Based on modified WHO standard case definition of ARIs [7], eligible participants were defined as a child
0–16 years of age presenting within 3 days of onset of illness with at least two of the following: fever, sore throat, cough, rhinorrhea, nasal congestion, and hoarseness of voice. Patients with any condition preventing swab collec-tion were excluded. We recruited eligible patients in the morning, during which approximately 70% of patient visits are made, on a daily basis except public holidays from December 2010 to November 2011. Participants’ demo-graphic details and clinical features are shown in Table 1. Paired nose and throat-flocked swabs (Copan, Brescia, Italy, Cat. no. 503CS01 and 502CS01) were collected from each participant, combined in one tube, and stored within 3 h of collection at −80°C until further processing.
Laboratory procedure
Multiplex real-time PCR was performed using Roche, Lightcycler 480 II (Roche Diagnostics, Penzberg, Germany) to identify the following 14 respiratory viruses: influenza A (FluA), influenza B (FluB), respiratory syncytial viruses A and B (RSV), human coronaviruses 229E, OC43, HKU1 and NL63 (hCoV), human metapneumoviruses A and B (hMPV), human parainfluenza virus types 1, 2 , 3, and 4 (PIV1, PIV2, PIV3, and PIV4), human rhinoviruses A, B, and C (HRV), human enteroviruses (EV), human adenovi-ruses (ADV), human bocavirus (hBoV), and human pare-choviruses (hPeV).
Nucleic acid extraction was performed using the QIAamp Viral RNA Mini Kit (QIAGEN GmbH, Hilden, Germany, Cat. no. 52906). Reverse transcription and Real-time PCR assays were performed as described previously [15], except for the primers and/or probes for HRV, hPeV, and internal control equine arteritis virus (EAV, see the se-quences of 14 viruses in Additional file 1). Due to known cross-reactivity between enteroviruses [16-18], HRV was detected using two sets of primers and probes: HRV-v1 (version 1) for screening and HRV-v2 (version 2) for con-firmation. Real-time PCR results were interpreted as de-scribed previously [15]. The PCR was considered positive or negative when the Cp value was less than 40 cycles or exceeded 40 cycles, respectively, and the positive control showed the expected Cp value, negative control was nega-tive, and internal control showed the expected Cp value. A negative internal control signal was accepted in case of a positive target sequence with correct positive and negative control signals.
Meteorological data
Meteorological data, including the average daily tempe-rature (°C), the average daily humidity (%), and the aver-age daily wind velocity (km/h), were collected from the official website of Shantou Meteorology, TuTiempo. net (http://www.tutiempo.net/en/Climate/Shantou/2011/ 593160.htm).
Table 1 Demographic and clinical characteristics, and virus positivity of pediatric outpatients with acute respiratory infections (n = 1,074)
Parameter Patients with an ARI Virus-negative cases Virus-positive cases OR (95% CI) p valuef
Total (n = 1,074) Total (n = 190) Total (n = 884) OR (95% CI) p valuee Single virus (n = 469) Multiple viruses (n = 415)
Gender
Male 669 (62.3) 107 (56.3) 562 (63.6) Reference - 293 (62.5) 269 (64.8) Reference
-Female 405 (37.7) 83 (43.7) 322 (36.4) 0.7 (0.5-1.0) 0.06 176 (37.5) 146 (35.2) 0.9 (0.7-1.2) 0.47
Age group (year)
≤1 (infant) 225 (20.9) 41 (21.6) 184 (20.8) Reference - 103 (22.0) 81 (19.5) Reference
->1 -2 (toddler) 201 (18.7) 31 (16.3) 170 (19.2) 1.2 (0.7-2.0) 0.44 86 (18.3) 84 (20.2) 1.2 (0.8-1.9) 0.31
>2-5 (preschool child) 468 (43.6) 86 (45.3) 382 (43.2) 1.0 (0.7-1.5) 1.00 206 (43.9) 176 (42.4) 1.1 (0.8-1.5) 0.65
>5-16 (school child) 180 (16.8) 32 (16.8) 148 (16.7) 1.0 (0.6-1.7) 0.92 74 (15.8) 74 (17.8) 1.3 (0.8-2.0) 0.28
Clinical presentationa
Cough 894 (83.2) 161 (84.7) 733 (82.9) 0.9 (0.6-1.3) 0.54 384 (81.9) 349 (84.1) 1.2 (0.8-1.7) 0.38
Rhinorrhea 666 (62.0) 117 (61.6) 549 (62.1) 1.0 (0.7-1.4) 0.89 273 (58.2) 276 (66.5) 1.4 (1.1-1.9) <0.05
Fever of >38°Cb 359 (33.4) 75 (39.5) 284 (32.1) 0.7 (0.5-1.0) 0.05 138 (29.4) 146 (35.2) 1.3 (1.0-1.7) 0.08
Nasal congestion 157 (14.6) 36 (18.9) 121 (13.7) 0.7 (0.5-1.0) 0.06 65 (13.9) 56 (13.5) 1.0 (0.7-1.4) 0.89
Sneezing 109 (10.1) 22 (11.6) 87 (9.8) 0.8 (0.5-1.4) 0.47 48 (10.2) 39 (9.4) 0.9 (0.6-1.4) 0.68
Sore throat 99 (9.2) 19 (10.0) 80 (9.0) 0.9 (0.5-1.5) 0.68 43 (9.2) 37 (8.9) 1.0 (0.6-1.5) 0.89
Othersc 57 (5.3) 14 (7.4) 43 (4.9) 0.6 (0.3-1.2) 0.16 23 (4.9) 20 (4.8) 1.0 (0.5-1.8) 1.00
Socio-medical informationa
ARI history in 4 weeks
472 (43.9) 90 (47.4) 382 (43.2) 0.8 (0.6-1.2) 0.29 193 (41.2) 189 (45.5) 1.2 (0.9-1.6) 0.19
Passive smoking 605 (56.3) 103 (54.2) 502 (56.8) 1.1 (0.8-1.5) 0.52 275 (58.6) 227 (54.7) 0.9 (0.7-1.1) 0.24
Family size (person, n = 1,072)d
≤3 287 (26.8) 44 (23.3) 243 (27.5) Reference - 117 (25.0) 126 (30.4) Reference
-4-15 785 (73.2) 145 (76.7) 640 (72.5) 0.8 (0.6-1.2) 0.23 351 (75.0) 289 (69.6) 0.8 (0.6-1.0) 0.08
Data are presented as number (%). ARIs, acute respiratory infections.
a
Absence of respective symptoms, ARI history, or exposure to passive smoking as reference.
b
Armpit temperature.
c
Including hoarseness of voice, headache, earache, conjunctivitis, oral ulcer, peri-oral blebs, vomiting, diarrhea, stomachache, and rash.
d
Two missing data.
e
Comparison between virus-negative and virus-positive groups.
f
Comparison between single-virus and multiple-virus groups.
Cui
et
al.
BMC
Infectious
Diseases
(2015) 15:124
Page
3
of
Statistical analysis
We used Chi-square test to compare differences in the dis-tribution of categorical variables, ANOVA and Kruskall Wallis tests to compare medians, and the Pearson cor-relation analysis to evaluate the associations between the meteorological factors and viruses and among vi-ruses. The variables with significant associations were further analyzed in multivariate logistic regression models, in which symptoms and positivity of viruses were treated as dependent and independent variables to assess virus-symptom associations; and individual viruses were treated as dependent variables with meteorological factors or other viruses as independent variables to investigate meteorological factor-virus and virus-virus associations. A two-tailed p-Value of <0.05 was considered signifi-cant. All these analyses were performed with SPSS Statis-tics version 17.0.
Ethics
The study was approved by the Ethics Committee of the First Affiliated Hospital of Shantou University Medical College and the Oxford University Tropical Research Ethical Committee (OxTREC). Written informed con-sent was obtained from parents or legal guardians of children enrolled in the study.
Results
Of 1,074 children (62.3% male) recruited, 43.6% (468/ 1,074) were >2-5 years old (Table 1). At least one virus was identified in 82.3% (884/1,074) of the patients, with single virus in 43.7% (469/1,074) and multiple viruses in 38.6% (415/1,074). hPeV was not detected. Compared with virus-negative patients, virus-positive patients were less likely to have fever (OR: 0.7, 95% CI: 0.5-1.0,p= 0.05). Patients with multiple viruses were more likely to have rhinorrhea than those with single virus (OR: 1.4, 95% CI: 1.1-1.9,p< 0.05, Table 1). hCoV (OR: 1.6, 95% CI: 1.0-2.4) and PIV4 (OR: 1.6, 95% CI: 1.0-2.4) were more prevalent in the >5 year age group than in the ≤5 year group (all p≤0.05), while hBoV (OR: 0.3, 95% CI: 0.1-0.7) and RSV (OR: 0.4, 95% CI: 0.2-1.0) were less frequently found in the >5 year group (all
p< 0.05). Chi-square test and multivariate logistic regres-sion analysis showed that cough was positively associated with HRV and RSV, and negatively with EV; rhinorrhea was positively associated with HRV, PIV3, and hBoV, and negatively with EV; fever was positively associated with EV, and negatively with HRV and PIV3; and nasal congestion was positively associated with RSV, and negatively with EV and hCoV (allp< 0.05, Table 2).
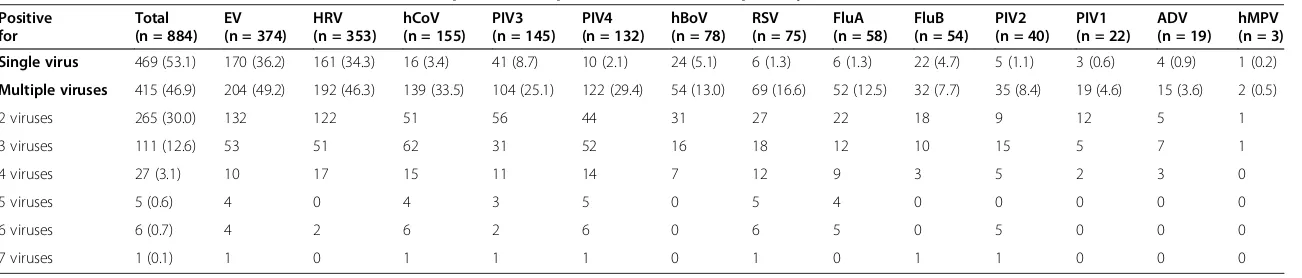
Viruses detected alone or co-detected with other vi-ruses are shown in Table 3. The most frequently de-tected virus was EV (42.3%, 374/884), followed by HRV (39.9%, 353/884), and hCoV (17.5%, 155/884). EV and HRV were most commonly co-detected with other vi-ruses (Table 3) and also the most commonly co-detected pair of viruses (23.1%, 96/415, see the distribution pattern of viruses in Additional file 2). Screening with HRV-v1 identified 298 cases co-positive for HRV and EV, and sub-sequent confirmation with HRV-v2 primers/3 probes [15] resulted in only 96 positive cases (32.2%, 96/298).
Seasonality and meteorological factors
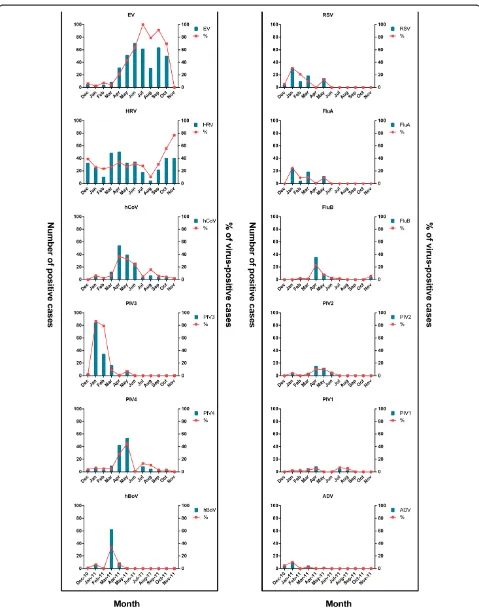
The temporal circulation and co-circulation patterns of viruses are shown in Figures 1 and 2. There were over-lapping seasonal trends of many viruses throughout the year, with dual peaks for EV in July and September and single peaks for the other viruses. Both EV and HRV cir-culated throughout the year. hCoV and PIV4 circir-culated predominantly between April and May but sporadically throughout the year. PIV3, RSV, FluA, and ADV peaked in January, while hBoV peaked in March. FluB circulated mostly from February to July with a peak in April. Co-detection of 5–7 viruses occurred all in May (see Additional file 3). The optimal average daily temperature, humidity, and wind velocity for these viruses are shown in Table 4.
Virus-meteorological and virus-virus associations
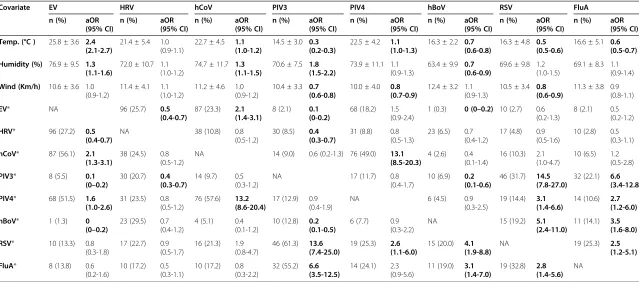
[image:4.595.56.541.603.717.2]Table 5 shows the multivariate logistic regression models for independent associations between the viruses and meteorological factors and between the viruses. EV was positively associated with the average temperature and humidity and the presence of hCoV and PIV4, but
Table 2 Multivariate logistic regression analysis of associations between viruses and clinical presentations
Variable Cough (n = 894) Rhinorrhea (n = 666) Fever (>38°C, n = 359) Nasal congestion (n = 157)
n (%) OR (95% CI) n (%) OR (95% CI) n (%) OR (95% CI) n (%) OR (95% CI)
EV 271 (30.3) 0.4 (0.3-0.5) 178 (26.7) 0.5 (0.4-0.7) 153 (42.6) 1.4 (1.1-1.9) 30 (19.1) 0.4 (0.3-0.7)
HRV 313 (35.0) 1.7 (1.2-2.6) 242 (36.3) 1.6 (1.2-2.1) 80 (22.3) 0.5 (0.3-0.6)
hCoV 12 (7.6) 0.5 (0.3-1.0)
PIV3 120 (18.0) 3.0 (1.8-4.7) 34 (9.5) 0.6 (0.4-0.9)
hBoV 67 (10.1) 3.3 (1.7-6.5)
RSV 72 (8.1) 4.3 (1.3-14.0) 20 (12.7) 2.0 (1.2-3.6)
Only the variables with p < 0.05 are shown (absence of non-virus cases as reference[s] accordingly).
Abbreviations:EV, enterovirus; HRV, human rhinovirus; hCoV, human coronavirus; PIV3, parainfluenza 3; hBoV, human bocavirus; RSV, respiratory syncytial virus.
Table 3 Detection of viruses from nasal/throat swabs of pediatric outpatients with acute respiratory infections, ARIs (n = 884)
Positive for
Total (n = 884)
EV (n = 374)
HRV (n = 353)
hCoV (n = 155)
PIV3 (n = 145)
PIV4 (n = 132)
hBoV (n = 78)
RSV (n = 75)
FluA (n = 58)
FluB (n = 54)
PIV2 (n = 40)
PIV1 (n = 22)
ADV (n = 19)
hMPV (n = 3) Single virus 469 (53.1) 170 (36.2) 161 (34.3) 16 (3.4) 41 (8.7) 10 (2.1) 24 (5.1) 6 (1.3) 6 (1.3) 22 (4.7) 5 (1.1) 3 (0.6) 4 (0.9) 1 (0.2)
Multiple viruses 415 (46.9) 204 (49.2) 192 (46.3) 139 (33.5) 104 (25.1) 122 (29.4) 54 (13.0) 69 (16.6) 52 (12.5) 32 (7.7) 35 (8.4) 19 (4.6) 15 (3.6) 2 (0.5)
2 viruses 265 (30.0) 132 122 51 56 44 31 27 22 18 9 12 5 1
3 viruses 111 (12.6) 53 51 62 31 52 16 18 12 10 15 5 7 1
4 viruses 27 (3.1) 10 17 15 11 14 7 12 9 3 5 2 3 0
5 viruses 5 (0.6) 4 0 4 3 5 0 5 4 0 0 0 0 0
6 viruses 6 (0.7) 4 2 6 2 6 0 6 5 0 5 0 0 0
7 viruses 1 (0.1) 1 0 1 1 1 0 1 0 1 1 0 0 0
Data are presented as number (%).
Abbreviations:EV, enterovirus; HRV, human rhinovirus; hCoV, human coronavirus; PIV1-4, parainfluenza 1–4; hBoV, human bocavirus; RSV, respiratory syncytial virus; FluA, influenza A; FluB, influenza B; ADV, adenovirus; hMPV, human metapneumovirus.
Cui
et
al.
BMC
Infectious
Diseases
(2015) 15:124
Page
5
of
Figure 1Temporal circulation pattern of respiratory viruses (n = 1,074).EV, enterovirus; HRV, human rhinovirus; hCoV, human coronavirus; PIV1-4, parainfluenza 1–4; hBoV, human bocavirus; RSV, respiratory syncytial virus; FluA, influenza A; FluB, influenza B; ADV, adenovirus.
% = individual-virus-positive cases/total cases tested.
negatively with HRV, PIV3, and hBoV. HRV was nega-tively associated with the presence of EV and PIV3. hCoV was positively associated with the average temperature and humidity and the presence of EV and PIV4. PIV3 was positively associated with the average humidity and the presence of RSV and FluA, but nega-tively with the average temperature and wind velocity, and the presence of EV, HRV, and hBoV. PIV4 was posi-tively associated with the average temperature and the presence of hCoV and RSV, however, negatively with the wind velocity. hBoV was positively associated with RSV and FluA, but negatively with the average temperature and humidity and the presence of EV and PIV3. RSV was positively associated with the presence of PIV3-4, hBoV, and FluA, but negatively with the average temperature and wind velocity. FluA was positively
associated with the presence of PIV3-4, hBoV, and RSV, but negatively with the average temperature.
Discussion
[image:7.595.58.540.88.248.2]This is the first prospective study reporting the associations between meteorological parameters and co-circulation patterns of 14 common respiratory viruses. The viral de-tection rate among pediatric outpatients with ARIs in this study (82.3%, 884/1,074) was higher than those reported from Nanjing, China (16 viruses, 50.6%, 248/490) [19] and other countries, including Honduras (16 viruses, 75.4%, 260/345) [20] and Greece (17 viruses, 70.0%, 428/611) [6] in the same study period. Enteroviruses (EV, 34.8% and HRV, 32.9%) were most frequently de-tected in our outpatient children. Influenza viruses and RSV, the leading pathogens in pediatric outpatients in
Figure 2Temporal co-circulation pattern of respiratory viruses (n = 1,074).EV, enterovirus; HRV, human rhinovirus; hCoV, human
coronavirus; PIV1-4, parainfluenza 1–4; hBoV, human bocavirus; RSV, respiratory syncytial virus; FluA, influenza A; FluB, influenza B; ADV, adenovirus. % = individual-virus-positive cases/total cases tested.
Table 4 The optimal average daily temperature, humidity, and wind velocity for some circulating viruses
Virus Average daily temperature (°C) Average daily humidity (%) Average daily wind velocity (Km/h)
5-14.9 15-24.9 25-35 30-49 50-69 70-99 3-12.9 13-22.9
EV - - √ - - √ √
-HRV - √ - - √ √ - √
hCoV - √ √
PIV3 √ - - √ √ √
-PIV4 - √ - - √ √ √
-hBoV - √ - √ √
-RSV √ -
-FluA √ -
-FluB - √ - - √ - √
-PIV2 - - √
ADV √ -
-Only statistically significant results (p < 0.05 by Chi-square test for individual comparisons of proportions within each group) are shown as“√”with reference(s) shown as“-”. The optimal temperature for hCoV and hBoV was 15–35°C. The optimal relative humidity was 60-79% for PIV3 and 80-99% for hCoV.
Abbreviations:EV, enterovirus; HRV, human rhinovirus; hCoV, human coronavirus; PIV2-4, parainfluenza 2–4; hBoV, human bocavirus; RSV, respiratory syncytial virus; FluA, influenza A; FluB, influenza B; ADV, adenovirus.
[image:7.595.59.540.516.698.2]Table 5 Multivariate logistic regression analysis of virus-meteorological and virus-virus associations
Covariate EV HRV hCoV PIV3 PIV4 hBoV RSV FluA
n (%) aOR (95% CI)
n (%) aOR (95% CI)
n (%) aOR (95% CI)
n (%) aOR (95% CI)
n (%) aOR (95% CI)
n (%) aOR (95% CI)
n (%) aOR (95% CI)
n (%) aOR (95% CI) Temp. (°C ) 25.8 ± 3.6 2.4
(2.1-2.7)
21.4 ± 5.4 1.0 (0.9-1.1)
22.7 ± 4.5 1.1 (1.0-1.2)
14.5 ± 3.0 0.3 (0.2-0.3)
22.5 ± 4.2 1.1 (1.0-1.3)
16.3 ± 2.2 0.7 (0.6-0.8)
16.3 ± 4.8 0.5 (0.5-0.6)
16.6 ± 5.1 0.6 (0.5-0.7) Humidity (%) 76.9 ± 9.5 1.3
(1.1-1.6)
72.0 ± 10.7 1.1 (1.0-1.2)
74.7 ± 11.7 1.3 (1.1-1.5)
70.6 ± 7.5 1.8 (1.5-2.2)
73.9 ± 11.1 1.1 (0.9-1.3)
63.4 ± 9.9 0.7 (0.6-0.9)
69.6 ± 9.8 1.2 (1.0-1.5)
69.1 ± 8.3 1.1 (0.9-1.4)
Wind (Km/h) 10.6 ± 3.6 1.0 (0.9-1.2)
11.4 ± 4.1 1.1 (1.0-1.2)
11.2 ± 4.6 1.0 (0.9-1.2)
10.4 ± 3.3 0.7 (0.6-0.8)
10.0 ± 4.0 0.8 (0.7-0.9)
12.4 ± 3.2 1.1 (0.9-1.3)
10.5 ± 3.4 0.8 (0.6-0.9)
11.3 ± 3.8 0.9 (0.8-1.1)
EV* NA 96 (25.7) 0.5
(0.4-0.7)
87 (23.3) 2.1 (1.4-3.1)
8 (2.1) 0.1 (0-0.2)
68 (18.2) 1.5 (0.9-2.4)
1 (0.3) 0 (0–0.2) 10 (2.7) 0.6 (0.2-1.3)
8 (2.1) 0.5 (0.2-1.2)
HRV* 96 (27.2) 0.5
(0.4-0.7)
NA 38 (10.8) 0.8
(0.5-1.2)
30 (8.5) 0.4 (0.3-0.7)
31 (8.8) 0.8 (0.5-1.3)
23 (6.5) 0.7 (0.4-1.2)
17 (4.8) 0.9 (0.5-1.6)
10 (2.8) 0.5 (0.3-1.1)
hCoV* 87 (56.1) 2.1 (1.3-3.1)
38 (24.5) 0.8 (0.5-1.2)
NA 14 (9.0) 0.6 (0.2-1.3) 76 (49.0) 13.1
(8.5-20.3)
4 (2.6) 0.4 (0.1-1.4)
16 (10.3) 2.1 (1.0-4.7)
10 (6.5) 1.2 (0.5-2.8)
PIV3* 8 (5.5) 0.1
(0–0.2)
30 (20.7) 0.4 (0.3-0.7)
14 (9.7) 0.5 (0.3-1.2)
NA 17 (11.7) 0.8
(0.4-1.7)
10 (6.9) 0.2 (0.1-0.6)
46 (31.7) 14.5 (7.8-27.0)
32 (22.1) 6.6 (3.4-12.8) PIV4* 68 (51.5) 1.6
(1.0-2.6)
31 (23.5) 0.8 (0.5-1.2)
76 (57.6) 13.2 (8.6-20.4)
17 (12.9) 0.9 (0.4-1.9)
NA 6 (4.5) 0.9
(0.3-2.5)
19 (14.4) 3.1 (1.4-6.6)
14 (10.6) 2.7 (1.2-6.0)
hBoV* 1 (1.3) 0
(0–0.2)
23 (29.5) 0.7 (0.4-1.2)
4 (5.1) 0.4 (0.1-1.2)
10 (12.8) 0.2 (0.1-0.5)
6 (7.7) 0.9 (0.3-2.2)
NA 15 (19.2) 5.1
(2.4-11.0)
11 (14.1) 3.5 (1.6-8.0) RSV* 10 (13.3) 0.8
(0.3-1.8)
17 (22.7) 0.9 (0.5-1.7)
16 (21.3) 1.9 (0.8-4.7)
46 (61.3) 13.6 (7.4-25.0)
19 (25.3) 2.6 (1.1-6.0)
15 (20.0) 4.1 (1.9-8.8)
NA 19 (25.3) 2.5
(1.2-5.1) FluA* 8 (13.8) 0.6
(0.2-1.6)
10 (17.2) 0.5 (0.3-1.1)
10 (17.2) 0.8 (0.3-2.2)
32 (55.2) 6.6 (3.5-12.5)
14 (24.1) 2.3 (0.9-5.6)
11 (19.0) 3.1 (1.4-7.0)
19 (32.8) 2.8 (1.4-5.6)
NA
Categorical data are presented as number (%), continuous data are presented as mean ± SD. Viruses with no significant association are not shown. *Adjusted for age, and all variables withp< 0.05 are shown in bold.
Abbreviations:aOR, adjusted odds ratio, 95% CI, 95% confidence interval; NA, not applicable; EV, enterovirus; HRV, human rhinovirus; hCoV, human coronavirus; PIV3-4, parainfluenza 3–4; hBoV, human bocavirus; RSV, respiratory syncytial virus; FluA, influenza A.
similar studies [6,21-23], were detected in 10.4% and 7.0% of our cases, with hCoVs (229E, OC43, HKU1, and NL63) in 14.4%, and relatively recently discovered viral pathogens hBoV and hMPV in 7.3% and 0.3% of cases, respectively (Table 3).
The viral co-detection rate (38.6%, 415/1,074) was also high among our study population. Reported rates of co-detection vary widely, from 6.1% among pediatric pa-tients with influenza-like illness [19] to 62% among infants with acute bronchiolitis [24]. Detection of dual viruses is common, and co-detection of five [25] or even six viruses [26] is not anecdotal. All the cases with 5–7 viruses in this study were in May, the end of the cold season in the Chaoshan region. This may be in part due to past viral infections, as some viruses can still be de-tectable by PCR several weeks after infection [15,16]. Most studies have shown that RSV is the predominant respiratory pathogen co-detected in hospitalized chil-dren, followed by HRV, PIV, hMPV, hBoV, and FluA [25,27]. In this study, EV, HRV, hCoV, and PIV 3–4 were involved in the majority of co-detections, with EV-HRV as the most frequently detected pair (23% of co-detections). EV and HRV were included in the panels in many studies globally [6,7,10,11,24,28-34], and the EV-HRV pair was the most commonly detected pair among outpatient children with ARIs in Finland (19.6% of co-detections) [28] and infants with acute bronchiolitis in Brazil [10]. The co-detection rate of EV-HRV in this study is similar to that in Finland [28].
Varying detection rates of multiple viruses in different studies may reflect the differences in the study period and location, study population, environmental factors, the number of respiratory pathogens tested, and/or the diagnostic methods/techniques used. Likely reasons be-hind high detection rates of single and multiple viruses in this study could be due to improved recovery of vi-ruses by using flocked swabs [35] and/or combined nasal and throat swabs [16].
There are advantages and disadvantages of multiplex PCR technique in diagnosing respiratory viral infections. While its high sensitivity and specificity facilitate simul-taneous detection of a large spectrum of viruses, includ-ing those difficult to be identified by traditional methods [32], its capacity to detect low amounts of viral nucleic acids in some cases during viral incubation period, asymptomatic infection, or post-infectious shedding makes it difficult to interpret the results [30,32]. The de-velopment and validation of standardized quantitative PCR with clinically relevant cutoff values [30] or com-bining qPCR with serology could be helpful for etiologic understanding of simultaneous presence of multiple viruses.
Certain host-specific risk factors may predispose a child to respiratory co-infection. Younger age [11,13,14],
male gender, and history of immunosuppression are as-sociated with increased risk of viral co-detections [14]. Nonetheless, similar associations were not found in this study.
Meteorological factors vs. viral detections
Viral co-detection is not random; clear associations for certain viral co-occurrence have been described [36]. The viruses circulating at the same time of a year are more likely to accompany each other [7,11,13]. This may be driven by meteorological factors which actually work behind seasonal variations, or by interactions of certain coexisting viruses. Temperature, humidity, and wind velocity are the most commonly studied factors significantly associated with the overall number of ARI hospitalizations and the prevalence of various respira-tory viruses [37-39].
Temperature
The average temperature is the key climatic parameter associated with the prevalence of many respiratory vi-ruses. Some viruses survive and/or replicate better at low temperatures, having peak prevalence in the colder months. In our study, the detection rates of PIV3, RSV, FluA, and ADV were negatively associated with tem-perature and were highest at temtem-peratures between 5°C and 15°C (Tables 4 and 5), supporting the notion that low temperature is suitable for the survival of lipid-enveloped air-borne viruses [40]. Low temperatures have been found to favor RSV in southeast China [38], Malaysia [41], Nepal [23], Brazil [42] and Germany [37], influenza in Japan [43] and Germany, and ADV in Germany [37]; however, high temperatures favored PIV3 in southeast China [38,44] and Nepal [23], RSV in Singapore [45], Hong Kong [46], and Indonesia [47], and ADV in southeast China [38]. No association between temperature and FluA activity was found in Nepal [23] and Brazil [42]. In our study, other viruses such as EV, hCoV, and PIV4 were more often detected during months with higher tem-peratures, having peaks at temperatures between 15°C and 35°C (Tables 4 and 5). In contrast to our findings, hCoV was negatively associated with temperature, and no associ-ation between EV and temperature was found among chil-dren with ARIs in Germany [37].
Humidity
Association of humidity and viral detection rates has been reported from Germany [37], Singapore, Hong Kong, Brisbane, and Vancouver [40]. In this study, three viruses (EV, hCoV, and PIV3) were positively associated with the average humidity (Table 5). The optimal aver-age humidity ranges for EV and hCoV were 70-99% and 80-99% respectively, supporting a previous finding that high average humidity (80%) had a protective effect on
the survival of hCoV [48]. Our findings on PIV3 are inconsistent with animal and laboratory observations that lipid-enveloped viruses such as PIV survived better in cooler, less humid environment [49]. hBoV was nega-tively associated with the average humidity, and its opti-mal humidity was 30-69% (Tables 4 and 5). No climatic data is available for comparison regarding this virus. Previ-ously reported association between FluA and the average humidity [40] was not found in our study.
Wind velocity
PIV1 and PIV3 have been reported to be negatively associ-ated with wind velocity [37]. In low wind speed environ-ment, viruses can easily colonize in the epithelium of upper respiratory tract [38]. An increased wind velocity is correlated with RSV activity in Germany [37]. In our study, PIV3, PIV4, and RSV were inversely associated with the wind velocity. Although we observed higher rates of EV and FluB but lower rate of HRV in low wind velocity, we could not confirm these associations by logistic regres-sion analysis.
The underlying reasons for the observed associations between virus circulations and meteorological factors are unclear. Climate could have a direct or indirect effect on viral survival, transmission efficiency, host immunity, and social behavior change [23,37]. Cold and dry condi-tions might favor the transmission of viruses, and cold or rainy days could decrease outdoor activities of chil-dren and increase the probabilities of close contact and transmission of infections [37]. Holidays (supported by our data with less cases in February as Chinese new year and July-August summer holiday, Figure 2 and Additional file 3), could also play a role in an annual epidemic cycle [50]. It is likely that several factors inter-act in complex ways in the development of observed ep-idemics under optimal climatic conditions and that the contributions of individual factors vary for different vi-ruses. Further investigations such as time series model over many years are needed to account for their inher-ent autocorrelations [29], and thus the observed associ-ations between meteorological parameters and viruses in this exploratory analysis should be interpreted with caution.
Virus-virus association
Viral co-detection patterns may be the reflection of interactions between viruses. Co-detection of viruses has been frequently reported [6,7,11,24,30,32]. Here, we have assured their associations by mathematical models (Table 5). We identified many pairs of viruses with posi-tive associations, including EV-hCoV, hCoV-PIV4, PIV3-RSV, PIV3-FluA, PIV4-PIV3-RSV, hBoV-PIV3-RSV, hBoV-FluA, and RSV-FluA. Negative associations for EV-HRV, EV-PIV3,
EV-hBoV, HRV-PIV3, and PIV3-hBoV were also found in this study.
Cross-reactivity of HRV primers with EV
Both belonging to the enteroviruses genus, HRV and EV have similarities in the highly conserved sequence of the 5’ noncoding region, which is the preferred site for mo-lecular assay development [16,17,51,52]. Cross-reactivity between the primers of HRV with EVs has been reported and is among others attributable to EV-D68, an emer-ging pathogen frequently undetected and misdiagnosed as HRV [17,18,52,53]. Confirmation of cross-reacting EV types in this geographic region should be done in future studies.
Clinical significance of viral positivity
There is no consensus in the literature on the clinical implications of the viral detection and co-detection. Some studies linked multiple viral detections with fever [32], or increased hospitalization and intensive care admission [6], while others described a very similar prognosis as in single infection [10,24,25], or even milder presentations [54]. In this study, the virus-negative patients had fever more often, which may be caused by other pathogens such as bacteria. We also found that rhinorrhea was more fre-quently present in patients with multiple viruses than in those with a single virus, and some viruses were more (or less) likely to exist in certain age groups or were accom-panied with certain symptoms. Since we did not follow the cases, the associated clinical course and outcome (such as hospitalization) remain unknown. A better un-derstanding on the clinical courses of single and multiple viral etiologies requires further studies.
The current study has several limitations. The majority of outpatients enrolled in this study were mild and mod-erate cases. Therefore, we could have missed pathogens responsible for severe ARIs. As healthy or asymptomatic controls were not included, their viral carriage burdens and the actual role of virus infections could not be eluci-dated. Following up the cases for clinical burdens and serologic testing would be required in future studies. Air quality indicators such as Ozone and PM2.5, which might influence the host’s susceptibility or virus circula-tion, should be included to investigate meteorological factors.
Conclusions
In summary, this study reports a high viral carriage in pediatric ARI cases with high viral co-detection rates mainly due to EV and HRV. There were overlapping seasonal trends of many viruses throughout the year. Meteorological factors, including temperature, humidity, and wind velocity, were associated with the viral de-tection rates. Statistically significant associations were
present among the viruses. Further studies are needed to address polyviral etiology and viral interaction in mul-tiple virus positive cases.
Additional files
Additional file 1:Primers and probes of 14 viruses.
Additional file 2:The distribution pattern of viruses in pediatric outpatients with acute respiratory infections, ARIs (n=415).
Additional file 3:The number of viral co-positive cases by month.
Abbreviations
ARIs:Acute respiratory infections; FluA: Influenza A; FluB: Influenza B; RSV: Respiratory syncytial virus; hCoV: Human coronavirus; hMPV: Human metapneumovirus; PIV: Parainfluenza virus; HRV: Human rhinovirus; EV: Enteroviruses; ADV: Adenoviruses; hBoV: Human bocavirus; hPeV: Human parechoviruses.
Competing interests
The authors declare that they have no competing interests.
Authors’contributions
BLC and HP designed and performed the experiments, analyzed the data, and wrote the paper. DGZ designed and performed the experiments, and analyzed the data. FZ analyzed the data. JF conceived and designed the experiments, and analyzed the data. FL analyzed the data, and facilitated the study. HRvD analyzed the data. BYW facilitated the study. WB-T designed the experiments, analyzed the data, and wrote the paper. All authors read and approved the final manuscript.
Acknowledgements
We would like to thank the pediatricians from the Pediatric Department, the First Affiliated Hospital of Shantou University Medical College for their generous support, the children and their guardians for participation in this study, Richard Molenkamp at the University of Amsterdam, Academic Medical Center for technique and knowledge transfer to set up the multiplex real-time PCR, Jieling Chen at the Shantou-Oxford Clinical Research Unit for technical assistance, and staff in the International Institute of Infection and Immunity, Shantou University Medical College for their assistance with real-time PCR.
This study was supported by the Li Ka Shing Foundation, Shantou University Medical College, and the University of Oxford (grant No. B9RSRT0-14). The funders had no role in study design, data collection and analysis, decision to publish, or preparation of the manuscript.
Author details
1Pediatric Department, the First Affiliated Hospital of Shantou University
Medical College, Shantou, Guangdong, P.R. China.2The Research Center of
Translational Medicine, the Second Affiliated Hospital of Shantou University Medical College, Shantou, Guangdong, P.R. China.3Shantou-Oxford Clinical
Research Unit, Shantou University Medical College, Shantou, Guangdong, P.R. China.4Oncology Research Laboratory, Cancer Hospital of Shantou University
Medical College, Shantou, Guangdong, P.R. China.5Oxford University Clinical Research Unit, Hospital for Tropical Diseases, Wellcome Trust Major Overseas Programme, Ho Chi Minh City, Viet Nam.6Consultant Office, Shantou
University Medical College, Shantou, Guangdong, P.R. China.7Department of
Microbiology and Immunology, Shantou University Medical College, Shantou, Guangdong, 515041, P.R. China.
Received: 17 April 2014 Accepted: 2 March 2015
References
1. Lin YK, Chang CK, Chang SC, Chen PS, Lin C, Wang YC. Temperature, nitrogen dioxide, circulating respiratory viruses and acute upper respiratory infections among children in Taipei, Taiwan: a population-based study. Environ Res. 2013;120:109–18.
2. Feldman RA, Kamath KR, Rao PS, Webb JK. Infection and disease in a group of South Indian families. I. Introduction, methods, definitions and general observations in a continuing study. Am J Epidemiol. 1969;89(4):364–74. 3. Monto AS, Ullman BM. Acute respiratory illness in an American community.
The Tecumseh study. JAMA. 1974;227(2):164–9.
4. Yusuf S, Piedimonte G, Auais A, Demmler G, Krishnan S, Van Caeseele P, et al. The relationship of meteorological conditions to the epidemic activity of respiratory syncytial virus. Epidemiol Infect. 2007;135(7):1077–90. 5. Nair H, Brooks WA, Katz M, Roca A, Berkley JA, Madhi SA, et al.
Global burden of respiratory infections due to seasonal influenza in young children: a systematic review and meta-analysis. Lancet. 2011;378(9807):1917–30.
6. Kouni S, Karakitsos P, Chranioti A, Theodoridou M, Chrousos G, Michos A. Evaluation of viral co-infections in hospitalized and non-hospitalized children with respiratory infections using microarrays. Clin Microbiol Infect. 2013;19(8):772–7.
7. Razanajatovo NH, Richard V, Hoffmann J, Reynes JM, Razafitrimo GM, Randremanana RV, et al. Viral etiology of influenza-like illnesses in Antananarivo, Madagascar, July 2008 to June 2009. PLoS One. 2011;6(3):e17579.
8. Zou L, Zhou J, Li H, Wu J, Mo Y, Chen Q, et al. Human adenovirus infection in children with acute respiratory tract disease in Guangzhou. China APMIS. 2012;120(8):683–8.
9. Debiaggi M, Canducci F, Ceresola ER, Clementi M. The role of infections and coinfections with newly identified and emerging respiratory viruses in children. Virol J. 2012;9(1):247.
10. Nascimento MS, Souza AV, Ferreira AV, Rodrigues JC, Abramovici S, Silva Filho LV. High rate of viral identification and coinfections in infants with acute bronchiolitis. Clinics (Sao Paulo). 2010;65(11):1133–7.
11. Cilla G, Onate E, Perez-Yarza EG, Montes M, Vicente D, Perez-Trallero E. Viruses in community-acquired pneumonia in children aged less than 3 years old: High rate of viral coinfection. J Med Virol. 2008;80(10):1843–9.
12. Esposito S, Daleno C, Prunotto G, Scala A, Tagliabue C, Borzani I, et al. Impact of viral infections in children with community-acquired pneumonia: results of a study of 17 respiratory viruses. Influenza Other Respi Viruses. 2013;7(1):18–26.
13. Peng D, Zhao D, Liu J, Wang X, Yang K, Xicheng H, et al. Multipathogen infections in hospitalized children with acute respiratory infections. Virol J. 2009;6:155.
14. Chorazy ML, Lebeck MG, McCarthy TA, Richter SS, Torner JC, Gray GC. Polymicrobial Acute Respiratory Infections in a Hospital-Based Pediatric Population. Pediatr Infect Dis J. 2013;32(5):460–6.
15. Jansen RR, Schinkel J, Koekkoek S, Pajkrt D, Beld M, de Jong MD, et al. Development and evaluation of a four-tube real time multiplex PCR assay covering fourteen respiratory viruses, and comparison to its corresponding single target counterparts. J Clin Virol. 2011;51(3):179–85.
16. Lu X, Holloway B, Dare RK, Kuypers J, Yagi S, Williams JV, et al. Real-time reverse transcription-PCR assay for comprehensive detection of human rhinoviruses. J Clin Microbiol. 2008;46(2):533–9.
17. Centers for Disease C Prevention. Clusters of acute respiratory illness associated with human enterovirus 68–Asia, Europe, and United States 2008–2010. MMWR Morb Mortal Wkly Rep. 2011;60(38):1301–4.
18. Jaramillo-Gutierrez G, Benschop KS, Claas EC, de Jong AS, van Loon AM, Pas SD, et al. September through October 2010 multi-centre study in the Netherlands examining laboratory ability to detect enterovirus 68, an emerging respiratory pathogen. J Virol Methods. 2013;190(1–2):53–62.
19. Huo X, Qin Y, Qi X, Zu R, Tang F, Li L, et al. Surveillance of 16 respiratory viruses in patients with influenza-like illness in Nanjing, China. J Med Virol. 2012;84(12):1980–4.
20. Schlaudecker EP, Heck JP, Macintyre ET, Martinez R, Dodd CN, McNeal MM, et al. Etiology and seasonality of viral respiratory infections in rural honduran children. Pediatr Infect Dis J. 2012;31(11):1113–8. 21. Vidaurreta SM, Marcone DN, Ellis A, Ekstrom J, Cukier D, Videla C, et al.
[Acute viral respiratory infection in children under 5 years: Epidemiological study in two centers in Buenos Aires, Argentina]. Arch Argent Pediatr. 2011;109(4):296–304.
22. Bharaj P, Sullender WM, Kabra SK, Mani K, Cherian J, Tyagi V, et al. Respiratory viral infections detected by multiplex PCR among pediatric patients with lower respiratory tract infections seen at an urban hospital in Delhi from 2005 to 2007. Virol J. 2009;6:89.
23. Mathisen M, Strand TA, Sharma BN, Chandyo RK, Valentiner-Branth P, Basnet S, et al. RNA viruses in community-acquired childhood pneumonia in semi-urban Nepal; a cross-sectional study. BMC Med. 2009;7:35.
24. Huguenin A, Moutte L, Renois F, Leveque N, Talmud D, Abely M, et al. Broad respiratory virus detection in infants hospitalized for bronchiolitis by use of a multiplex RT-PCR DNA microarray system. J Med Virol. 2012;84(6):979–85.
25. Stefanska I, Romanowska M, Donevski S, Gawryluk D, Brydak LB. Co-infections with influenza and other respiratory viruses. Adv Exp Med Biol. 2013;756:291–301. 26. Peng J, Kong W, Guo D, Liu M, Wang Y, Zhu H, et al. The epidemiology and
etiology of influenza-like illness in Chinese children from 2008 to 2010. J Med Virol. 2012;84(4):672–8.
27. Paranhos-Baccala G, Komurian-Pradel F, Richard N, Vernet G, Lina B, Floret D. Mixed respiratory virus infections. J Clin Virol. 2008;43(4):407–10. 28. Ruohola A, Waris M, Allander T, Ziegler T, Heikkinen T, Ruuskanen O.
Viral etiology of common cold in children, Finland. Emerg Infect Dis. 2009;15(2):344–6.
29. van den Bergh MR, Biesbroek G, Rossen JW, de Steenhuijsen Piters WA, Bosch AA, van Gils EJ, et al. Associations between Pathogens in the Upper Respiratory Tract of Young Children: Interplay between Viruses and Bacteria. PLoS One. 2012;7(10):e47711.
30. Jansen RR, Wieringa J, Koekkoek SM, Visser CE, Pajkrt D, Molenkamp R, et al. Frequent detection of respiratory viruses without symptoms: toward defining clinically relevant cutoff values. J Clin Microbiol. 2011;49(7):2631–6. 31. Pierangeli A, Gentile M, Di Marco P, Pagnotti P, Scagnolari C, Trombetti S,
et al. Detection and typing by molecular techniques of respiratory viruses in children hospitalized for acute respiratory infection in Rome, Italy. J Med Virol. 2007;79(4):463–8.
32. Calvo C, Garcia-Garcia ML, Blanco C, Vazquez MC, Frias ME, Perez-Brena P, et al. Multiple simultaneous viral infections in infants with acute respiratory tract infections in Spain. J Clin Virol. 2008;42(3):268–72.
33. Njouom R, Yekwa EL, Cappy P, Vabret A, Boisier P, Rousset D. Viral etiology of influenza-like illnesses in cameroon, january-december 2009. J Infect Dis. 2012;206 Suppl 1:S29–35.
34. Jennings LC, Anderson TP, Werno AM, Beynon KA, Murdoch DR. Viral etiology of acute respiratory tract infections in children presenting to hospital: role of polymerase chain reaction and demonstration of multiple infections. Pediatr Infect Dis J. 2004;23(11):1003–7.
35. Debyle C, Bulkow L, Miernyk K, Chikoyak L, Hummel KB, Hennessy T, et al. Comparison of nasopharyngeal flocked swabs and nasopharyngeal wash collection methods for respiratory virus detection in hospitalized children using real-time polymerase chain reaction. J Virol Methods. 2012;185(1):89–93. 36. Brunstein JD, Cline CL, McKinney S, Thomas E. Evidence from multiplex
molecular assays for complex multipathogen interactions in acute respiratory infections. J Clin Microbiol. 2008;46(1):97–102.
37. du Prel JB, Puppe W, Grondahl B, Knuf M, Weigl JA, Schaaff F, et al. Are meteorological parameters associated with acute respiratory tract infections? Clin Infect Dis. 2009;49(6):861–8.
38. Ji W, Chen ZR, Guo HB, Wang MJ, Yan YD, Zhang XL, et al. Characteristics and the prevalence of respiratory viruses and the correlation with climatic factors of hospitalized children in Suzhou children’s hospital. Zhonghua Yu Fang Yi Xue Za Zhi. 2011;45(3):205–10.
39. Chan PK, Mok HY, Lee TC, Chu IM, Lam WY, Sung JJ. Seasonal influenza activity in Hong Kong and its association with meteorological variations. J Med Virol. 2009;81(10):1797–806.
40. Tang JW, Lai FY, Nymadawa P, Deng YM, Ratnamohan M, Petric M, et al. Comparison of the incidence of influenza in relation to climate factors during 2000–2007 in five countries. J Med Virol. 2010;82(11):1958–65. 41. Khor CS, Sam IC, Hooi PS, Quek KF, Chan YF. Epidemiology and seasonality
of respiratory viral infections in hospitalized children in Kuala Lumpur, Malaysia: a retrospective study of 27 years. BMC Pediatr. 2012;12:32. 42. Nascimento-Carvalho CM, Cardoso MR, Barral A, Araujo-Neto CA, Oliveira JR,
Sobral LS, et al. Seasonal patterns of viral and bacterial infections among children hospitalized with community-acquired pneumonia in a tropical region. Scand J Infect Dis. 2010;42(11–12):839–44.
43. Urashima M, Shindo N, Okabe N. A seasonal model to simulate influenza oscillation in Tokyo. Jpn J Infect Dis. 2003;56(2):43–7.
44. Chen Z, Zhu Y, Wang Y, Zhou W, Yan Y, Zhu C, et al. Association of meteorological factors with childhood viral acute respiratory infections in subtropical China: an analysis over 11 years. Arch Virol. 2014;159(4):631–9.
45. Chew FT, Doraisingham S, Ling AE, Kumarasinghe G, Lee BW. Seasonal trends of viral respiratory tract infections in the tropics. Epidemiol Infect. 1998;121(1):121–8. 46. Chan PK, Sung RY, Fung KS, Hui M, Chik KW, Adeyemi-Doro FA, et al.
Epidemiology of respiratory syncytial virus infection among paediatric patients in Hong Kong: seasonality and disease impact. Epidemiol Infect. 1999;123(2):257–62.
47. Omer SB, Sutanto A, Sarwo H, Linehan M, Djelantik IG, Mercer D, et al. Climatic, temporal, and geographic characteristics of respiratory syncytial virus disease in a tropical island population. Epidemiol Infect. 2008;136(10):1319–27.
48. Casanova LM, Jeon S, Rutala WA, Weber DJ, Sobsey MD. Effects of air temperature and relative humidity on coronavirus survival on surfaces. Appl Environ Microbiol. 2010;76(9):2712–7.
49. Tang JW, Lai FY, Wong F, Hon KL. Incidence of common respiratory viral infections related to climate factors in hospitalized children in Hong Kong. Epidemiol Infect. 2010;138(2):226–35.
50. Fang LQ, Wang LP, de Vlas SJ, Liang S, Tong SL, Li YL, et al. Distribution and risk factors of 2009 pandemic influenza A (H1N1) in mainland China. Am J Epidemiol. 2012;175(9):890–7.
51. Landry ML, Garner R, Ferguson D. Comparison of the NucliSens Basic kit (Nucleic Acid Sequence-Based Amplification) and the Argene Biosoft Enterovirus Consensus Reverse Transcription-PCR assays for rapid detection of enterovirus RNA in clinical specimens. J Clin Microbiol. 2003;41(11):5006–10.
52. Meijer A, Benschop KS, Donker GA, van der Avoort HG. Continued seasonal circulation of enterovirus D68 in the Netherlands, 2011–2014. Euro Surveill. 2014, 19(42). Available online: http://www.eurosurveillance.org/ViewArticle. aspx?ArticleId=20935.
53. de Almeida MB, Zerbinati RM, Tateno AF, Oliveira CM, Romao RM, Rodrigues JC, et al. Rhinovirus C and respiratory exacerbations in children with cystic fibrosis. Emerg Infect Dis. 2010;16(6):996–9.
54. Martin ET, Kuypers J, Wald A, Englund JA. Multiple versus single virus respiratory infections: viral load and clinical disease severity in hospitalized children. Influenza Other Respi Viruses. 2012;6(1):71–7.
Submit your next manuscript to BioMed Central and take full advantage of:
• Convenient online submission
• Thorough peer review
• No space constraints or color figure charges
• Immediate publication on acceptance
• Inclusion in PubMed, CAS, Scopus and Google Scholar
• Research which is freely available for redistribution
Submit your manuscript at www.biomedcentral.com/submit