Rochester Institute of Technology
RIT Scholar Works
Theses
Thesis/Dissertation Collections
1-2005
Polyaniline nanotubes: Catalysis and their
conversion to carbon nanotubes
Stephen Paquette
Follow this and additional works at:
http://scholarworks.rit.edu/theses
This Thesis is brought to you for free and open access by the Thesis/Dissertation Collections at RIT Scholar Works. It has been accepted for inclusion
in Theses by an authorized administrator of RIT Scholar Works. For more information, please contact
Recommended Citation
Polyaniline Nanotubes: Catalysis And Their Conversion To Carbon Nanotubes
Stephen Paquette
July 2005
A Thesis Submitted In Partial Fulfillment Of The Requ
ir
ements For The Degree Of
Master Of Science In Chemistry
Approved:
Santhanam K.S.V.
Thesis Advisor
T. C. Morrill
Department Head
Department of Chemistry
Rochester Institute of Technology
Copyright Release Form
Polyaniline Nanotubes: Catalysis And Their Conversion To Carbon Nanotubes
I, Stephen Paquette, hereby grant permission to the Wallace Memorial Library, of
RIT, to reproduce my thesis in whole or in part. Any use will not be for commercial use
or profit.
S
1gna e
.
tur
- - - + - - - -
Stephen Paquette
Table
ofContents
Abstract
i
Acknowledgements
ii
Publications
iii
List
ofFigures
iv
List
ofSchemes
v1
.Introduction
1
1.1
Conducting
Polymers
2
1
.2Polyaniline
3
1.3 Polyaniline Nanotubes
4
1.3.1 Template
Assembly
Synthesis
5
1.3.2
Self-Assembly
Synthesis
5
1
.4Formation Mechanism
6
1.4.1 Template
Assembly
6
1.4.2
Self-Assembly
7
1.5 Carbon Nanotubes
9
1.6 Polymer Carbonization
11
1.7 Purpose
ofThesis
12
2. Experimental
2.1 Chemicals
13
2.2 Instrumentation
13
2.2.1 Cyclic
Voltammetry
13
2.2.2
UV-Vis Analysis
2.2.3 GC/MS
Characterization
14
2.2.4 FTIR Characterization
14
2.2.5 TGA Characterization
14
2.2.6
Polarizing Microscopy
15
2.2.7 SEM Imaging/EDX Analysis
15
2.3 Procedures
15
2.3.1
Chemical Synthesis
ofPolyaniline
Nanotubes
15
2.3.2 Electrochemical Synthesis
ofPolyaniline Nanotubes
16
2.3.3 Catalytic Conversion
ofAniline
to
Azobenzene
16
2.2.4 On-Column
Conversion
ofAniline
to
Azobenzene
16
2.2.5 Thermal Conversion
ofPANI
tubes to
Carbon Tubes
17
3
.Results
andDiscussion
17
3
.1 Chemical
Synthesis
ofPANI Nanotubes
17
3.1.1
UV-Visible
Spectroscopy
18
3.1.2 FTIR
Spectroscopy
20
3. 1
.3Optical
Microscopy
21
3.1.4
SEM
Imaging
25
3.2 Electrochemical Template-Free Synthesis
ofPANI Nanotubes
26
3.2.1
Cyclic
Voltammetry
27
3.2.2
UV-Visible
Spectroscopy
30
3.2.3 FTIR
31
3.3
Polyaniline
Nanotube
Mediated Conversion
ofAniline
to
Azobenzene
35
3.3.1
UV-Vis
Timecourse
Study
ofAniline
to
Azobenzene
Conversion
36
3.3.2 GC-MS Analysis
ofAniline
to
Azobenzene
Conversion
39
3.4 Thermal Conversion
ofPolyaniline Nanotubes
to
Carbon
Nanotubes
41
3.4.1 Thermal Gravimetric Analysis
ofPolyaniline
Carbonization Products
42
3.4.2 FTIR Analysis
ofPolyaniline Thermal
Carbonization Products
44
3.4.3 EDX
andSEM Analysis
ofPolyaniline Thermal
Carbonization Products
45
4. Conclusions And
Suggestions For Future Work
50
Abstract
Polyaniline
nanotubes,
first
synthesizedby Parasarathy
andMartin in
1994,
have
been
studiedextensively in
recentyears.[l] The study
ofthese
nanodimensional particleshas
been
orientedmostly
toward
an attemptto
understandthe
electrical and magneticproperties
surrounding
these
semi-onedimensional
objects and also toward applicationsfor
their
utilization.[2]
The ability
to
producethese
nano-particleschemically
but,
withoutatemplatewas
first discovered
by
Wan in 1999.
[3]
The
useof chemical oxidantsoftenproduces undesirable
byproducts
during
the
reaction.Therefore,
wehave
usedthis
as a
launching
pointin
orderto
first
mirrorthis template-less
synthesisin
ourlab
andsubsequently
producethese
sametubules
electrochemically.Our in-situ doped
polymernanotubes showed
identical
spectroscopic andthermal
characteristics asis
shownin
the
original paper
in
whichthey
were produced.Both
optical andscanning
electronmicroscopy
were performed on the polymer nanotubes samples andboth
revealedthe
presence of
tubules
in large
quantities.The ability
ofthese
polymer nanotubesto
produce a catalytic effectin
the
oxidation of aniline
to
form
azobenzene was alsoinvestigated.
This
reaction wasmonitored
by
GC/MS
andUV-Vis
spectroscopy.The
polyaniline nanotubes werefound
to
exhibit a slight catalysisin
this
oxidationby
suppressionofbyproduct
azoxybenzeneformation.
A
different
avenue wasthen taken
in
defining
the
changeswhichthese
polymersundergo upon
heat
treatment
in
different
atmospheres.It
wassubsequently
determined
that the
polyaniline nanotubes canbe
convertedinto
carbon underan argon atmosphere.seem
to
offer a meansby
which carbon nanotubes canbe preferentially
formed
whenheated
to
275 C.
This
wasdetermined analytically
by
FTIR spectroscopy
andenergy
dispersive
X-ray
analysis.Scanning
electronmicroscopy
wasthen
again usedto
provideproof
that
single-walled carbon nanotubes areformed
at275 C
and that multi-walledcarbon nanotubesare
formed
at somewherebetween 600-1000C.
These
two
allotropicforms
ofcarbonare separatedby
atransition to
glassy
carbonoccurring
at400C.
Acknowledgements
Dr.
KSV
Santhanam,
for
his
vision, patience,
and guidanceMy
thesis committee,
Dr. T.C.
Morrill,
Dr. L.P.
Rosenberg,
andDr.
M. Miri
for
their
help
and guidance.
The Department
ofChemistry
atRIT for
financial
support andresearchfacilities.
Dr.
S. Rommel
ofthe
Microelectrical
Engineering
Department
atRIT for his amazing
expertise
in
SEM imaging.
Dr. M.
Illingsworth
for
sharedequipment usage.My
wife,
Van,
my
family,
andmy
puppy,
Homer
thank
you guysI
wouldn'thave
madeit
without yourhelp.
Posters/Presentations
S.
Paquette,
Y.
Xia,
andK.S.V.
Santhanam,
Template-Free
Sythesis
ofPolyaniline
Nanotubes
by
Electrochemical
Polymerization, Abstracts,
32ndNortheast Regional
Meeting
ofthe
American
Chemical
Society,
Rochester,
NY,
United
States,
October
31-November 3
(2004).
S. Paquette
andK.S.V.
Santhanam,
Synthesis
andCatalysis
ofPolyaniline Nanotubes:
High
Temperature
Conversion
to
Carbon
Nanotubes,
presentation,
205th
ESC
meeting,
Quebec
City, CAN,
May
2005.
List
ofFigures
Figure 1.
Emeraldine base interconversion
3
Figure
2. Mechanism
oftemplate-free
nanotubeformation
8
Figure
3.
Arc-discharge
apparatusfor
synthesis of carbonnanotubes10
Figure 4.
Different
conformations of carbon nanotubes10
Figure 5. Visible spectroscopy
ofdoped
polyanilinenanotubes18
Figure 6. Visible spectroscopy
ofdedoped
polyaniline nanotubes19
Figure 7. FTIR
analysis of polyaniline nanotubes21
Figure 8. Polyaniline film
producedby
the
chemicalmethod22
Figure 9. Template-free chemically
produced polyanilinenanotubefilm
23
Figure 10. Template-free chemically
producedpolyaniline nanotubefilm
24
Figure 11. Template-free chemically
produced polyaniline nanotubefilm
25
Figure 12. SEM image
of4: 1
emulsifier/monomer chemical reaction product26
Figure 13. Electrochemical
synthesisofpolyaniline nanotubes28
Figure 14. Cyclic voltammetry
curvefor
a polyanilinefilm
28
Figure
15. Cyclic voltammetry
curvefor
a polyaniline nanotubefilm
29
Figure 16. Visible spectroscopy
ofelectrochemically
produced polyaniline nanotubes..31Figure
17. FTIR
analysis ofelectrochemically
produced polyaniline nanotubes32
Figure 18. Amorphous
polyanilineelectrochemically
deposited
33
Figure
19. Polyaniline
nanotubefilm
electrochemically
produced34
Figure 20. Polyaniline
nanotubefilm
electrochemically
produced34
Figure
21. Polyaniline
nanotubefilm
producedonITO (edge view)
35
Figure 23. Time
dependent
absorbtion ofcis-azobenzene(425 nm)
38
Figure 24. Time
coursestudy
of polyanilinenanotube catalysis39
Figure
25.
GC-MS ion
countchromatogram40
Figure 26. GC-MS ion
countchromatogram40
Figure 27. TGA
of amorphous polyanilinein
compressed air42
Figure
28. TGA
of polyanilinenanotubesin
compressed air43
Figure 29. TGA
curvefor
pre-heated polyaniline nanotubes(400C for 1
hour)
43
Figure 30. Heat
treatmentof a polyaniline nanotubesample44
Figure 31. Elemental
analysis ofheat
treated
polyaniline nanotubes45
Figure 32. Elemental
analysis ofheat
treatedpolyaniline nanotubes46
Figure 33. SEM
Imaging
of polyanilinenanotube sample47
Figure 34. SEM
Imaging
ofpolyaniline nanotube sample48
Figure 35. SEM
Imaging
ofpolyaniline nanotube sample49
Figure 36. SEM
Imaging
ofpolyaniline nanotube sample50
List
ofSchemes
Scheme 1. Exciton
statesin
doped/conducting
polyene macromolecules20
Scheme
2. Electropolymerization
of polyaniline27
Scheme 3. Conversion
of anilineto
azobenzeneby
oxidation36
1. Introduction
Conducting
polymers werefirst
discovered
in
1976
by
Shirikawa, Heegar,
andMacDiarmid.[4]
A
specificconducting
polymer,
polyaniline,
has been
extensively
studied since
the
mid1980s.
Polyaniline,
orPANI,
has
the
attractiveproperties ofbeing
conductive
yet,
easily
processed anddurable.
In
1994,
micro- and nano-tubules ofpolyaniline were synthesized
by Parasarathy
andMartin
using
a alumina-silicatemplate.
[1]
A
template-free synthesis wassubsequently
reportedin 1999
by
Wan
etal.[3]
These
nano-structured polymers are of greatinterest due
to
their
semi-onedimensionality
andtheir
retention of conductivity.[5]
The
original methodsfor
synthesizing
these
polymer nanotubeshave
notbeen
largely
improved
upon sincetheir
original
discovery.
Therefore,
it is
the
goal ofthis thesis to
improve
uponthe
synthesismethodology
for
creating conducting
polymer nanotubes.This has been
accomplishedby
initiating
polymerizationelectrochemically
andwithoutthe
hindrance
ofa conventionaltemplate.
An
interesting
andpotentially
incredible
discovery
wasalsohappened
uponin
characterizing
the
newly
produced polymer nanotubes.Upon
heating
under aninert
atmosphere
the
tubes couldbe
carbonized whileretaining
their
originaldimensions
in
effect
to
produce carbon nanotubes.It
wasfound
that the types
oftubes
produced, eithermulti-walledor
single-walled,
could alsobe
selectedfor
by
variation oftemperature
andthat
single walledtubes
couldbe
produced at a muchlower
temperature than traditional
1.1
Conducting
Polymers
Three
types
ofconducting
polymers areknown:
ion
polymer solid electrolytesystems,
composites of electronicconducting
materialsin non-conducting
polymers,
andpolymers
that
conductelectricity
by
electronic transport.In
the
classicalsense,
only
the
latter is
thought
of ashaving
aninherent
conductivity.The conductivity
observedin
these
macromolecules resultsfrom
electron-holetransport.
Electron-hole
transport
is
simply
the transfer
of electronslocalized
ona particularatomin
amacromoleculeto
anadjacent atom either
in
the
polymer chain orin
an adjacent macromolecule whichis
spatially
close enoughfor
transfer
to occur.This
provides a conduction paththrough the
material,
somewhatresembling
electronic conductionin
metals andsemi-metals,
whichgives
rise
to the
macromolecule's ability
to
conduct electricity.[6]
The
discovery
ofconducting
polymersis
important
because
theirstudy
has
openedthe
door
to
understanding both
the
chemistry
and physics of 7r-bondedmacromolecules,
it has
allowed quantum physicists
to
addressthe
question of whether or not alternation ofbonding
occurredin
long
chain polyenes as well asto
ascertainthe
relativeimportances
of electron-electron
interaction
versus electron-latticeinteractions
in
macromolecules,
they
allowedfor
condensed-matter physicsto
be
expandedby investigating
the
Pierls
Instability
(the
idea
that
onedimensional
conductors cannotexist),
andfinally
andpossibly
mostimportantly
allowedfor
the
possibility
ofcreating
a new generation ofconductors with variable
conductivity,
mechanicalstability,
and ease of manipulation1.2
Polyaniline
Polyaniline is
a conjugated macromolecule which canbe
black,
dark
green,
orblue-violet
depending
upon oxidation state.It
has been known for
greaterthan
100
yearsand was
known
as"aniline
black" or"emeraldine."[6]
It
is
generally known in
four
different forms:
leucoemeraldine
whichis
insulating
andblue in
color,
emeraldinebase
which
is
green andsemi-conducting,
emeraldine salt whichis
also green yet moreconductive than emeraldine
base,
and pernigraniline whichis
violet orblack
and astrong
insulator.
[7]
The
electrical properties of polyanilinewerelargely
unknown untilthe
mid1980s.
Alan MacDiarmid
first
rendered the polymerconducting
viatwo
independent
routes: oxidation of
the
leucoemeraldine
base
or protonation ofthe
emeraldinebase
by
acid-base methods.
[8]
This
particularrouteinvolves modifying
the
oxidation state ofthe
polymer
by
introduction
ofinorganic
saltsto
generatethe
conductive state.This
processis
shownreversibly in Figure 1 below.
PAS1-E&
PANI-ES:
"I
200-A"1
=
CI-1,
ClO^NSA)-1.
.Figure 1. Emeraldine base interconversion. The conversion of emeraldine
base
to emeraldine saltby
modificationofdopantcounterion. A"1
=
Though
this
process rendersthe
polymerconducting,
it did
not renderit
easily
processed.
This
problem was counteredin
1992.
Cao, Smith,
andHeeger
utilized afunctionalized
protonic acidto
convert polyanilineto
the
metallicform
andsimultaneously
allowfor
the
polymerto
be
solublizedin
organic matrices.[9]
The
protonic acid
in
this
process acted as a surfactantin
that
it formed
a semi-micellarenvironment
for
the
polymerin
which achargedhead-group
actedto
solvatethe
polymerand
the
hydrophobic
tail
group
would solvatethe
complexin
the
surrounding
solvent.This
allowedfor
polyanilineto
be
made moreeasily
accessible andtherefore ableto
be
used
in
forming
different
polymerblends.
[10]
These
blends
were also melt-processableso
that
they
were nowalso availablefor industrial
applications.From
these melts,
a new method ofcreating
polymer-based electronics emerged.The
surfactant counterions seemedto
allowthe
polyanilineto
self-aggregate withinthe
melt of
the
other polymer.Interestingly,
whenthe
supportmatrixpolymerwasremoved,
the polyaniline network was still conductive.
This
retention ofconductivity
allowedfor
new electronics
possibilities,
including
the
first
light-emitting
diodes,
andis
one ofthe
major reasons
that
conducting
polymerresearchholds
so much potential.[1
1]
1.3 Polyaniline Nanotubes
Polyaniline
was one ofthe
first
polymersto
be structurally
controlled onthe
nanoscale
(made
into
nanotubules).They
have
attracted attentionrecently
because
oftheir
unique propertiesand andpotential applicationsin
nanodevices.fi1-14]
Some
ofthese properties
include,
single nanotubeconductivity
higher
than that
ofthe
bulk
variable upon
dopant
counterion.[15]
The
list
of currentpossible applications rangesfrom
electrochromicdevices,
light-emitting
diodes,
chromatography,secondary
batteries,
electrostatic
discharge
protection, to
corrosionprotecting
paint.[16-18]
1.3.1
Template
Assembly
Synthesis
The
first
polyaniline nanotubes were synthesizedin
1994.[1]
In
this synthesis,
aporous alumina-silicatemplate was used
to
provide a supportfor
conformational controlin
directing
nanotube growth.Monomer
is injected into
the
pores and an electricalpotential
is
appliedto the
complex.Monomer
is
oxidizedto
form
the
polymerinside
the
porous network which
then
adopts atubular
conformation asthe
polymerization goesto
completion
due
to
the
spatial constraints ofthe template.
This
method produces neatpolymer
tubules
however,
its
utility is limited due
to the
cleanup
steps requiredto
remove
the
alumina-silicatemplate.
1.3.2
Self-Assembly
Synthesis
This
wasthe
synthesis ofchoice until1999
whenWan
et al.developed
the
first
template
free
synthesis.[3]
This
synthesis producespolyaniline nanotubesfrom
solution.No
traditionaltemplate
is
involved
sono cleanup
steps are necessary.This
synthesishas
the addedadvantageof
doping
the
polymerasit is
synthesized.This is
accomplishedby
using
asurfactantto
provideanetworkfor
the
tubules to
form
in.
This
surfactantdoubles
as
the
dopant
and produces conductive polymerdirectly.
The
polymer nanotubesmethod,
andthe
percentage oftubules
producedis
greatly
surfactant/monomer ratiodependant.
1.4
Formation Mechanism
As
mentionedearlier, there
existtwo
alternative methodsfor
polyaniline nanotubeformation,
the template
method andthe
template-free method.This
section willdiscuss
the advantages,
differences,
andmechanisticaspectsofthese two
methods.1.4.1 Template
Assembly
In
template
synthesis of polyanilinenanotubes,
nanostructured polymeris
formed
using
an electriccurrentto
initiate
polymerizationwithinthe
channels.Kinetics
done
by
Dong
et al.2004
suggestthat tube
formation
during
polymerizationis
causedby
singlechainmonolayercrystallization and
then
later
by
diffusion
controlled polymerization.[19]
X-ray
diffraction
also showedthat the
electrosynthesized polyaniline was composed ofboth
crystalline and amorphous polymerindicating
that
the
final
structureis
notcontinuous.
The formation
of polyaniline nanotubesby
electropolymerizationin
atemplate
is
currently
thought
to
follow
the
sameformation
kinetics
asthe
electrocrystallization of metals.
In
this
model,
a nucleation site servesto
initiate
crystallization and crystallization then continues
in
either2D
progressive,
2D
instantaneous,
or3D
progressivefashion.
[20]
Of
these,
the
2D
instantaneous
and2D
progressive models appear
to
dominate
due
to the
spatial restraintsimposed
by
the
template.
Not
muchis
currently known
beyond
this
concerning
the
mechanism of1.4.2
Self-Assembly
The
template-free
formation
of polyaniline nanotubes occursby
adifferent
mechanism
than that
oftemplate
formation.
Firstly,
the
"template"whichis
usedto
form
the
tubules
is formed
by
micellar aggregation.In
this
process anilinium salt monomerand
the
surfactantform
micelles at concentrationsexceeding
the
critical micelleconcentration of
the
surfactant.The
micelleformed
may
be
selectedfor
by
varying
the
ratio of monomer/surfactant.
The
micellesthen
aggregate with each otherto
form
micellar
bodies
which aretubular.
Polymerization is
theninitiated
andthe
polymertube
is
formed.
This
processis diagrammed in
Figure 2
which shows4 different
outcomespossible
from
different
amounts of surfactant presentduring
synthesis.In
micelleA,
anilinium
salt,
labeled
(+) ,is
presentin
the
exterior ofthe
micellealong
withthe
surfactant,
labeled
(-)
.In
this aggregate,
no aniline monomeris
present onthe
interior
ofthe
micelle.Therefore
whensynthesisbegins,
the
micellar aggregate containsno aniline on
its
interior
resulting in
the
formation
ofa tubule.In
micelleB,
monomerhas
reachedthe
micellar aggregateinterior
resulting
in
rodformation
whenpolymerization
is
initiated.
In
micelleC,
no surfactantis
included in
the
reaction.Anilinium
salt acts as asurfactant soit
servesto
produceits
owntemplate
uponreaching
the
critical micelle concentration and atlow
pH.Again
however,
the
sametrend
is
repeated with tube
formation
occurring
when monomeris
excludedfrom
the
aggregateinterior
and rodformation occurring (micelle
D)
when monomeris included in
the
[ Wilh SDBS asurljctanl r 2.'*'itU>ulj wUUanl
Y.
Vg
St
0
,
<&&
<J^
^'
<U>
A
a
<><s>
^
Micelle D
aggicgifton aggregation aggregation aggregation
_y
donation
V
flllL,'
ubc
Figure2. Mechanismoftemplate-freenanotubeformation. Formationof polyanilinetubesor rods can
be
selectedfor
usingthe template-freesynthetic method.[30]
The
actual mechanismis
alsodifferent in
that the
entiretubule
is homogenous
with respect
to
structure.This
was shownby Yang
andWan
in 2002 in
which chiralpolyaniline nanotubes were
formed
using
camphor sulfonic acid asthe
dopant/surfactant.
[21]
These
tubes
werethen
found
to
exhibitCotton
effect whenanalyzed
using
circulardichroism.
Cotton
effects areindicative
ofhelical
structurestherefore,
this
showedthat
polyanilinenanotubesformed
by
template-free
methods adopttheconformation ofa
helix.
[image:20.547.127.427.48.406.2]It
is
alsoimpossible
for
the
same mechanismofformation
to
occurby
this
methodsince
there
is
no actualfoundation for
crystal nucleationto
occur upon.Translational
motion of micellar aggregates
does
not provide a "solid" supportin
this
sense.Instead,
the timescale
on whichthe
polymerization occursis
whatactually
allowsfor
a3-dimensional
structureto
be
selectedfor
during
synthesis.Radical
lifetimes
in
polymerizations are on
the
scale of nanoseconds.[22]
The
translational motions whichmicelles undergo are predicted
to
be
onthe
sametime
scalebut,
for
aggregates such asthose
formed
in
these
emulsions each micelle rotation mustbe
averaged over severalthousand
component micelles sothe
aggregate structure appearsto
be
somewhat staticwhencompared
to
the
polymer chainpropagating
radical.[23]
1.5
Carbon Nanotubes
It
wouldbe
difficult
to
discuss any
aspect ofnanostructured materialsproperly
without
making
referenceto
the
materialthat
really
startedthe
whole revolution ofnanoscience
the
carbon nanotube.Carbon
nanotubes werefirst
isolated
by
Sumio
Iijima
in 1991.
[24]
These
werefirst isolated
by
an arc-discharge synthesis method whichis diagramed
in Figure 3.
In
this method,
nanotubes are synthesized atthe
end of acarbon cathode which
is
stationary.The
anodeis
placed on amoving drive
andslowly
moved
toward the
cathode as carbonis
usedup in
orderto
keep
the
electric arc constant.The
sootproduced aswellasthe
carbon whichis deposited
onthe
cathode contain carbonlinear
nation feedthroueh electrode ctmnectionj
electrode ciinriBL-tioaFigure 3. Arc-dischargeapparatusforsynthesisof carbon nanotubes.
[25]
The
originaltubes
werefound
to
be
helical in
afashion
withdiameters
ranging
from
afew
nanometersto
afew
tens
of nanometers.They
canexist as eitherzig-zag
orarmchair configurationas shown
in
Figure 4
or as a chiralwrap.Chirality
is
the
majori \ , V
oop=bo ob=bd> o oo o
I
olpoo O O oc op oo'
oQo
do
oMo op0oP=<^ op-bd>
poo. CO
op
op o o ooo Cbo 00=0^0 oipPoP=c(o op=44>
d>o oiD=q o o
^
'\_
J ' OP o b opo oop bo ob=oa> ooo o
p
oo(a)
(b)
Figure 4. Differentconformations of carbon nanotubess.
(a)
Armchairconformationof carbonatomsincarbon nanotube.
(b) Zig-zag
conformationof carbon atomsincarbonnanotube.[25]determinant in
how
intrinsically
conductivethecarbon nanotubesare.Carbon
nanotubeshave many
properties which arethe
impetus for
the
intense
research
initiative into
their
synthesis and utilization.Some
ofthese
properties areextreme
elasticity
with aYoung's
Modulus
of greaterthan1
TPa[25],
the
highest
currentdensity
ofany
known
material at108
A/cm[26],
as well asbeing
roughly 100
times
stronger
than
steel.[26]
Therefore,
it
is
interesting
to
see what parallels canbe
madebetween
carbon andconducting
polymer nanotubes andwhetheror notthere
is
a methodof
interchanging
onefor
another.1.6 Polymer Carbonization
Only
very recently has
there
been any investigation
into
controlled carbonizationofpolymer compounds.
This
has
taken
placeprimarily in Japan
althoughthere
is
somepromising
researchgoing
onin
the
United
States
aswell.Of
the
different
carbonizationmethods,
pyrolysis of polymerblends
to
form
mesoporouscarbon,
pyrolysis oforganicgels prepared
by
solprocesses,
template
carbonization,
even catalyst mediatedcarbonization
into
structured moieties.[27]
Carbon
nanotubeshave recently been
produced
from
carbonizationmethods withoutthe
use of a catalyst.This
wasdone
by
Kim
et al.in 2001.
[28]
Strangely
this
was notfully
investigated
untilvery recently
(2004-2005). In
this paper,
poly(para-phenylenevinylene)
nanotubesweresynthesizedin
atemplate.
These
polymer tubules werethen
heated
to
1000C
in
aninert
atmosphere.They
notedthat
elemental analysis showedonly
carbon,
whichonly really
confirmsthat
Argon
gas was notincorporated
into
the material,
andthat
anincrease
in
the
amount ofcrystalline ^-character
in
the material whichis
characteristic of carbon nanotubeformation.
The
idea
ofusing
a templateinherent
to
a polymer nanostructureto
form
acarbonnanostructure
has
only been investigated
in
the
originallaboratory
which reportedit.
1.7 Purpose
ofthe
Thesis
The
purpose ofthis thesis
is
three-fold.Firstly,
to
improve
uponthe
template-freesynthesis of polyaniline nanotubes.
The
original synthesisby
Wan
etal.[3]
as earlierstated
has
notbeen
largely
improved
upon and stilldoes
not synthesize polymernanotubes as a neat material.
Electropolymerization
holds
great promisein
this
aspect asthere
is
alocal
synthesis atthe
working
electrode.Local
environments are moreeasily
manipulated
than
alarge
scale environment.Additionally,
thelocal
environment couldbe
alteredto
selectfor
tube
formation,
such asmodifying
the
electrodeto
be
moreconducive
to tube
formation.
Moreover,
washing
the
electrodeis very easy
to
do
whereascleanup
of abulk
synthesisis
morelaborious
due
to
the
presenceofmore material.Secondly,
the
oxidation of anilineto
form
azobenzenein
theinterior
of thepolyaniline nanotubeswill
be
examined.This
has already been
done
using
functionalized
carbonnanotubes
by
Gordon,
etal.[29]
However,
the
relationship between
tube
diameter
and catalytic ratewereof
interest
since polyaniline nanotubes areroughly 10
times
larger
in
diameter
than
functionalized
carbonnanotubes.Thirdly,
we willinvestigate
the
conversion ofpolyaniline nanotubesto
carbonnanotubes.
Carbon
nanotubeshold
great potentialin many
different
areas as noted earlier.Polyaniline
nanotubes alsohold
great potential.It
is
ofinterest
to
see what possibilitiesinterconverting
these two
materialsmay hold.
2. Experimental
2.1
Chemicals
Aniline
(Aldrich)
was purifiedby
distillation
and collected at180C
andkept
underrefrigeration.
Reagent
grade2-Naphthalenesulfonic
acidwas procuredfrom Fluka.
Azobenzene
waspurchased as crystalline solidfrom
Aldrich
anddessicated.
Ammonium
persulfate was purchased
from Aldrich
and used as received.Hydrogen
peroxide(30%
vol/vol) (Baker Analytical grade)
waskept
under refrigeration.All
solvents were used asreceived.
Fisher Scientific
decolorizing
carbon(Norite)
was used asthe
active carbonsample.
All
chemicals were ofreagentgrade.Solvents
were ofHPLC
grade exceptfor
distilled
water.2.2
Instrumentation
The RIT
Chemistry
Department
provided all neededinstrumentation
withthe
exception of
EDX
analysis(outside
contract)
andSEM
imaging
(RIT Microelectronic
Engineering
Department).
2.2.1 Cyclic
Voltammetry
Cyclic
voltammetry
curves weretaken
using
Gamry
Corrosion
Cyclic
Voltammetry
software.Working
electrodes consisted ofPt
plate,
Pt
wire,
orindium-tin
oxide
(ITO)
enriched plastic.A
graphite rod was used asthe
counter electrode andpotential was measured againstasaturated calomelelectrode.
2.2.2 UV-VIS Analysis
All
UV-Visible
spectra weretaken
using
aShimadzu High Resolution UV-2401
spectrometer.
A 1
cm x1
cmx10
cm quartzcuvette cell was usedasthe
sampleholder
with
the
following
method parameters:200-1000
nmscan,
slit width of0.5
mm,
andmedium scan speed.
All
measurements were measuredagainst acetonitrile solvent.2.2.3 GC/MS Characterization
Azobenzene
conversion was measured on aHewlett-Packard
6890 GC
with a5973 Mass
Selective
Detector.
An Agilent
19091S-396 60
m x250
urn x0.25
urncolumn was used
for
these
quantitations.Injection
manifold washeld
at280C
with acolumn
temperature
ramp
program of150C-320C
at a rate of20C/min.
Sample
injection
volumes were1
uLin
all experiments.2.2.4 FTIR Characterization
All
infrared
spectra weretaken
using
aBiorad Excalibur FTIR FTS3000
withDiffuse Reflectance
cell.Scan
parameters were asfollows:
2
cm"1
resolution,
4000-400
cm"1
scan
range,
mediumscanspeed,
and64
scan averaging.2.2.5 TGA
Characterization
Thermal
gravimetric measurements weretaken
using
aTA
(Delaware)
Instruments TGA 2050.
Platinum
pans were usedfor
measurements above600C.
Either
nitrogen or compressed air were used as carrier gas as specified.All
scans weretakenat
10C/min
scan rate.2.2.6
Polarizing
Microscopy
Optical
microscopeimages
weretaken
using
aReichert-Jung
Scope
with videoimaging.
All
images
weretaken
using
reflectivelight
andnofiltering. Magnification
of100 X
or500 X
was used as specified.2.2.7
SEM Imaging/EDX
Analysis
All scanning
electronimaging
wasdone
withthehelp
ofDr.
Sean L. Rommel
ofthe
Microelectronic
Engineering
department
atRIT.
Imaging
wasdone
at variedmagnification with
20kV beam
current,
0.6
pAfilament
current,
and0C
stagetem
perature.
EDX
analyses were performedby
an outside contractedgroup using
their
SEM/EDX instrument.
2.3 Procedures
2.3.1 Chemical Synthesis
ofPolyaniline Nanotubes
Chemical
synthesis of polyaniline nanotubes was carried out at0-4C
withstirring.
Ammonium
persulfate(0.1
M)
was used as radicalinitiator along
with anequimolar concentration
(0.1
M)
ofdistilled
aniline monomer.This
reaction was carriedout
for 15 hours in 0.1 M HC1
and(0.4
M)
2-naphthalene
sulfonic acid.Polyaniline
nanotubes were recovered
in
bulk
by
vacuumfiltration
followed
by
3
washes each ofwater,
ethanol,
anddiethyl
ether.Product
was allowedto
dry
for
24
hours
priorto
analysis.
Polyaniline
control was synthesizedusing
the
same processbut excluding
surfactant.
2.3.2
Electrochemical Synthesis
ofPolyaniline Nanotubes
Electrochemical
synthesis ofpolyaniline nanotubes was carriedout at0-4C
withstirring.
Working
electrode(Pt
plate,
Pt
wire,
orITO plastic)
was utilizedfor
radicalgeneration and
0.05
M
final
cone, ofdistilled
aniline monomer was used as substrate.This
reaction was carried outfor
2
identical
scans at10
mV/s scanrateandfrom 0
mVto
900
mV scan range.This
polymerization was carried outin 0.1 M HC1
and0.2
M
2-naphthalene sulfonic acid.
Polyaniline
nanotubes were recovered asdeposited
on theworking
electrode.Product
was washedin 0.1 M
sulfuric acidanddeionized
water andallowed
to
dry
priorto
analysis.Polyaniline
control was synthesizedusing
the
sameprocess
but
excluding
surfactant.2.3.3 Catalytic Conversion
ofAniline
to
Azobenzene
Distilled
aniline(0.1
M)
was reactedwith30%
H2O2
(0.1
M)
in
acetonitrilefor
60
minutes withUV-Vis
spectratakenevery 5
minutes.Polyaniline
nanotubes were added as catalystsin 40 mg
amounts.These
were measured against normal polyaniline andunfunctionalized multi-walled carbon nanotubes as well as uncatalyzed controls.
These
reactions were performedatroomtemperature.
2.2.4 On-Column Conversion
ofAniline
to
Azobenzene
Polyaniline
nanotubes were usedaspacking
materialfor
an on-column conversionexperiment
(sealed
with glassfiber).
A
control of glassfiber
was usedto
comparethe
sample column
to.
Distilled
aniline(0.1
M)
was reacted with30%
H202
(0.05
M)
in
acetonitrile andinstantly
drawn
overthe
column.The
reaction mixture was passed overthe
column3
times
in both
control and active column.Results
were qualified andquantified
by
GC-MS.
2.2.5
Thermal
Conversion
ofPolyaniline
Nanotubes
to
Carbon
Nanotubes
Polyaniline
nanotube enriched samples(200 mg)
wereheated
in
an argonatmosphere
to
275C, 400C,
and1000C.
The
sample remains afterheating
wererecovered and weighed
using
an analyticalbalance.
These
samples werethen
analyzedby
EDX, SEM, TGA,
and optical microscopy.3. Results
andDiscussion
3.1 Chemical Synthesis
ofPolyaniline Nanotubes
Polyaniline
nanotubeswerechemically
producedfollowing
the
method ofWan
etal.
1999 in
which emulsifier acts astemplate
anddopant[3].
The
emulsifier/dopant2-naphthalene sulfonic acid was combined with
distilled
aniline monomerin
a4:1
molarratio.
Ammonium
persulfate was added as afree-radical
initiator continuously
overthe
course ofreaction until
completely dissolved.
As
statedin
the
experimentalsection, this
reactionwascarriedout
for
15
hours
at0-4C. Reaction
wasterminated
by
washing
withexcess
deionized
water,
ethylalchohol,
and ether.Polyaniline
nanotubes wereformed in
thematrixof
the
parent polymer as a greenbulk
solid.3.1.1
UV-Visible
Spectroscopy
Polyaniline
nanotubes were characterizedby
UV-Vis
spectroscopy
and comparedto the
originalliterature (shown in Figures 5
and6)[3].
These
spectra were taken as adispersion
of polyaniline nanotubesdissolved
in
dimethyl
sulfoxide(DMSO).
In
the
original
synthesis, the
UV-Vis
absorption spectra weretaken
and showed peaks at880
nm,
640
nm,
and396
nm.The
same product wasthen
dedoped
by
allowing
thetubules to
sit
for
24 hours
in
DMSO
shownin Figure 6.
This
was notdone in
the original paperhowever,
it
is
useful as a method ofdepicting
the
conductivity
ofthe
polymer nanotubesas wellas
their
stability
in
solution.
0.40C-
0.200-0.001*
[image:30.547.75.418.339.557.2]290.0 400.0 800.0 1000.
Figure 5. Visible spectroscopy ofdoped polyaniline nanotubes. Absorptionspectra of
2-naphthalene
sulfonic aciddopedpolyaniline nanotubes.
0.400-
0.200-0.01
[image:31.547.59.409.44.257.2]290.0 400.0 600.0 800.0 1000.
Figure 6. Visible
spectroscopy
of de-doped polyaniline nanotubes. Absorption spectra of2-naphthalene sulfonic acid
de-doped
polyanilinenanotubes.In
the
case ofin-situ,
orduring-synthesis,
doped
polyaniline nanotubes clearindications
of conductive regimes are presentin
the
UV-Vis
spectra.These
conductiveregimes are
known
to
be
presentdue
to the
absorptionbands
present at400
and900
nm.The
absorptionbands
at400
and900
nm are characteristic ofa conductive state.[31]
To
form
this conductivestate,
dopant ions
arenecessary
and actto
create conductionby
forming
polarons.Polarons
are,
for
clarity,
paired electons onthe
same carbon adjacentto
anunpaired electronwhichresidesbetween
the
conductionband
andthe
ground state.They
are anecessity
for
conductancein
a molecular conductor.This
is
shownbelow
in
scheme
1 along
withbipolarons
and solitons other excitedenergy
states possiblefor
conductive electrons.
The
bands
at900
nm arethose
belonging
to the
bipolaron bands
with
the
band
at600
nmin
the
dedoped
statebeing
that
of apolaronband.
Polarons
areformed
in
the
undoped material moreprevalently
due
to
the absence ofthe
dopant
whichfacilitates
excitonformation.
Polarons
areinherent
to
molecular conductors and areonly
less
populated when adopant ion
is
presentto
stabilizebipolaron
and soliton pairformation.
The
band
at400
nmis
that
ofthe
7t->7i*transition
observedin
the
aromaticrings
whichis
why
it is
conservedfor both
spectra.[31]
ch,
polyene
Energy
levels
CH2
polaron
^CH2
bipolaron
H2C^/(
of
^o^
soliton pair
Scheme 1. Exciton states in
doped/conducting
polyene macromolecules.Energy
levels depicted
atright show ground state (lower
bar)
and conduction band(upper
bar)
energylevels.
Thedots depict
electronenergy
levels.
Thosewhich aredopant injected
resideintheenergy levelsclosesttobut,
notinside
the conduction
band.
Those electrons associated with parent polyene chain conjugation tend to residecloserto
but,
not insidethe ground state when sharing7t-bond carbons. Inthe ground state polyene, allelectronenergystates are ground state
levels.
[6]
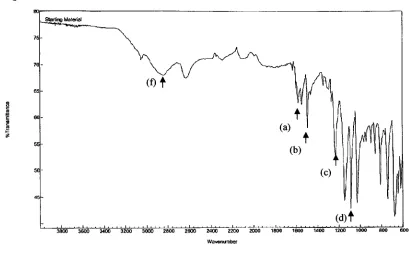
3.1.2
Diffuse-Reflectance
FTIR
Spectroscopy
The
product ofthe
emulsion reaction wasthen
comparedto the
original paperby
diffuse-reflectance
FTIR.
The
original paper showed absorptionbands
at(label a)
1576
cm"1
and
(label
b)
1496
cm"1,
respectively,
consistent withbenzenoid
and quinoidstretches
for C=C bonds. The C=N
stretch mode was observed at(label c) 1300
andthe
quinoidstretching
for
the
C=N=C
bonding
was observed at(label
d)
1140
. [image:33.547.66.475.207.460.2]These
peaks are also observablein
the
product of our reactionindicated
by
arrowsin
Figure 7
as well as atypically
observedN-H
stretch atapp (label
f)
3000
cm"1.Digilab Merlin
Figure 7. FTIR analysis of polyaniline nanotubes. Diffuse-reflectance FTIR scan of chemically
produced polyaniline nanotubes. Labelsa-fsignify different infra-red absorbingmoieties.
3.1.3 Optical
Microscopy
Optical
micrographsweretakenofthe
products ofthe
chemical reaction products.These
images
showedthe
presence ofnanotubulesin
the
reactionbatches
which wereemulsified and showed no
tubule
formation in
the
reactionbatch
lacking
emulsifier.These
photographs are shownin
Figures
8-11.
.
"
/
&
[image:34.548.61.454.98.375.2]10
Mm
Figure 8. Polyaniline filmproduced
by
thechemical method.Figure 8
shows a polyanilinefilm
coated onto a glass slide.No
bodies
with apparentstructure are visible
throughout the
film.
The
scale ofthe
picture also shows
that the
objuects which are not uniform with
the
rest of thefilm
are smaller thanthe
tubular
bodies
shownin
the
following
figures
9-11.
Figure
9
shows afilm in
which surfactant wasincluded in
the
synthesis.A
possible
tubular
morphology
is
apparentin
this
film.
At
this
pointit
remainsto
be
provenwhether or not
the
bodies
are crystalline outgrowthsfrom
afocal
point oractually
polyaniline nanotubes.
This
is later
addressed and provenby
SEM
imaging
however,
from
this micrographit
canbe
seenthat the
sizes ofthe
rod-likebodies
observed are onthe scaleof
5-10
urnin
length
andless
than
1
nmin diameter.
Figure 9. Template-free chemically produced polyaniline nanotubefilm. Polyanilinenanotube film
chemicallyproduced
by
a 1:1 molar ratio of emulsifier/monomer.In
Figure
10,
the
tubular
bodies
become
longer
and greaterin
number.Additionally,
the
question ofwhether atube
or rodis
being
formed
canbe
somewhataddressed.
The
clusters showmorphology
with openinteriors.
These
bodies
aretherefore,
atleast
rods with openinteriors.
This
couldbe
an artifactdue
to the
fact
that
this
micrograph wastaken
using
reflectivelight.
Still
atthe
very least it
canbe
established
that the
shorterdimension
to these
bodies is
round.The
presence oftubular
morphology becomes
more pronouncedin figure 11.
A
clusterof
tubules
is
visible withaveragedimension
of<1 nmdiameter
x40-50
urnlength.
Rods
are also presentto
showthe
contrastbetween
rods andtubes
in
this
figure.
The
rods
in
thisfigure
aredarkly
coloredthroughout
whereasthe tubes
still appearto
have
hollowed
interiors.
These
tubes are much moredistinctly
formed
than the
previousmicrographs show.
This
appearsto
be due
to the
surfactant/monomer ratio.This
was [image:36.548.61.404.157.437.2]also seen
in
the
originaldescription done
by
Wan
et al.[3].Figure 10. Template-free chemicallyproduced polyaniline nanotubefilm. Polyanilinenanotube
film
chemicallyproduced
by
a3: 1 molar ratio of emulsifier/monomer.In
summary,
asthe
emulsifierconcentrationis
increased from
zeroto
0.4
M,
the
tubular
bodies
produced seemto
adopt a muchmoredefined
structure.Additionally,
the
tubes
producedin
the
4:1
emulsifier/monomer reaction seemto
be
longer
than the
onesproduced at a
1:1
emulsifier/monomerratio.In
allcases, these tubes
areformed
withintheparentpolymer matrix.
Figure 11. Template-free chemicallyproduced polyaniline nanotubefilm. Polyanilinenanotube film
chemicallyproduced
by
a4: 1molar ratio of emulsifier/monomer.3.1.4
Scanning
Electron Microscope
Imaging
Figure 12
shows an electron micrographtaken
ofthe4:1
mole ratio reaction.In
this
image
it
is
clearly
shownthattubular
morphology is
present.Clear
evidence of openendedstructures
is
present as shownby
the
arrow(blue).
Moreover,
it
can alsobe
seenthat these tubes
which are produced are notnecessarily
rigid asthey
seem tobe
flexible
enough
to
wrap
arounddifferent
areas ofthe amorphous regions.These
results arein
good agreementwith
those
publishedby
Wan,
etal.[3]
It
is
important
to
compareto the
original paper
in
determining
the
guidelinesfor
characterization.This is
to
preventdissention
among
different
labs
asto
whether or nottubes
were established.This study
has
been
consistent withthe
original means ofcharacterization as wellas some additional [image:38.548.59.453.102.379.2]means
in
ordertobe
careful and consistent.Figure 12. SEMimageof4:1emulsifier/monomer chemical reaction product.
3.2 Electrochemical Template-Free Synthesis
ofPolyaniline Nanotubes
These
results combinedled
usto
believe
that
wehad successfully
synthesizedpolyaniline nanotubes
in
ourlaboratory.
This
then provided us withboth
a standardto
compare new material
to
as well as astepping
pointfor
pursuing
moreinnovative
research
concerning
polyaniline nanotube synthesis.Electropolymerization
ofpoly
aniline
is
thought to
occurby
Scheme
2,
shownbelow.
In
this
depiction,
the polymerization mechanismis identical
to that
ofchemically
initiated
polymerization,
the
only
difference
being
the
source ofthe
initiating
radical.This
led
ustothetheorization
that sincethe
two
initiation
methods weremechanistically
identical,
they
shouldboth be
applicableto
polyaniline nanotubeformation.
ne
\
/
-NH,\ /
-NHo=s=o
6"
\fT\
//
-N-H
o
n
Scheme 2. Electropolymerizationof polyaniline. Inthisscheme,
2-naphthalenesulfonic
acidis
used asdopantcounterion andthequinoid
form
oftherepeat structureisshownby
thepositive charge on nitrogen.We
therefore
set outto
synthesize polyaniline nanotubesby
electrode-basedinitiation
in
an emulsified environment.
3.2.1
Cyclic
Voltammetry
Cyclic
voltammetry
was usedto
polymerizedistilled
aniline monomerin
emulsion medium on a
Pt
plate electrode.A
control was alsorunin
whichno emulsifierwas present.
It
canbe
seenin Figure
13
that a cathodic peak was present atapproximately 700
mVindicating
that
reduction ofanline monomer occurred whenthereactionwas run
in
0. 1 N
H3PO4
medium.The
film
producedby
this
method wasthen
washed and characterizedby
cyclicvoltammetry.
The
film
wasimmersed
in
new0. 1 N
H2SO4
andthe
potential sweptfrom
0-1200
mV at10
mV/s.The
controlfor
this
experiment(electrochemically
synthesizedpolyaniline ona
Pt
plateelectrode) is
shownin
Figure 15
withthe
polyaniline nanotubefilm
shownin Figure 15.
There
aresome remarkabledifferences
between
the two
films.
For
onething,
the anodic peak observedin Figure
14
whichis
characteristicfor
polyanline oxidationoccursat
500
mV.0E-04 5E-04 OE-04
5E-04 OE-04
5E-04 OE-04
OE-05
OE-tOO OE-05
CO Ol CTt
oooooooooooo
Potential (V)
Figure 13. Electrochemical synthesis of polyaniline nanotubes. Cyclic voltammetrycurve foraniline
reductionin 0.1 N
H3P04
medium.Polyaniline
Synthesis
in
H2SO4
o> c o> c> 0000 <3> CD CD o
Potential
(V)
Figure 14. Cyclic
voltammetry
curve for a polyaniline film. Film characterizationfor
electro-polymerizedamorphouspolyanilineon aPtplate electrode.
In
the
nanotubefilm,
there
areclearly
twodistinct
peaksin
the
first
sweep
(blue),
one at450
mV and one at840
mV.These
decay
to
form
one peakin
sweep 2
(red)
at530
mVwhich
is
almostidentical
to that
of amorphous electropolymerizedpolyanilinefilms.
It
was
therefore
our observationthat
Polyaniline
Nanotubes Repeat Scans
1. 5E-05
1.OE-05
Q
5. OE-06 0. 0E+00-5.OE-06
<d -1.OE-05
-1.5E-05
-g
-2.OE-05 -2.5E-05 { -3.OE-05 1c^C3'^'--'^c^csicoco^-^LoirDcjDcjr^-c~-oococricr)
CD OOOCD OOOCD OOOO CDCDOCDOCDCDO
Potential
(V)
Figure 15. Cyclic voltammetry curve for a polyaniline nanotube fdm. Film characterization for
electropolymerized polyaniline nanotubes on aPtplate electrode.
the
product ofthe
electropolymerized emulsion reaction(polyaniline
nanotubes) has
another
energy
barrier
in
additionto
that
oftraditional
polyanilineto
oxidation.Conformational
restrictionprovidesanexplanation asto
why
this
couldbe
evident andit
was
indeed
seenthat
notubes
were present after onesweep
to
1200
mV potential.This
provides
further
supportto the
idea
that
conformational restrictionis
the
reasonfor
nanotube
formation
ratherthan
crystallization.It
can alsobe
ruled outthatthe
additionalpeak
is
due
to
aniline monomerinitiation.
This
is because
the
initiation
peak(700
mV)
andtheunknown peak
(900 mV)
are atdifferent
potentials.3.2.2
UV-Visible
Spectroscopy
The
spectra of our earlierprepared polyaniline nanotubes(Figures 5
and6)
wereused
to
compare ournewly
electropolymerized materialto.
It
wasnecessary
to
conductthis
synthesis onindium-tin
oxide enriched plastic so asto
have
atransparent
mediumto
coat
during
electropolymerizationfor
later
UV-Vis
characterization.Polyaniline
nanotube
film
was again producedin 0.1 N
H3PO4
medium.The film
produced waswashed and allowed
to
dry
for
24
hours
priorto
spectral characterization.This
spectrumis
shownin
Figure 16 (spectra
of amorphous polymer wereidentical
to
spectrafor
nanotubes so
they
were omitted).When comparing Figures 5
and6
to
Figure
16,
it
canbe
seenthat the
peaks at440
nm and
880
nm are conservedindicating
aconducting,
ordoped,
state.This
spectrumshows a more stable
doped
statethan that
ofthe
chemically
produced polyanilinenanotubes
in
that there
is
no peak present at600
nm.This
peakis indicative
of excitonformation
andis generally
regarded asbeing
less
conductive thanthe
presence of abi
polaronwhich gives
rise
to the
peak atapproximatrly 900 nm.[12]
Therefore,
it
canbe
concluded
that
electrochemically
produced polyaniline nanotubesmay
be
better
candidates
for
electronics applicationsdue
to their
more stable conductive state.UV-
Visible Absorption Spectrum
of
Polyaniline
Nanotube Film
323 373 423 473 523 573 623 673 723 773 823 873 923 973
Wavelength
(nm)
Figure 16. Visible spectroscopy of
electrochemically
produced polyaniline nanotubes. UV-Visiblespectrum of polyaniline nanotubefilmproduced
by
electropolymerization.3.2.3 Diffuse-Reflectance FTIR
The
samefilm
usedfor UV-Vis
qualification was usedfor FTIR
analysis.The
results of
the
electrochemically
produced polyaniline nanotubefilm
characterization areshown
in Figure 17.
Again,
Figure 17
shows starksimilarity
to
Figure 7 (the chemically
producedpolyanilinenanotube
film)
(again,
amorphous polymer spectra wereidentical
to
spectra
for
nanotubes sothey
were omitted).Diffuse
Reflectance Fourier-Transform
Infrared
Absorption
ofPolyaniline
Nanotubes
Wavenumber
(cm")
[image:44.548.72.478.135.348.2]3600 2100 1600
Figure 17. FTIRanalysis ofelectrochemically produced polyaniline nanotubes. Diffuse-reflectance
FTIRcharacterizationofelectrochemicallyproduced polyaniline nanotube
film.
3.2.4 Optical
Microscopy
Films for both
amorphous polyaniline andfor
polyaniline nanotubes were thenexamined
by
optical microscopy.Figure
18
shows an amorphous polyanilinefilm
produced on a
Pt
plate electrode.There
is
no evidence of tubuleformation in
this
micrograph.
The
film
appeared ubiquitous and was wellformed.
Figure 19
showsthe
polyaniline nanotubefilm
producedon aPt
plate electrode.The
absence ofnanotubesin
the
amorphousfilm,
Figure
1
8,
was commonto the
entirefilm
andconversely,
the
presence of nanotubes shownin
Figure
19
was alsorepresentative of
the
entire plate.The
tubules
in
this
micrograph canbe
observed tocluster
to
an extent.This
was also observed overthe
rest ofthe
plate.One
reasonfor
this
could
be from
reorganization ofthe
surfactanttemplate
particlesin
responseto the
[image:45.548.60.419.127.420.2]application of current at
the
plate surface.Figure 18. Amorphouspolyanilineelectrochemically deposited. Ptplate electrode.
The
film
produced onthe
ITO-enriched
plasticis
shownin Figure 20.
This
film
also shows visual evidence ofpolyaniline nanotubes.
The
tubes
produced onthe
ITO
plate electrode were more well
formed
for
the
most part thanthey
wereusing
the
platinum plate electrode.
One
reasonfor
this
was proposedthat
theplastic nature ofthe
electrode
(ITO
coatedplastic) may have
helped
facilitate
the
polymer particlesattaching
to
the plate andremaining
there
whereasthe
metal platinumis
slightly higher
surfaceenergy
andtherefore
moredifficult
to
adhereto.
Figure 19. Polyanilinenanotubefilm
electrochemically
produced. Ptplate electrode.Figure20. Polyanilinenanotubefilm electrochemicallyproduced. ITO-enrichedplastic electrode.
[image:46.548.62.420.354.620.2]Figure 21. Polyanilinenanotubefdm produced on ITO-enrichedplastic. Edge-onview.
Interestingly,
it
was noted that nanotube growth occurred most often at theelectrode edges asshown
in Figure 21
for
theITO
electrode.3.3
Polyaniline
Nanotube
Mediated
Conversion
ofAniline
to
Azobenzene
Next,
we
![Figure 3. Arc-discharge apparatus for synthesis of carbon nanotubes.[25]](https://thumb-us.123doks.com/thumbv2/123dok_us/122711.11895/22.547.60.231.363.520/figure-arc-discharge-apparatus-synthesis-carbon-nanotubes.webp)