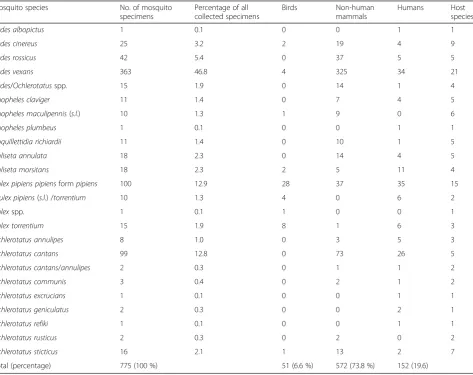
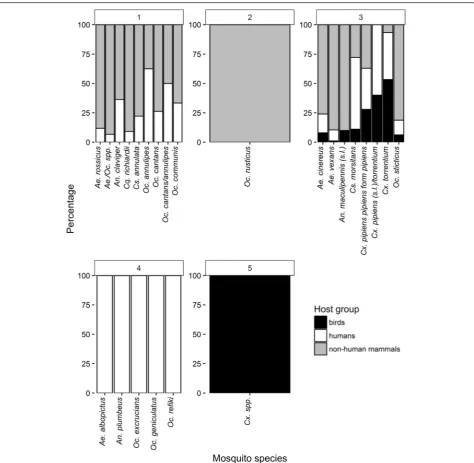
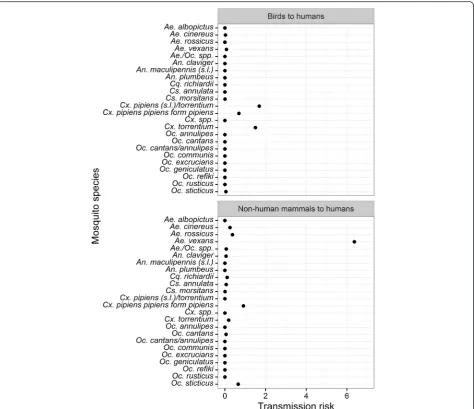
Host feeding patterns of mosquito species in Germany
Full text
Figure


Related documents
Evaluation plots for MAgPIE 4 inputs and outputs for the default settings, a run with soil organic matter explicitly modeled, a run with an alternative factor requirement setup
For the first time in the history of the College the number of women students has been sufficient for us to take an active part in social activities. The first
None of the BAL studies have reported genotyping of the SP-D gene; however, a large replication genetic Figure 2 Bronchoalveolar lavage fluid SP-D levels corrected for dilution
Different from point and line data, 2D and 3D data field have the characteristics of large data amount and complex structure. Therefore, quality check and integration methods
In the current research, chitosan was prepared and used as a template to improve dyeability of cotton fabric by laccase catalysis of hydroquinone because of the strong affinity
Beyond the blog’s immediately apparent ‘mood’— C.’s preference for a refined aesthetic, with its tendencies towards natural poignancy, literary embellishments and careful use
Our work is partly inspired by ( Yang et al. , 2018 ) for relevant emotion ranking, but with the following significant differences: (1) our model incorporates corpus-level
South Africa is a large country with a diverse climate. 1a and b are maps of the regional basic 3-s gust and the maximum hourly mean wind speeds included in the loading code. 1a and b


