Measuring progress and projecting attainment on the
basis of past trends of the health-related Sustainable
Development Goals in 188 countries: an analysis from the
Global Burden of Disease Study 2016
GBD 2016 SDG Collaborators*
Summary
Background
The UN’s Sustainable Development Goals (SDGs) are grounded in the global ambition of “leaving no
one behind”. Understanding today’s gains and gaps for the health-related SDGs is essential for decision makers as
they aim to improve the health of populations. As part of the Global Burden of Diseases, Injuries, and Risk Factors
Study 2016 (GBD 2016), we measured 37 of the 50 health-related SDG indicators over the period 1990–2016 for
188 countries, and then on the basis of these past trends, we projected indicators to 2030.
Methods
We used standardised GBD 2016 methods to measure 37 health-related indicators from 1990 to 2016, an
increase of four indicators since GBD 2015. We substantially revised the universal health coverage (UHC) measure,
which focuses on coverage of essential health services, to also represent personal health-care access and quality for
several non-communicable diseases. We transformed each indicator on a scale of 0–100, with 0 as the 2·5th percentile
estimated between 1990 and 2030, and 100 as the 97·5th percentile during that time. An index representing all
37 health-related SDG indicators was constructed by taking the geometric mean of scaled indicators by target. On the
basis of past trends, we produced projections of indicator values, using a weighted average of the indicator and
country-specific annualised rates of change from 1990 to 2016 with weights for each annual rate of change based on
out-of-sample validity. 24 of the currently measured health-related SDG indicators have defined SDG targets, against
which we assessed attainment.
Findings
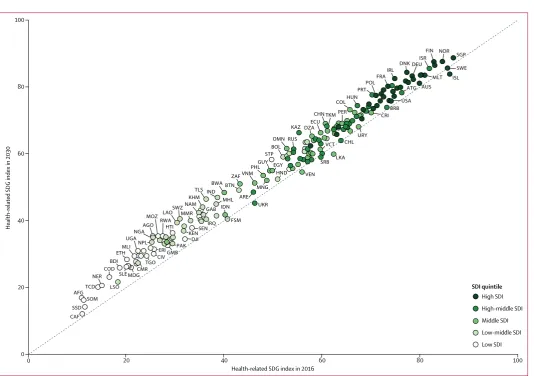
Globally, the median health-related SDG index was 56·7 (IQR 31·9–66·8) in 2016 and country-level
performance markedly varied, with Singapore (86·8, 95% uncertainty interval 84·6–88·9), Iceland (86·0,
84·1–87·6), and Sweden (85·6, 81·8–87·8) having the highest levels in 2016 and Afghanistan (10·9, 9·6–11·9), the
Central African Republic (11·0, 8·8–13·8), and Somalia (11·3, 9·5–13·1) recording the lowest. Between 2000
and 2016, notable improvements in the UHC index were achieved by several countries, including Cambodia,
Rwanda, Equatorial Guinea, Laos, Turkey, and China; however, a number of countries, such as Lesotho and the
Central African Republic, but also high-income countries, such as the USA, showed minimal gains. Based on
projections of past trends, the median number of SDG targets attained in 2030 was five (IQR 2–8) of the 24 defined
targets currently measured. Globally, projected target attainment considerably varied by SDG indicator, ranging
from more than 60% of countries projected to reach targets for under-5 mortality, neonatal mortality, maternal
mortality ratio, and malaria, to less than 5% of countries projected to achieve targets linked to 11 indicator targets,
including those for childhood overweight, tuberculosis, and road injury mortality. For several of the health-related
SDGs, meeting defined targets hinges upon substantially faster progress than what most countries have achieved
in the past.
Interpretation
GBD 2016 provides an updated and expanded evidence base on where the world currently stands in
terms of the health-related SDGs. Our improved measure of UHC offers a basis to monitor the expansion of health
services necessary to meet the SDGs. Based on past rates of progress, many places are facing challenges in meeting
defined health-related SDG targets, particularly among countries that are the worst off. In view of the early stages of
SDG implementation, however, opportunity remains to take actions to accelerate progress, as shown by the catalytic
effects of adopting the Millennium Development Goals after 2000. With the SDGs’ broader, bolder development
agenda, multisectoral commitments and investments are vital to make the health-related SDGs within reach of all
populations.
Funding
Bill & Melinda Gates Foundation.
Copyright
The Authors. Published by Elsevier Ltd. This is an Open Access article published under the CC BY 4.0
license.
Introduction
“Leaving no one behind” is the cornerstone of the
Sustainable Development Goals (SDGs), the international
development agenda formally adopted by the UN and its
member states in September, 2015.
1To deliver on this
aim, it is essential to measure where advances have
been achieved—and where challenges or new threats are
occurring—through routinely updated, comparable
monitoring and evaluation.
2,3After the SDGs’s adoption,
debate continued around the SDG indicator framework,
imple mentation, and monitoring,
4which ultimately led to
an open call for revision proposals overseen by the
Inter-Agency and Expert Group on Sustainable Development
Goal Indicators (IAEG-SDGs) in 2016. In March, 2017, the
UN Statistical Commission agreed on several indicator
revisions and established formal mechanisms for ongoing
indicator refinement and additions.
5At this time,
232 individual SDG indicators are included in the global
SDG indicator framework,
5aligned with the original
17 goals and 169 targets. 50 health-related indicators
(ie, indicators that directly involve health services, health
outcomes, and risk factors with well established causal
connections to health) exist within 29 health-related targets
and 11 goals, including SDG 3, which aims to “ensure
healthy lives and promote wellbeing for all at all ages”.
As part of the Global Burden of Diseases, Injuries, and
Risk Factors Study 2015 (GBD 2015),
6we generated a
baseline assessment for 33 health-related SDG indicators,
producing an overall summary indicator (the
health-related SDG index), and examined historical trends for
the overall index and individual indicators for
188 countries from 1990 to 2015. Other efforts have also
sought to measure the health-related SDGs across
countries, including assessments by the WHO,
7,8the
Sustainable Development Solutions Network (SDSN),
9,10and the World Bank;
11however, they experience
Research in context
Evidence before this study
Since the establishment of the Sustainable Development Goals
(SDGs) in September, 2015, an increasing number of global
efforts have sought to measure levels and progress in achieving
the health-related SDGs. International agencies such as WHO
currently report on a subset of the 50 health-related SDG
indicators, but inconsistencies in the years reported and
countries represented for each SDG indicator provide an
incomplete understanding of health priorities in the SDG era.
Drawing on the Global Burden of Diseases, Injuries, and Risk
Factors Study 2015 (GBD 2015), we measured 33 health-related
indicators and an overall health-related SDG index for
188 countries from 1990 to 2015. A number of indicators were
not included in this baseline assessment, and some indicators
such as universal health coverage (UHC; SDG indicator 3.8.1)
had substantial measurement limitations. Demand for initial
projections of SDG achievement in 2030, based on past trends,
has increased as national and global institutions alike aim to
solidify actionable strategies and concrete policy agendas. To
date, however, no studies have produced projections across
health-related SDG indicators and locations.
Added value of this study
Based on work by more than 2500 collaborators from more
than 135 countries and territories, GBD 2016 provides an
independent and systematic assessment of 37 of the
50 health-related indicators. This represents an increase of
four indicators since GBD 2015: vaccine coverage for targeted
populations by vaccines in national programmes
(SDG indicator 3.b.1); two violence indicators (prevalence of
physical or sexual violence [SDG indicator 16.1.3] and
childhood sexual abuse [SDG indicator 16.2.3]); and
well-certified death registration (SDG indicator 17.19.2c). For the
UHC index (SDG indicator 3.8.1), to better represent a full
range of essential health services, we combined
risk-standardised mortality rates from 32 causes from which
death should not occur in the presence of high-quality health
care with estimates of nine types of intervention coverage for
infectious diseases and maternal and child health outcomes.
Based on past trends measured from 1990 to 2016, this study
provides projections of each health-related indicator
through 2030 and an assessment of attainment against
defined SDG targets.
Implications of all available evidence
Country-level performance for the health-related SDG index
varied greatly in 2016, emphasising health inequalities by
location and levels of sociodemographic development.
Our improved measure of UHC showed a divide across the
sociodemographic spectrum, which might be associated with
major differences in access to high-quality health services
focused on non-communicable diseases and complex
conditions in higher-income countries. Nonetheless,
considerable progress occurred for many countries on the UHC
index between 2000 and 2016, especially in Cambodia,
Rwanda, Equatorial Guinea, Laos, Turkey, and China. Based on
projections of past trends, meeting a subset of established SDG
targets by 2030 might be possible for some areas of the world,
with more than 60% of countries projected to meet targets on
under-5 mortality, neonatal mortality, maternal mortality ratio,
and malaria. At the same time, on the basis of past trends,
much of western and central sub-Saharan Africa was projected
to attain very few—if any—defined targets in 2030.
limitations in terms of the years covered and countries
included for each indicator. By contrast, the GBD study
uses highly standardised analytical approaches to
produce comprehensive and comparable estimates
across countries and over time. A collaboration of more
than 2500 global health researchers and experts from
more than 135 countries and territories enables GBD to
incorporate the latest data, reflect regional and local
knowledge, and to facilitate policy translation at local
levels. Additionally, established mechanisms, including a
Scientific Council and Independent Advisory
Committee,
12ensure scientific rigour and independence
from undue political influence.
A key component of the health-related SDGs is universal
health coverage (UHC).
13–18SDG target 3.8 explicitly
highlights the importance of UHC, aiming to “achieve
universal health coverage, including financial risk
protection, access to quality essential health-care services
and access to safe, effective, quality, and affordable
essential medicines and vaccines for all”.
5SDG
indicator 3.8.1 focuses on coverage of essential health
services, capturing the role of health systems in delivering
effective interventions to improve a wide range of health
outcomes. On the basis of GBD 2015 results, we developed
a proxy measure of UHC based on the coverage of
maternal, child, and selected communicable disease
interventions.
6WHO has proposed a similar proxy UHC
measure,
7,19although the WHO UHC indicator also seeks
to incorporate the absence of selected risk factors at the
population level (eg, blood pressure, cholesterol, and
smoking). However, measures of risk exposure might not
optimally capture access to high-quality health care or
broader health system functioning; rather, they might
represent behavioural, cultural, or environmental
determinants (eg, diet, air pollution) that are less directly
addressed by health systems. Consid erable opportunity
exists to improve current UHC measures by combining
more traditional measures of intervention coverage with
analyses of amenable mortality, such as those used in the
Healthcare Access and Quality (HAQ) Index;
20this would
allow the incorporation of a broader set of health services
as well as reflect both access to and quality of care.
Understanding of how past rates of progress translate
into future trajectories for the SDGs is an important input
for decision makers, particularly during these initial years
of SDG policy development and imple mentation.
Health-related SDG targets and their corresponding indicators
represent a substantially broader range of health needs
than those represented in the Millennium Development
Goals (MDGs), which primarily concentrated on maternal
and child health outcomes and infectious diseases;
21furthermore, the SDGs are meant to apply to all countries,
irrespective of their development status, whereas the
MDGs were viewed as lower priority or less applicable to
higher-income countries. Subsequently, it is crucial to
know where—and how much—progress needs to be
accelerated during the next years of SDG implementation
to reach stated targets. Selected studies have generated
projections based on past trends, but have generally
been restricted to specific SDG indicators (eg, under-5
mortality,
22maternal mortality,
23non-communicable
dis-ease [NCD] mortality,
24and met need for family planning
25)
or focused on individual countries and indicators
(eg, premature mortality from NCDs in Mexico
26and child
mortality in India
27). A comprehensive assessment of how
past progress could translate into SDG performance
in 2030 across health-related indicators is essential to help
global, regional, and national decision makers identify the
countries and areas of greatest need and align current and
future investment plans accordingly.
In this study, we provide updated estimates from 1990
to 2016 for each health-related SDG indicator and the
overall health-related SDG index. In doing so, we also
improve the measurement for several indicators, most
notably the UHC index (SDG indicator 3.8.1) by
incorporating components of the HAQ Index. We also
include four additional health-related indicators since
GBD 2015: vaccine coverage for targeted populations by
vaccines in national programmes (SDG indicator 3.b.1),
two violence indicators (prevalence of physical or sexual
violence [SDG indicator 16.1.3] and childhood sexual
abuse [SDG indicator 16.2.3]), and well-certified death
registration (SDG indicator 17.19.2c). Based on past
trends, we produce indicator-by-indicator projections for
188 countries from 2017 to 2030. It is important to note
that these projections are not intended to predict what
progress would be achieved as a result of the SDGs;
instead, these projections are meant to shed light on
potential gaps and gains on the health-related SDGs
by 2030, and where countries are likely to be, based on
past progress, in relation to defined SDG targets.
Methods
Overview of GBD
This analysis of the health-related SDGs is based on the
GBD study, which measures the health of populations on
an annual basis. GBD produces age-specific, sex-specific,
and country-specific estimates (including selected
sub-national units) of cause-specific mortality and mor bidity,
risk factor exposure, mortality and morbidity attrib utable
to these risks, and a range of health system characteristics,
from 1990 to the most recent year. Various summary
measures are computed, including disability-adjusted
life-years (DALYs) and healthy life expectancy. GBD uses
highly standardised and validated approaches applied to
all available data sources adjusted for major sources of
bias. Further details on GBD 2016, which covers
1990–2016, are available elsewhere.
28–32GBD 2016 study and this analysis comply with the
Guidelines for Accurate and Transparent Health
Estimates Reporting (GATHER).
33Further detail on the
estimation and data sources used for all indicators are
available in appendix 1.
Indicators, definitions, and measurement approach
In this updated analysis we cover 37 of 50 health-related
SDG indicators (table). Additional details on data and
methods for estimating each indicator are in appendix 1.
Appendix 2 outlines the 13 indicators not presently
measured (pp 10–12). The addition of new causes, risks,
and health indicators are considered by the GBD Scientific
Council for each annual cycle of the GBD. For GBD 2016,
four health-related SDG indicators were added: vaccine
coverage (SDG indi cator 3.b.1); two violence indicators
(prevalence of physical or sexual violence [SDG
indi
cator 16.1.3] and childhood sexual abuse [SDG
indi
cator 16.2.3]); and well-certified death registration
(SDG indi cator 17.19.2c).
Vaccine coverage (SDG indi
cator 3.b.1), defined as
“proportion of the target population covered by all
vaccines included in their national programme”, became
a separate indicator as part of the March, 2017, revision to
the SDG framework.
5We report on this indicator by using
the geometric mean of the coverage of three-dose
diphtheria, pertussis, and tetanus (DPT3); three-dose
polio; first-dose measles vaccine; and for countries where
the vaccine(s) are included in the national schedule:
BCG vaccine, three-dose pneumococcal conjugate vaccine
(PCV3), three-dose Haemophilus influenzae type b
vaccine (Hib3), three-dose hepatitis B vaccine (delivered
as part of pentavalent vaccines), and two-dose or
three-dose rotavirus vaccine. To account for the scale-up period
for newly introduced vaccines, we include new vaccines
in the geometric mean only 3 years after the introduction
year in each country.
We also added two violence indicators in GBD 2016:
age-standardised prevalence of physical or sexual violence
experienced by populations in the last 12 months (SDG
indi
cator 16.1.3) and age-standardised prevalence of
women and men aged 18–29 years who experienced sexual
violence by age 18 years (SDG indi cator 16.2.3). The UN
definition for SDG indi cator 16.1.3 includes psychological
violence, but due to limited data availability and highly
variable definitions of self-reported psychological violence,
we restricted this measurement to physical and sexual
violence.
As part of GBD 2016, we developed a data quality measure
to reflect the proportion of well-certified deaths by a vital
registration (VR) system among a country’s total population,
which corresponds with the third comp onent of 17.19.2
(referred to as SDG indicator 17.19.2c). Well-certified deaths
were determined by three measures: (1) completeness of
death registration; (2) fraction of deaths not assigned to
major garbage codes (ie, causes that cannot or should not
be underlying causes of death); and (3) fraction of deaths
assigned to detailed GBD causes. More detail on this
measure can be found elsewhere
29and in appendix 1.
We also refined the measurement of several
previously included health-related indicators. First, SDG
indi
cator 16.1.2 (conflict mortality) now exclusively
focuses on deaths due to conflict and terrorism. Second,
we revised the exposure period from lifetime to
12 months for SDG indicator 5.2.1 (intimate partner
violence) to match the UN SDG definition. Third, we
limited our measurement of SDG indicator 6.2.1b
(hygiene) to access to a handwashing facility, which also
aligns more directly with the UN SDG target. Fourth, we
extended the measurement of SDG indicator 3.8.1
(coverage of essential health services, or UHC tracer
interventions) to include the individual components of
the HAQ Index,
20which is based on risk-standardised
death rates from 32 causes amenable to personal health
care.
34,35This revised approach expands the range of
potential health services, particularly those for NCDs,
captured by this summary measure. The previous UHC
tracer indicator included only maternal and child health
and selected infectious disease inter ventions (malaria,
HIV, and tuberculosis).
6Last, a subset of indicators have
undergone substantial revision due to data
improve-ments, methodological improveimprove-ments, or both,
imple-mented in GBD 2016, including alcohol consumption
and child growth failure (ie, under-5 stunting and
wasting). Further detail on these updates can be found in
appendix 1, as well as accompanying GBD 2016 papers.
28–32Projection of health-related SDG indicators to 2030
We projected the health-related SDG indicators on the
basis of past trends. We first calculated for each location
the annual rate of change between 1990 and 2016 for
each individual year in natural-log space or, for indicators
bounded between 0 and 1 (eg, intervention coverage,
percentage of population) in logit-space. We then
calculated the weighted median annualised rate of
change for each country using the following weighting
function:
The value of ω denotes how much weight is given to
recent years compared with past years when calculating
the median annualised rate of change. To determine the
appropriate value of ω for each SDG indicator, we did an
out-of-sample predictive validity test in which we held
out data for all countries from 2008 to 2016 and predicted
values for this time period using the data from
1990 to 2007. We tested values of ω ranging from 0 to 2 in
increments of 0·2 and chose the indicator-specific value
of ω that minimised the root mean squared error (RMSE)
in the held out data (2008–16). This was used to project
each indicator to 2030. Appendix 1 provides the indicator
specific values of ω used and further details on methods.
See Onlinefor appendix 1
weight
year=
(year – 1990)
ωΣ
t = 1991T(t – 1990)
ωFor HIV, we used an alternative approach. In many
countries, antiretroviral therapy (ART) coverage, through
large internal investments, substantial development
assistance via programmes such as the President’s
Emergency Plan for AIDS Relief (PEPFAR),
36and
reductions in drug prices, has been scaled up considerably.
If past trends are used to project future coverage, many
countries would be projected to achieve 100% coverage
by 2030. This ignores health system constraints in scaling
up ART. For ART coverage, our projections were a
function of projected ART price based on data from the
Global Price Reporting Mechanism (GPRM),
37projected
government health expenditure as source,
38and projected
development assistance for health (DAH) for HIV or
AIDS.
38We bounded ART projections with an ART
coverage frontier produced on the basis of income per
capita to reflect health system constraints. We then used
projected ART coverage to project HIV incidence hazard
and HIV incidence using Spectrum.
39Further detail on
this method is in appendix 1.
Health-related SDG indices, health-related MDG indices,
and health-related non-MDG indices
As in GBD 2015, we developed an overall health-related
SDG index that is a function of the 37 health-related
SDG indicators (referred to as the health-related SDG
Health-related
SDG indicator Definition used in this analysis Further details SDG target SDG target used in
this analysis
Inclusion in MDG or non-MDG index Goal 1: End poverty in all its forms everywhere
Target 1.5: By 2030, build the resilience of the poor and those in vulnerable situations and reduce their exposure and
vulnerability to climate-related extreme events and other economic, social, and environmental shocks, and disasters
Disaster mortality (1.5.1; same as indicators 11.5.1 and 13.1.1)
Death rate due to exposure to forces of nature (per 100 000 population)
Existing datasets do not comprehensively measure missing persons and people affected by natural disasters; we thus report on deaths due to exposure to forces of nature.
Undefined ·· Non-MDG
Goal 2: End hunger, achieve food security and improved nutrition, and promote sustainable agriculture
Target 2.2: By 2030, end all forms of malnutrition, including achieving, by 2025, the internationally agreed targets on stunting and wasting in children younger than 5 years of age, and address the nutritional needs of adolescent girls, pregnant and lactating women, and older people
Child stunting
(2.2.1) Prevalence of stunting in children younger than 5 years, %
Stunting is defined as below –2 SDs from the median height-for-age of the WHO reference population. No indicator modifications are required.
Eliminate
by 2030 ≤0·5% MDG
Target 2.2 (as above) Child wasting
(2.2.2a) Prevalence of wasting in children younger than 5 years, %
We have separated reporting for indicator 2.2.2 into wasting (2.2.2a) and overweight (2.2.2b). Wasting is defined as below –2 SDs from the median weight-for-height of the WHO reference population.
Eliminate
by 2030 ≤0·5% MDG
Target 2.2 (as above) Child overweight
(2.2.2b) Prevalence of overweight in children aged 2–4 years, % We used the IOTF thresholds because the WHO cutoff at age 5 years can lead to an artificial shift in prevalence estimates when the analysis covers more age groups. Furthermore, considerably more studies use IOTF cutoffs, which allowed us to build a larger database for estimating child overweight.
Eliminate
by 2030 ≤0·5% Non-MDG
Goal 3: Ensure healthy lives and promote wellbeing for all at all ages
Target 3.1: By 2030, reduce the global maternal mortality ratio to less than 70 per 100 000 livebirths
Maternal mortality ratio (3.1.1)
Maternal deaths per 100 000 livebirths in women aged 10–54 years
No indicator modifications required Reduce to <70 deaths per 100 000 livebirths by 2030
<70 deaths per 100 000 livebirths
MDG
Target 3.1 (as above) Skilled birth attendance (3.1.2)
Proportion of births attended by skilled health personnel (doctors, nurses, midwives, or
country-specific medical staff [eg, clinical officers]), %
No indicator modifications required Universal access (100%)
≥99% MDG
Target 3.2: By 2030, end preventable deaths of newborns and children younger than 5 years of age, with all countries aiming to reduce neonatal mortality to at least as low as 12 per 1000 livebirths and under-5 mortality to at least as low as 25 per 1000 livebirths
Under-5
mortality (3.2.1) Probability of dying before the age of 5 years per 1000 livebirths
No indicator modifications required Reduce to 25 deaths per 1000 livebirths or lower by 2030
≤25 deaths per 1000 livebirths
MDG
Health-related
SDG indicator Definition used in this analysis Further details SDG target SDG target used in
this analysis
Inclusion in MDG or non-MDG index
(Continued from previous page)
Target 3.2 (as above) Neonatal
mortality (3.2.2) Probability of dying during the first 28 days of life per 1000 livebirths
No indicator modifications required Reduce to 12 deaths per 1000 livebirths or lower by 2030
≤12 deaths per 1000 livebirths
MDG
Target 3.3: By 2030, end the epidemics of AIDS, tuberculosis, malaria, and neglected tropical diseases and combat hepatitis, water-borne diseases, and other communicable diseases
HIV incidence
(3.3.1) Age-standardised rate of new HIV infections per 1000 population
We report HIV incidence of all populations and in terms
of age-standardised rates Eliminate by 2030 ≤0·005 per 1000 population
MDG
Target 3.3 (as above) Tuberculosis
incidence (3.3.2) Age-standardised rate of tuberculosis cases per 100 000 population
No indicator modifications required Eliminate
by 2030 ≤0·5 per 100 000 population
MDG
Target 3.3 (as above) Malaria
incidence (3.3.3) Age-standardised rate of malaria cases per 1000 population
No indicator modifications required Eliminate
by 2030 ≤0·005 per 1000 population
MDG
Target 3.3 (as above) Hepatitis B
incidence (3.3.4) Age-standardised rate of hepatitis B incidence per 100 000 population
No indicator modifications required Undefined ·· Non-MDG
Target 3.3 (as above) Prevalence of 15 neglected tropical diseases (3.3.5)
Age-standardised prevalence of the sum of 15 neglected tropical diseases, %
People requiring interventions against neglected tropical diseases is not well defined; thus this indicator is revised to the sum of the prevalence of 15 neglected tropical diseases currently measured in the GBD study: African trypanosomiasis, Chagas disease, cystic echinococcosis, cysticerosis, dengue, food-borne trematodiases, Guinea worm, intestinal nematode infections, leishmaniasis, leprosy, lymphatic filariasis, onchocerciasis, rabies, schistosomiasis, and trachoma.
Eliminate
by 2030 ≤0·5% Non-MDG
Target 3.4: By 2030, reduce by one-third premature mortality from NCDs through prevention and treatment and promote mental health and wellbeing
Mortality due to a subset of NCDs (3.4·1)
Age-standardised death rate due to cardiovascular disease, cancer, diabetes, and chronic respiratory disease in populations aged 30–70 years per 100 000 population
No indicator modifications required Reduce by one-third by 2030
Reduce by
one-third Non-MDG
Target 3.4 (as above) Suicide mortality
(3.4.2) Age-standardised death rate due to self-harm per 100 000 population
No indicator modifications required Reduce by one-third by 2030
Reduce by
one-third Non-MDG
Target 3.5: Strengthen the prevention and treatment of substance abuse, including narcotic drug abuse and harmful use of alcohol
Alcohol use
(3.5.2) Risk-weighted prevalence of alcohol consumption, as measured by the SEV for alcohol use, %
For this indicator, we include three categories of alcohol consumption because national alcohol consumption per capita does not capture the distribution of use. The SEV for alcohol use is based on two primary dimensions: individual-level drinking (current drinkers and lifetime abstainers, and alcohol consumption by age and sex) and population-level consumption (L per capita of pure alcohol stock). The SEV then weights these categories with their corresponding relative risks, which translate to risk-weighted prevalences on a scale of 0% (no risk in the population) to 100% (the entire population experiences maximum risk associated with alcohol consumption).
Undefined ·· Non-MDG
Target 3.6: By 2020, halve the number of global deaths and injuries from road traffic accidents
Road injury
mortality (3.6.1) Age-standardised death rate due to road injuries per 100 000 population
No indicator modifications required Reduce by one-half by 2020
Reduce
by 50% Non-MDG
Target 3·7: By 2030, ensure universal access to sexual and reproductive health-care services, including for family planning, information and education, and the integration of reproductive health into national strategies and programmes
Family planning need met, modern contraception methods (3.7.1)
Proportion of women of reproductive age (15–49 years) who have their need for family planning satisfied with modern methods, %
No indicator modifications required Universal access (100%)
≥99% MDG
Health-related
SDG indicator Definition used in this analysis Further details SDG target SDG target used in
this analysis
Inclusion in MDG or non-MDG index
(Continued from previous page)
Target 3.7 (as above) Adolescent birth
rate (3.7.2) Number of livebirths per 1000 women aged 10–14 years and women aged 15–19 years
No indicator modifications required Undefined ·· MDG
Target 3.8: Achieve universal health coverage, including financial risk protection, access to quality essential health-care services, and access to safe, effective, quality, and affordable essential medicines and vaccines for all
Universal health coverage index (3.8.1)
Coverage of essential health services, as defined by a universal health coverage index of the coverage of nine tracer interventions and risk-standardised death rates from 32 causes amenable to personal health care
Tracer interventions included vaccination coverage (coverage of three doses of diphtheria-pertussis-tetanus, measles vaccine, and three doses of the oral polio vaccine or inactivated polio vaccine); met need for modern contraception; antenatal care coverage (one or more visits and four or more visits); skilled birth attendence coverage; in-facility delivery rates; and coverage of antiretroviral therapy among people living with HIV. The 32 causes amenable to personal health care, which compose the HAQ Index, included tuberculosis, diarrhoeal diseases, lower respiratory infections, upper respiratory infections, diphtheria, whooping cough, tetanus, measles, maternal disorders, neonatal disorders, colon and rectum cancer, non-melanoma cancer, breast cancer, cervical cancer, uterine cancer, testicular cancer, Hodgkin’s lymphoma, leukaemia, rheumatic heart disease, ischaemic heart disease, cerebrovascular disease, hypertensive heart disease, peptic ulcer disease, appendicitis, hernia, gallbladder and biliary diseases, epilepsy, diabetes, chronic kidney disease, congenital heart anomalies, and adverse effects of medical treatment. We then scaled these 41 individual inputs on a scale of 0–100, with 0 reflecting the worst levels observed between 1990 and 2016 and 100 reflecting the best observed during this time. We took the arithmetic mean of these 41 scaled indicators so as to collectively capture a wide range of essential health services pertaining to reproductive, maternal, newborn, and child health; infectious diseases; NCDs; and service capacity and access.
Universal access (100%)
≥99% Non-MDG
Target 3.9: By 2030, substantially reduce the number of deaths and illnesses from hazardous chemicals and air, water, and soil pollution and contamination
Mortality attributable to air pollution (3.9.1)
Age-standardised death rate attributable to household air pollution and ambient air pollution, per 100 000 population
No indicator modifications required Undefined ·· Non-MDG
Target 3.9 (as above) Mortality attributable to WaSH (3.9.2)
Age-standardised death rate attributable to unsafe WaSH, per 100 000 population
No indicator modifications required Undefined ·· Non-MDG
Target 3.9 (as above) Poisoning
mortality (3.9.3) Age-standardised death rate due to unintentional poisonings,
per 100 000 population
No indicator modifications required Undefined ·· Non-MDG
Target 3.a: Strengthen the implementation of the WHO Framework Convention on Tobacco Control in all countries, as appropriate
Smoking prevalence (3.a.1)
Age-standardised prevalence of daily smoking in populations aged 10 years and older, %
We report daily smoking due to data limitations regarding the systematic measurement of current smoking and to reflect populations aged 10 years and older.
Undefined ·· Non-MDG
Target 3.b: Support the research and development of vaccines and medicines for the communicable and non-communicable diseases that primarily affect developing countries, provide access to affordable essential medicines and vaccines, in accordance with the Doha Declaration on the TRIPS Agreement and Public Health, which affirms the right of developing countries to use to the full the provisions in the Agreement on Trade-Related Aspects of Intellectual Property Rights regarding flexibilities to protect public health, and, in particular, provide access to medicines for all
Vaccine
coverage (3.b.1) Coverage of eight vaccines, conditional on inclusion in national vaccine schedules, in target populations, %
Vaccines included diphtheria-pertussis-tetanus (three doses), measles (one dose), BCG, polio vaccine (three doses), hepatitis B (three doses), Haemophilus
influenzae type b (three doses), pneumococcal conjugate
vaccine (three doses), and rotavirus vaccine (two or three doses). We then used the geometric mean of coverage of these eight vaccines, based on their inclusion in the national vaccine schedule, to compute overall vaccine coverage.
Coverage of all target populations (100%)
≥99% Non-MDG
Health-related
SDG indicator Definition used in this analysis Further details SDG target SDG target used in
this analysis
Inclusion in MDG or non-MDG index
(Continued from previous page)
Goal 5: Achieve gender equality and empower all women and girls
Target 5.2: Eliminate all forms of violence against all women and girls in the public and private spheres, including trafficking and sexual and other types of exploitation
Intimate partner
violence (5.2.1) Age-standardised prevalence of women aged 15 years and older who experienced physical or sexual violence by an intimate partner in the past 12 months, %
Data for exposure to subtypes of violence are not systematically available across locations and over time; we thus report on physical or sexual violence by an intimate partner.
Eliminate by
2030 ≤0·5% Non-MDG
Goal 6: Ensure availability and sustainable management of water and sanitation for all
Target 6.1: By 2030, achieve universal and equitable access to safe and affordable drinking water for all
Water (6.1·1) Risk-weighted prevalence of populations using unsafe or unimproved water sources, as measured by the SEV for unsafe water, %
Different types of unsafe water sources have correspondingly different relative risks associated with poor health outcomes; we thus report on the SEV for water, which captures the relative risk of different types of unsafe water sources and then combines them into a risk-weighted prevalence on a scale of 0% (no risk in the population) to 100% (the entire population experiences maximum risk associated with unsafe water).
Universal access to safe water (100%); 0% on the SEV for unsafe water
≤1% MDG
Target 6.2: By 2030, achieve access to adequate and equitable sanitation and hygiene for all and end open defecation, paying special attention to the needs of women and girls and those in vulnerable situations
Sanitation
(6.2·1a) Risk-weighted prevalence of populations using unsafe or unimproved sanitation, as measured by the SEV for unsafe sanitation, %
We have separated reporting for indicator 6.2.1 into sanitation (6.2.1a) and hygiene (6·2·1b). We had three mutually exclusive, collectively exhaustive categories for sanitation at the household level: households with piped sanitation (with a sewer connection); households with improved sanitation without a sewer connection (pit latrine, ventilated improved latrine, pit latrine with slab, composting toilet), as defined by the JMP; and households without improved sanitation (flush toilet that is not piped to sewer or septic tank, pit latrine without a slab or open pit, bucket, hanging toilet or hanging latrine, shared facilities, no facilities), as defined by the JMP.
Universal access to safe sanitation (100%); 0% on the SEV for unsafe sanitation
≤1% MDG
Target 6.2 (as above) Hygiene (6.2.1b) Risk-weighted prevalence of populations without access to a handwashing facility, as measured by the SEV for unsafe hygiene, %
We have separated reporting for indicator 6.2.1 into sanitation (6.2.1a) and hygiene (6.2.1b). Access to a handwashing facility was defined as having an observed handwashing station with soap and water available in the household.
Universal access to handwashing facility (100%); 0% on the SEV for hygiene
≤1% Non-MDG
Goal 7: Ensure access to affordable, reliable, sustainable, and modern energy for all
Target 7.1: By 2030, ensure universal access to affordable, reliable, and modern energy services
Household air
pollution (7.1.2) Risk-weighted prevalence of household air pollution, as measured by the SEV for household air pollution, %
Existing datasets do not comprehensively measure population use of clean fuels and technology for heating and lighting across geographies; we thus report on the exposure to clean (or unclean) fuels used for cooking.
Universal access to improved fuels (100%); 0% on the SEV for household air pollution
≤1% MDG
Goal 8: Promote sustained, inclusive, and sustainable economic growth, full and productive employment, and decent work for all
Target 8.8: Protect labour rights and promote safe and secure working environments for all workers, including migrant workers, in particular women migrants, and those in precarious employment
Disease burden attributable to occupational risks (8.8.1)
Age-standardised all-cause DALY rate attributable to occupational risks per 100 000 population
This indicator is reported as DALY rates attributable to occupational risks because DALYs combine measures of mortality and non-fatal outcomes into a singular summary measure, and occupational risks represent the full range of safety hazards that might be encountered in working environments.
Undefined ·· Non-MDG
Goal 11: Make cities and human settlements inclusive, safe, resilient, and sustainable
Target 11.5: By 2030, significantly reduce the number of deaths and the number of people affected and substantially decrease the direct economic losses relative to global gross domestic product caused by disasters, including water-related disasters, with a focus on protecting the poor and people in vulnerable situations
Disaster mortality (11.5.1; same as indicators 1.5.1 and 13.1.1)
Death rate due to exposure to forces of nature per 100 000 population
Existing datasets do not comprehensively measure missing persons and people affected by natural disasters; we thus report on deaths due to exposure to forces of nature.
Undefined ·· Non-MDG
index), an index reflecting the 14 SDG health-related
indicators previously included in the MDG monitoring
framework (referred to as the MDG index), and one
reflecting the 23 SDG health-related indicators not
included in the MDGs (referred to as the non-MDG
index).
A variety of approaches exist to create indices from
multidimensional data. As in GBD 2015,
6we adopted a
preference-weighted approach that weights each
indi-cator by expressed preferences for the relative importance
of different indicators. We interpret the SDG targets to
represent the expressed preferences of UN member
Health-relatedSDG indicator Definition used in this analysis Further details SDG target SDG target used in
this analysis
Inclusion in MDG or non-MDG index
(Continued from previous page) Target 11.6: By 2030, reduce the adverse per capita environmental impact of cities, including by paying special attention to air quality and municipal and other waste management
Mean PM2·5
(11.6.2) Population-weighted mean levels of PM2·5, μg/m³
No indicator modifications required Undefined ·· Non-MDG
Goal 13: Take urgent action to combat climate change and its impacts
Target 13.1: Strengthen resilience and adaptive capacity to climate-related hazards and natural disasters in all countries
Disaster mortality (13.1.1; same as indicators 1.5.1 and 11.5.1)
Death rate due to exposure to forces of nature (per 100 000 population)
Existing datasets do not comprehensively measure missing persons and persons affected by natural disasters; we thus report on deaths due to exposure to forces of nature.
Undefined ·· Non-MDG
Goal 16: Promote peaceful and inclusive societies for sustainable development, provide access to justice for all, and build effective, accountable, and inclusive institutions at all levels
Target 16.1: Significantly reduce all forms of violence and related death rates everywhere
Homicide
(16.1.1) Age-standardised death rate due to interpersonal violence
per 100 000 population
No indicator modifications required Undefined ·· Non-MDG
Target 16.1 (as above) Conflict and terrorism mortality (16.1·2)
Death rate due to conflict and terrorism per 100 000 population
No indicator modifications required Undefined ·· Non-MDG
Target 16.1 (as above) Violence prevalence (16.1.3)
Age-standardised prevalence of physical or sexual violence experienced by populations in the past 12 months, %
Data for exposure to psychological violence are not systematically available across locations and over time; we thus report on prevalence of physical or sexual violence.
Undefined ·· Non-MDG
Target 16.2: End abuse, exploitations, trafficking and all forms of violence against and torture of children
Childhood sexual abuse (16.2.3)
Age-standardised prevalence of women and men aged 18–29 years who experienced sexual violence by age 18 years, %
No indicator modifications required Eliminate
by 2030 ≤0·5% Non-MDG
Goal 17: Strengthen the means of implementation and revitalise the global partnership for sustainable development
Target 17.19: By 2030, build on existing initiatives to develop measurements of progress on sustainable development that complement gross domestic product, and support statistical capacity-building in developing countries
Well-certified death registration (17.19.2c)
Well-certified deaths by a vital registration system among a country’s total population, %
Indicator 17.19.2 involves three separate country-level components pertaining to demographic and health data collection and monitoring: status of conducting at least one population and housing census in the past 10 years; birth registration; and death registration. Although these data collection and monitoring systems are inter-connected, their actual status or functionality at a given time can vary. Subsequently, we have separated reporting on 17.19.2 into three indicators, and thus report death registration as 17.19.2c. Well-certified deaths were determined by three measures: completeness of death registration; fraction of deaths not assigned to major garbage codes (ie, causes that cannot or should not be underlying causes of death); and fraction of deaths assigned to detailed GBD causes.
80% of total
deaths ≥80% Non-MDG
Detailed descriptions of the data and methods used to estimate each health-related SDG indicator are in appendix 1. DALY=disability-adjusted life-year. GBD=Global Burden of Disease. HAQ Index=Healthcare Access and Quality Index. IOTF=International Obesity Task Force. JMP=Joint Monitoring Programme. MDG=Millennium Development Goal. NCDs=non-communicable diseases. SDG=Sustainable Development Goal. SEV=summary
exposure value. WaSH=water, sanitation, and hygiene. PM2·5=fine particulate matter smaller than 2.5 μm.
[image:9.595.45.562.115.621.2]states and thus assume that each SDG target should be
treated equally.
To combine indicators, we first transformed each
indicator on a scale from 0 to 100. Scaling indicator
values in this way allows comparisons to be made on the
relative performance on very different SDG indicators
and allows us to produce an overall health-related SDG
index by calculating an arithmetic or geometric mean of
the scaled values. For GBD 2016, we transformed each
health-related SDG indicator on a scale from 0 to 100, in
order from worst to best, with 0 being the 2·5th percentile
value observed over the time period 1990–2030
(ie, including projected values) and 100 the
97·5th percentile value observed during this time. This
was implemented in log-space for mortality and
incidence rates.
To estimate the health-related SDG index, we first
computed the geometric mean of each scaled
health-related SDG indicator for a given target, followed by the
geometric mean of resulting values across all SDG
targets (reflecting the preference-weighted approach
described above). The geometric mean allows indicators
with very high values to partly compensate for low values
on other indicators (referred to as partial sub stitutability).
To avoid problems with indicator values close to 0, when
computing indices we applied a floor of 1 to all indicators.
The same process was used to construct the MDG and
non-MDG indices. Results of sensitivity analyses based
on alternative approaches to create the SDG, MDG, and
non-MDG indices are detailed in appendix 1.
SDG indicator attainment
Of the 37 health-related indicators measured in
GBD 2016, 24 had defined targets, with 21 having
absolute targets to reach by 2030, and three featuring
targets relative to 2015 levels (ie, SDG target 3.4, “By 2030,
reduce by one third premature mortality from NCDs”).
For these 24 indicators, we applied these thresholds to
determine achievement by 2030 (or 2020, in the case of
road injury mortality [SDG indicator 3.6.1]). 17
health-related indicators had targets citing “achieving
elimination”, “ending epidemics”, or “reaching uni versal
coverage or access”. For these indicators we set target
thresholds as at least 99% for universal coverage or
access and achieving a rate of 0·000005 or less for
measures of morbidity (ie, ≤0·005 per 1000 or ≤0·5
per 100 000) and 0·5% for prevalence. The table details
the target thresholds or relative reductions applied for
each indicator with a defined target.
Because some of these elimination targets have been
operationalised in terms of reducing incidence or
prevalence by 2030,
40we applied a more conservative 80%
reduction threshold from 2015 to 2030 for indicators
with established elimination SDG targets and compared
these results. We also used a threshold of 90% or more
for indicators with universal coverage or access in this
conservative target attainment scenario.
41Comparing performance on the health-related SDGs
across the development spectrum
In addition to examining global patterns in SDG
performance, we report on differences in the
health-related SDG index and individual indicators across
levels of development. To do this, we use the
Socio-demographic Index (SDI), a summary measure of
overall development that was originally introduced as
part of GBD 2015.
30SDI is based on income per capita,
mean years of education among populations 15 years
and older, and total fertility rates, on a scale of 0 to 1.
We use the SDI quintiles established in the GBD
study to compare performance and progress on the
health-related SDGs. More details on the estimation
of SDI can be found in accompanying GBD 2016
publications.
28–32Uncertainty analysis
GBD produces 1000 draws for all indicator estimates by
location, age, and sex (when relevant) and for all years
from 1990 to 2016. These draws from the posterior
distribution represent uncertainty in the underlying
data sources as well as the various steps in the
estimation process. Further details on this are provided
in the accompanying GBD 2016 papers
28–32and in
appendix 1 for each indicator. These 1000 draws are
used to determine 95% uncertainty intervals (UIs) in
each of the scaled SDG indicators, as well as the three
indices, using simulation analysis.
To estimate uncertainty in SDG indicators and indices
for the projected values, we applied the median rate of
change chosen from the out-of-sample validity test to
each of the 1000 draws of the indicator to estimate
1000 draws of each indicator for the time period
2017–30. Additionally, for each of the 1000 draws we
allow for year-to-year deviation from the median rate of
change on the basis of the variance across all draws.
Role of the funding source
The funder of the study had no role in the study design,
data collection, data analysis, data interpretation, or
writing of the report. The corresponding author had full
access to all the data in the study and had final
responsibility for the decision to submit for publication.
Results
Health-related SDGs in 2016
mortality ratio (MMR), child stunting and wasting,
malaria, and environmental risks, higher-SDI countries as
expected performed better than lower-SDI countries. For
other indicators, including childhood overweight, suicide
mortality, harmful alcohol use, smoking, and interpersonal
violence mortality, per
formance was much more
heterogeneous across levels of SDI, with many high-SDI
countries performing relatively poorly. These findings
were exemplified by the USA, which fell below 50 on
suicide mortality, harmful alcohol use, and inter personal
violence mortality in 2016. Not
ably, per
formance on
vaccine coverage, a new indicator as part of the GBD SDG
assessment, was generally high across the develop ment
spectrum with the exception of the lowest SDI countries;
in fact, several middle-SDI countries such as Brazil had
among the highest scores.
In 2016, the highest scores on the health-related SDG
index were found among Nordic countries, the UK, a
subset of western European countries, Singapore,
Australia, Canada, and Israel, with these countries
comprising the tenth decile of performance (figure 2).
Several western European countries (eg, France, Spain,
and Portugal), the USA, New Zealand, Japan, and
South Korea occupied the next decile of highest
performance on the health-related SDG index. The vast
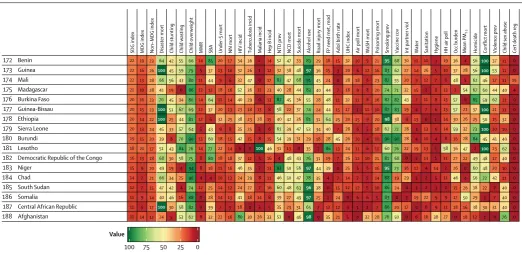
majority of countries in the first decile—places with the
lowest scores on the health-related SDG index—were in
sub-Saharan Africa, particularly western sub-Saharan
Africa, as well as a subset of central and eastern
sub-Saharan African countries. Afghanistan was the only
country in the first decile outside of sub-Saharan Africa.
Other regions showed sizeable differences on the
health-related SDG index in 2016; for instance, in Latin America,
Costa Rica scored as high as the ninth decile and several
countries (ie, Colombia, Mexico, Panama, and Uruguay)
were in the eighth decile, whereas Guyana scored as low
as the fourth decile. A similar range was found in
North Africa and the Middle East, spanning from Jordan
in the eighth decile to Yemen in the second decile. China
was in the seventh decile on the health-related SDG index
in 2016, while Russia was in the fifth decile and India was
in the fourth decile.
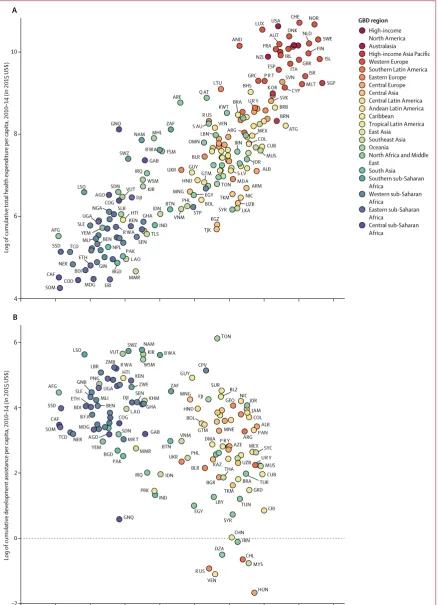
By comparing performance on the health-related SDG
index in 2016 with total health expenditure and DAH per
capita received from 2010 to 2014 (figure 3),
28,31insights
might be gleaned regarding the association between
overall health funding and performance on the
health-related SDG index and whether DAH is being directed
toward those countries with the greatest need. Generally,
total health expenditure is positively correlated with
performance on the health-related SDG index; however,
considerable variation exists at the same level of
expenditure. For example, among countries with a
health-related SDG index of 30 to 70, the association
between total health expenditure per capita and
performance varied massively, spanning at least a 7 times
difference in spending with similar levels of performance
on the health-related SDG index. For countries that
received DAH between 2010–14, some of the most
pronounced differences in cumulative DAH per capita
received in the 2016 index were in sub-Saharan Africa,
with several countries in southern sub-Saharan Africa
posting nearly three times more cumulative DAH per
capita than a number of countries in central and western
sub-Saharan Africa. Most notably, some of the poorest
performers on the health-related SDG index, such as the
Central African Republic, South Sudan, Somalia, and
Niger, received relatively little DAH.
Progress on UHC
Among the health-related indicators refined or added for
GBD 2016, the UHC index (SDG indicator 3.8.1) saw the
most substantive revision because it was expanded to
represent a broader range of essential health services and
to capture quality of care. From 2000 to 2016, performance
on the UHC index generally improved throughout the
world (figure 4 and appendix 2 p 5). Cambodia, Rwanda,
Equatorial Guinea, Laos, Turkey, and China recorded the
largest improvements since 2000, all recording an
increase of 15 or more on the UHC index. Other countries
with particularly pronounced progress on the UHC index
included Timor-Leste, Bangladesh, Myanmar, and Nepal
in Asia and Oceania; Ethiopia and Angola in sub-Saharan
Africa; and Lebanon in north Africa and the Middle East.
At the same time, a mixture of countries registered
minimal progress on the UHC index since 2000. These
included lower-SDI countries, such as Lesotho and the
Central African Republic, as well as some of the
highest-SDI countries, such as the USA and Andorra. In 2016,
Switzerland, Iceland, and Finland had the highest UHC
index performance, all exceeding 85 on a scale of 0–100,
followed by Norway, Sweden, and Japan. Conversely, the
lowest levels on the UHC index were in Somalia, the
Central African Republic, and Afghanistan, which were
all below 35, followed by South Sudan, Chad, and
Guinea-Bissau.
Health-related SDGs in 2030
65 65 65 65 65 66 66 66 66 67 67 67 67 68 68 68 68 69 69 70 70 70 70 70 71 71 72 72 72 72 73 73 74 74 74 74 75 75 75 76 76 77 77 78 78 79 80 80 80 81 82 83 83 84 86 86 87 69 64 73 59 64 72 68 65 68 67 62 82 74 66 65 83 89 67 67 72 94 75 87 85 82 86 86 83 89 90 68 92 76 83 92 93 93 91 91 91 69 91 93 92 92 89 91 89 94 85 90 97 94 95 95 96 91 63 68 64 69 68 61 66 67 67 68 71 63 65 68 69 64 61 71 70 69 62 66 64 65 68 66 66 70 67 65 77 68 74 72 67 69 69 69 69 70 79 73 71 70 73 74 75 77 75 77 78 78 79 80 81 79 84 44 68 100 61 30 90 40 51 18 52 40 100 100 100 100 100 100 66 53 40 100 46 68 100 100 37 37 68 86 73 100 82 66 58 100 54 19 100 59 85 100 100 100 49 100 100 77 89 55 70 100 100 100 56 100 100 100 71 99 87 90 96 69 82 86 89 79 72 96 85 85 61 88 100 64 83 86 100 90 99 91 88 96 93 89 97 96 89 100 86 98 100 100 95 100 89 100 89 100 100 100 100 98 96 97 100 100 99 100 100 100 100 100 96 82 82 85 92 88 51 96 90 91 91 95 93 94 79 56 84 98 50 43 91 99 90 98 91 84 98 94 85 87 94 75 98 87 100 96 98 95 98 84 98 91 98 99 98 99 99 98 99 98 98 98 98 99 99 98 99 85 37 67 77 70 84 34 83 53 60 58 71 51 33 55 26 46 35 78 44 56 45 29 41 52 61 39 45 60 55 40 62 64 69 58 36 64 81 46 40 45 44 69 44 35 54 47 54 53 61 25 48 64 67 53 53 32 59 69 44 56 51 39 50 47 57 45 50 43 76 63 59 81 82 82 49 48 52 80 59 79 92 94 76 73 86 90 78 46 85 56 60 92 98 90 92 88 80 55 87 96 97 83 84 92 86 92 91 90 99 89 98 98 100 89 99 99 100 98 98 99 97 99 99 98 93 99 99 97 99 100 99 98 99 99 99 99 100 100 100 100 98 100 100 100 99 100 99 99 94 100 99 100 100 99 99 99 99 99 99 99 99 99 100 99 99 100 100 100 100 100 100 62 50 54 50 54 78 56 57 65 56 54 80 69 63 59 85 88 73 58 81 100 65 93 93 85 80 84 78 96 90 58 88 68 75 92 91 97 88 99 92 64 88 87 93 90 80 88 84 88 77 90 100 88 96 97 100 100 55 30 41 38 35 75 44 43 60 50 50 74 63 48 50 76 82 62 45 80 100 53 91 95 77 73 82 74 94 92 43 84 64 67 88 86 100 81 92 88 57 84 79 86 86 72 82 78 77 63 88 98 80 92 95 100 100 72 46 100 43 61 63 54 55 37 52 37 88 46 51 100 91 62 93 62 39 52 57 32 59 80 66 77 95 85 74 46 64 49 51 51 54 78 54 93 55 53 54 61 54 60 57 63 55 56 49 58 71 66 63 62 60 54 63 78 91 87 67 53 72 86 60 73 60 91 74 64 82 85 100 56 73 95 92 86 76 75 82 95 71 93 98 50 83 92 53 100 89 92 83 93 93 88 83 90 95 96 94 100 100 84 95 95 100 98 98 96 93 88 63 100 100 100 100 100 82 45 100 100 84 60 100 100 100 100 100 100 100 100 100 100 100 100 100 100 100 100 100 100 80 100 100 100 100 100 100 100 100 100 100 100 100 100 100 100 100 100 100 100 100 100 100 100 100 100 100 100 63 75 61 78 85 52 73 79 79 71 73 90 84 50 84 88 68 65 58 90 98 71 84 81 97 86 51 89 88 74 80 99 67 88 94 100 75 89 93 92 84 93 97 79 98 82 74 96 70 97 92 100 98 100 100 100 87 99 96 77 67 58 34 51 72 100 78 89 100 99 39 100 100 100 100 94 73 100 64 99 100 100 100 77 100 100 98 100 100 100 100 100 100 100 100 100 100 97 100 100 100 100 100 100 100 100 100 100 100 100 100 100 100 100 50 46 62 54 59 58 88 37 51 74 85 43 60 51 64 59 80 78 49 65 90 94 84 61 58 86 74 56 68 89 64 86 59 70 92 86 100 86 82 83 65 82 82 91 81 87 94 82 98 88 92 92 86 92 94 94 90 59 39 89 95 60 53 69 60 94 68 68 21 25 53 69 32 86 85 54 39 49 62 47 28 31 42 34 44 40 9 75 29 76 36 67 37 24 46 27 77 100 27 46 69 44 43 44 56 40 77 57 32 49 47 38 43 53 61 71 96 58 49 86 50 51 60 54 55 22 49 68 55 31 32 92 72 58 1 56 9 10 35 29 66 26 21 55 53 20 99 41 10 24 61 11 37 46 79 34 21 38 34 36 23 39 44 64 84 22 49 54 40 56 88 68 41 41 63 46 30 46 44 44 42 45 73 43 48 70 64 57 64 58 71 85 46 67 77 61 72 46 70 74 51 60 78 47 51 89 87 94 90 80 58 67 70 93 69 89 74 79 97 98 99 70 94 94 98 99 95 98 40 76 59 85 86 84 96 87 92 87 94 67 78 87 17 52 65 78 82 98 95 96 86 82 50 95 100 72 68 91 90 95 83 83 87 92 66 91 67 90 91 91 90 81 91 94 100 98 93 76 84 98 92 90 88 94 80 46 52 50 19 35 59 32 46 38 22 21 54 24 25 45 72 78 92 43 31 85 29 73 69 62 48 82 51 72 100 40 72 49 54 75 80 93 73 98 86 37 75 92 84 80 68 62 62 100 54 72 80 95 82 84 88 94 65 54 67 59 56 65 66 47 58 57 62 75 65 56 69 79 90 79 66 70 98 73 87 83 78 89 79 75 86 95 61 94 65 79 98 96 98 93 93 89 61 93 92 94 92 92 96 88 100 88 87 100 97 99 98 100 95 46 66 57 66 75 52 65 57 72 69 75 49 78 67 48 56 76 56 67 68 83 82 88 80 58 100 67 56 64 77 77 98 90 82 94 83 97 87 77 75 77 79 86 87 82 98 100 82 96 81 84 100 82 97 100 98 74 78 59 70 55 61 61 64 52 60 58 54 79 70 60 86 92 100 64 66 60 89 67 86 97 90 86 79 88 80 80 59 87 77 84 97 100 82 94 96 87 59 83 84 100 87 83 90 86 96 96 80 100 87 83 85 93 78 48 76 52 70 84 48 80 54 74 60 62 78 66 55 64 91 81 100 91 79 94 77 79 59 83 82 67 68 79 60 78 83 63 56 94 82 74 77 77 96 63 83 90 96 100 75 85 84 100 97 89 85 100 87 68 85 100 34 62 31 78 79 47 77 85 94 73 100 20 38 62 52 10 4 36 53 59 43 87 47 37 28 54 68 44 29 46 97 28 68 68 25 25 32 44 35 26 100 46 51 43 38 65 64 44 44 51 53 53 54 61 77 63 86 94 54 99 96 98 97 94 98 96 76 74 98 96 100 100 95 81 95 98 95 97 96 92 93 96 91 98 98 98 98 83 90 97 88 97 88 96 90 95 94 100 96 91 93 74 60 94 93 85 93 93 96 86 93 96 90 95 84 77 36 72 74 66 62 74 76 82 76 91 83 59 85 96 96 63 71 86 99 75 95 93 95 92 82 89 95 94 85 97 88 96 100 100 100 98 98 95 84 96 98 98 100 97 98 97 99 96 87 97 98 98 95 98 99 87 65 81 59 62 78 80 62 69 88 79 87 94 70 73 86 100 36 72 67 100 88 99 85 87 96 82 88 88 96 75 100 96 100 100 100 96 100 88 100 63 100 100 98 100 100 96 100 100 100 99 100 100 100 100 100 96 77 84 96 58 80 96 92 73 84 88 76 91 98 88 83 95 99 81 96 80 100 96 95 82 94 98 94 95 96 99 81 99 98 96 100 98 99 99 95 99 80 100 100 99 99 97 99 100 100 99 98 100 100 100 99 100 99 89 79 88 58 82 97 79 78 81 85 85 99 96 95 95 99 100 72 98 82 100 80 99 97 99 97 95 99 99 97 78 100 97 100 100 100 97 100 99 100 77 100 100 99 100 100 97 100 100 100 99 100 100 100 100 100 97 91 100 100 94 98 100 92 98 98 94 93 94 99 99 83 95 100 97 99 99 100 97 99 94 97 100 98 99 99 100 100 100 100 100 100 100 100 100 97 100 99 100 100 100 100 100 100 100 100 100 100 100 100 100 99 100 100 54 94 100 68 94 60 99 80 94 74 91 68 56 67 59 71 82 77 78 60 84 93 78 89 71 63 70 81 63 79 93 63 30 77 98 80 69 86 69 72 87 71 54 76 71 61 78 73 66 76 97 91 70 86 88 68 74 47 62 36 66 62 61 62 61 72 58 68 50 75 69 67 57 76 47 68 63 64 59 82 98 48 100 44 56 58 44 61 74 95 83 80 66 71 83 60 60 66 64 79 65 70 90 96 75 78 74 59 96 66 88 100 91 50 55 14 54 10 20 70 2 39 14 18 20 74 46 42 65 80 86 84 63 46 87 37 79 48 74 80 76 66 83 77 31 88 80 43 97 94 99 93 87 71 46 80 91 92 93 76 80 97 94 83 68 77 90 93 84 95 99 100 100 10 100 100 100 100 100 100 100 100 100 100 100 100 100 100 100 100 100 100 100 100 100 100 100 100 100 100 100 100 100 100 100 100 100 100 100 100 100 100 62 100 100 100 100 100 100 100 100 72 100 100 100 100 100 100 91 86 64 90 85 86 67 88 86 100 94 88 85 80 95 97 91 87 86 92 96 82 92 98 100 73 86 87 93 91 90 82 91 100 100 100 95 93 100 99 92 83 83 90 91 94 94 91 94 98 84 84 82 94 75 94 97 100 74 76 67 75 60 66 74 74 79 66 73 53 70 79 73 44 70 70 74 44 16 44 30 70 2 85 74 70 42 75 74 42 37 49 44 39 33 73 44 75 44 51 44 34 41 47 36 43 44 24 50 39 52 29 47 42 98 96 72 79 88 54 94 87 80 92 92 99 83 83 62 93 77 63 91 98 86 97 85 99 78 100 88 97 92 88 85 84 86 94 91 95 88 98 92 70 79 85 90 94 90 96 96 96 92 96 84 100 89 88 90 95 100 1 Singapore
2 Iceland 3 Sweden 4 Norway 5 Netherlands 6 Finland 7 Israel 8 Malta 9 Switzerland 10 UK 11 Australia 12 Canada 13 Germany 14 Italy 15 Denmark 16 Belgium 17 Antigua and Barbuda 18 Cyprus
19 Slovenia 20 Ireland 21 Japan 22 Austria 23 Spain 24 USA 25 Brunei 26 France 27 Barbados 28 South Korea 29 Czech Republic 30 Slovakia
31 Taiwan (Province of China) 32 New Zealand
33 Poland 34 Estonia 35 Portugal 36 Costa Rica 37 Luxembourg 38 Cuba 39 Mauritius 40 Maldives 41 Greece 42 Croatia 43 Albania 44 Seychelles 45 Uruguay 46 Hungary 47 Panama 48 Mexico 49 The Bahamas 50 Grenada 51 Colombia 52 Malaysia 53 Saint Lucia 54 Jamaica 55 Jordan
56 Trinidad and Tobago 57 Armenia
SDG index MDG index Non−MDG index Disaster mort Child stunting Child wasting Child overweight MMR SBA Under-5 mort NN mort HIV incid Tuberculosis incid Malaria incid Hep B incid NTD prev NCD mort Suicide mort Alcohol use Road injury mort FP need met, mod Adol birth rate UHC index Air poll mort WaSH mort Poisoning mort Smoking prev Vaccine cov Int partner viol Water Sanitation Hygiene HH air poll Occ burden Mean PM
2·5
Homicide Conflict mort Violence prev Child sex abuse Cert death reg
50 51 52 53 53 53 53 53 54 54 54 54 55 55 56 56 56 56 56 56 57 57 57 57 57 58 58 58 58 58 58 58 59 59 60 60 60 60 60 60 61 61 61 61 62 62 62 62 63 63 63 63 63 64 64 64 65 65 65 65 65 65 64 54 51 78 48 79 60 53 81 57 81 71 62 68 75 61 77 50 60 54 60 73 79 74 52 54 81 54 62 57 64 64 70 84 59 62 55 72 69 63 75 68 59 63 68 73 64 62 94 73 80 56 60 78 79 69 71 69 64 73 59 64 7 47 52 54 42 56 46 54 54 43 53 42 50 54 52 47 53 51 60 49 59 56 53 51 52 61 62 52 62 57 61 57 57 56 46 57 60 62 58 59 61 56 58 61 62 61 60 61 62 54 60 59 68 65 56 60 65 63 63 68 64 69 68 88 43 34 50 50 35 100 100 100 42 69 65 2 44 68 83 100 47 100 39 66 54 82 66 68 100 100 100 45 64 47 39 57 100 18 17 100 56 64 34 37 100 44 65 32 55 100 50 100 79 100 39 42 35 100 75 57 44 68 100 61 30 9 65 60 69 80 19 94 85 81 88 91 90 83 86 86 74 82 79 48 87 77 70 76 76 85 87 76 91 86 82 81 89 77 79 96 84 64 76 83 87 76 80 58 81 88 76 87 72 91 100 86 90 72 68 98 96 89 84 71 99 87 90 96 66 95 93 62 97 90 88 81 89 72 79 91 90 81 76 76 80 56 74 88 80 64 84 83 90