1
Effect of Specimen History on Structure and In-Plane Permeability of
Woven Fabrics
A. Endruweit*, X. Zeng and A.C. Long
Faculty of Engineering – Division of Materials, Mechanics & Structures, University of Nottingham, University Park, Nottingham, NG7 2RD, U.K. * Corresponding author (Email: [email protected])
Abstract
Before being processed into composites, reinforcement fabrics may undergo repeated involuntary deformation, the complete sequence of which is here referred to as speci men history. To mimic its effect, fabric specimens were subjected to sequences of defined shear operations. For single fabric layers with unconstrained thickness, quantitative evaluation of photographic image data indicated that repeated shear deformation results in a residual increase in inter-yarn gap width. This translates into an increase in measured fabric permeabilities in multi-layer lay-ups at given compaction levels. The extent of both interrelated effects increases with increasing yarn density in the fabric and with increasing maximum angle in the shear history. Additional numerical permeability predictions indicated that the increase in permeability may be partially reversed by through-thickness fabric compression. The observations suggest that the effect of involuntary deformation of the fabric structure can result in variations in the principal permeability values by factors of up to 2.
Keywords
2
Introduction
In Liquid Composites Moulding (LCM) processes, the impregnation of textile reinforcements with liquid resin systems is frequently described by the model of a viscous liquid flowing through a porous medium, characterised by its porosity and permeability. Determination of the textile permeability is a prerequisite for optimisation of the process parameters for production of composite components applying LCM-technology, in particular location of injection gates and vents in the mould to achieve complete impregnation of the reinforcement, and for prediction of the mould fill time.
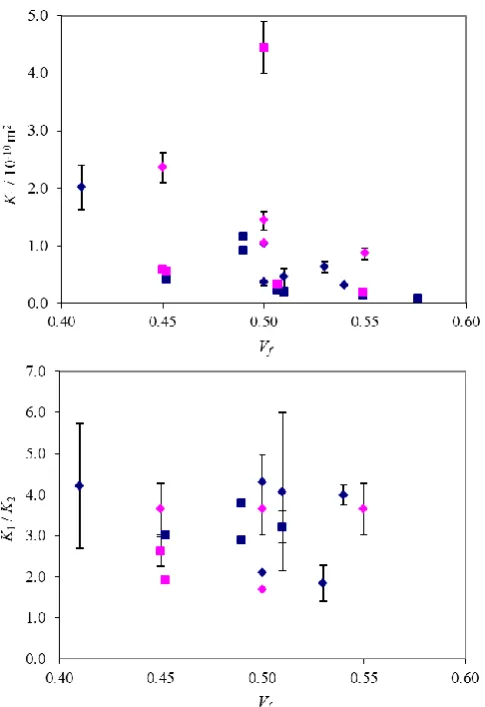
Experimentally observed permeability values frequently show large scatter. As an example, a recent international benchmark exercise, 1 which gave an overview of methods for permeability measurement in practical use in different laboratories and the range of results obtained implementing these methods, indicated that in-plane permeability values for a given woven reinforcement fabric, measured in different laboratories, can show a scatter of one order of magnitude at any given fibre volume fraction (Figure 1). The ratio of the principal permeability values can vary by factors of up to 2. This variability makes resin flow during reinforcement impregnation hard to predict, and uncontrollable flow may eventually affect the composite manufacturing process and result in formation of defects in the component.
3 cutting, stacking of multi-layer specimens) or result from effects of gravity and handling during storage and transport.
Since shear, the mechanics of which was discussed in detail by Behre3 and Skelton,4 is the main deformation mechanism of woven fabrics,5 the specimen history can be assumed to affect the fabric structure mainly through involuntary (repeated) shear. The residual effect of the specimen shear history on the fabric structure (illustrated schematically in Figure 2, and sometimes referred to as “mechanical fabric conditioning”), i.e. the difference in structure between the initial 0/90 configuration and the final configuration restored to 0/90, is related to the forces which need to be applied to overcome constraints on yarn rotation in order to shear a fabric. In densely packed fabrics, constraints on the yarn mobility result mainly from contact forces between parallel yarns (Figure 3(a)). In coarse woven fabrics, constraints on yarn rotation are imposed by crimp (interaction of initially orthogonal yarns) as discussed by Nguyen et al.6 and friction in cross-over points (Figure 3(b)). In the former case, forces tend to be significantly higher than in the latter case. In either case, force s applied to shear a fabric translate into lateral yarn compression, potentially resulting in a residual reduction in yarn width and a residual increase in inter-yarn gap width.
4
Fabric geometry analysis
Materials
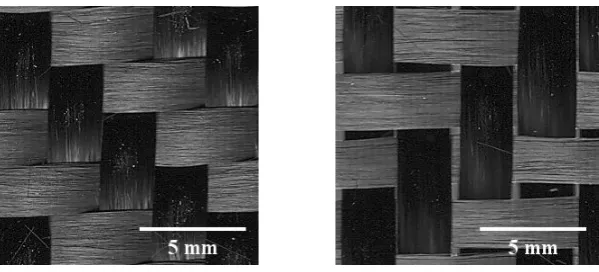
The effect of repeated shear on the fabric structure was studied for two 2×2 twill weave carbon fibre fabrics, one with nominal superficial density S0 = 660 g/m2 and filament
count cf= 12K, the other with S0 = 285 g/m2 and cf = 6K. The photographs in Figure 4
indicate thedifference in yarn packing density in both (unsheared) fabrics.
Method
To simulate the effect of the material history for different woven fabrics, single-layer fabric specimens with unconstrained thickness were sheared to given angles and subsequently restored to a 0/90 configuration. A steel shear frame (Figure 5(a)) was used, where rectangular specimens with dimensions 500 mm × 280 mm were clamped along the short edges which were parallel to either the fabric warp or weft direction. Analysis of photographs of the fabric surface, acquired after completion of each shear cycle (i.e. restored to a 0/90 configuration) using a flatbed document scanner, allowed yarn spacing, sy, and yarn width, wy, to be measured in 2D projection. The width of inter-yarn
gaps, wg, can then be identified as the difference of sy and wy. Potential changes in yarn
thickness related to changes in yarn width were not quantified here.
5 Results
For specimens of the two 2×2 twill weave carbon fibre fabrics described above, yarn widths, wy, measured for unsheared specimens and specimens after undergoing shear to
a maximum angel of -40 are listed in Table 1. Each value is based on 20 measurements from a sampling area of approximately 100 mm × 100 mm (as indicated in Figure 5(a)). The data acquired here do not enable any statistical distribution of the yarn widths to be clearly identified. Average inter-yarn gap widths, wg, after undergoing different shear
operations are plotted in Figures 6 and 7. The absolute value of the maximum shear angle was limited to 40 since considerable force needs to be applied to shear the fabric any further (as will be discussed below). This is considered prohibitive for involuntary deformation, which these experiments attempt to mimic.
For interpretation of the results, several caveats are to be considered. Although, for each fabric, all specimens are from the same batch (same roll) of material, every “unsheared” specimen has undergone its own specific history (cutting, transfer into the shear frame, clamping) before the experiment, which may result in different initial configurations. The effect of induced shear on the fabric structure may vary depending on the accuracy of alignment of the fabric specimens in the shear frame, which may be limited by the manual process, and there may be some slack the in fabric affecting tension in the yarns when sheared. In addition, the accuracy of shear angle adjustment is limited. Finally, evaluation of images of the specimen surface may introduce uncertainty. Blurred images explain the outliers in Figure 7.
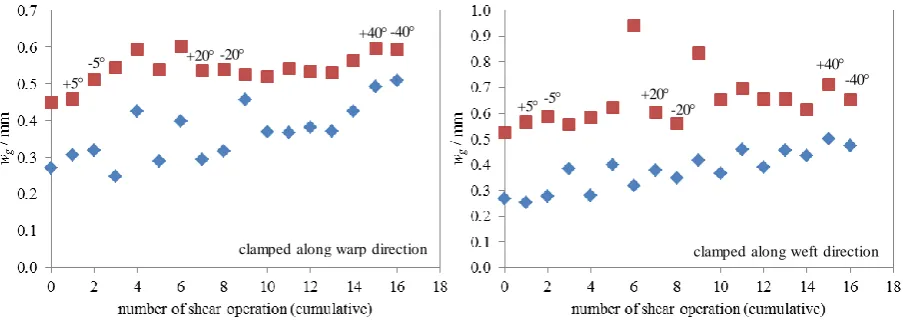
Despite these known issues, the following trends can be derived from the acquired data. Figure 6 indicates that, prior to any shear operation, no gaps exist between parallel fibre bundles in the fabric with S0 = 660 g/m2, and there is no significant difference in
6 changes in yarn width for small maximum angles in the shear history (shear cycles 1 to 7). For maximum angles in the shear history greater than approximately 20 (shear cycles 7 to 16), which coincides with the observed onset of wrinkling in the fabric, the increase in gap width, i.e. decrease in yarn width, becomes stronger. This trend is stronger when the fabric is clamped along the warp direction than when clamped along the weft direction. In this case, the weft yarns seem to get slightly wider at small maximum angles resulting in partial overlap of adjacent bundles, which translates into a negative gap width (the yarn width is measured at approximately the widest point of the yarns). The difference between the initial and final yarn width (maximum shear angle -40) is approximately identical in both fabric directions.
In the fabric with S0 = 285 g/m2 (Figure 7), gaps exist between parallel fibre bundles prior
to any shear operation. These initial gaps are significantly wider between weft yarns than between warp yarns, which is related to a significant difference in yarn width (warp yarns are wider than weft yarns) as indicated in Table 1. After undergoing shear operations, the gap widths increase approximately linearly with increasing maximum angle in shear history (i.e. the yarn widths decrease). The increase in gap width is more significant between warp yarns than between weft yarns, i.e. the reduction in yarn width is stronger for warp yarns, which are initially wider than weft yarns. There appears also to be a trend for the gap widths to increase more strongly when the fabric is clamped along the weft direction than when clamped along the warp direction, which may be related to different yarn mobility in the different fabric directions. Since this trend is weak, it will be ignored in the following. For this fabric, no wrinkling was observed in the range of shear angles discussed here.
7 not suggest any dependence of the standard deviations of the yarn width on the
specimen shear history (Table 1).
Shear resistance measurement
Method
Fabric shear resistance data were measured to help understand the fabric mechanics leading to the observed changes in the fabric structure. Picture frame shear tests5 were carried out on an Instron 5969 testing machine with a 5 kN load cell. The cross-head speed was set to 20 mm/min. Deviating from the normal procedure for picture frame shear tests (where cross-shaped specimens are used), rectangular fabric specimens were clamped along the short edges (Figure 5(b)), parallel either to the fabric warp or weft direction, to be consistent with the procedure employed for fabric geometry analysis. Here, the dimensions of the specimens were 200 mm × 100 mm. The difference in specimen area compared to the specimens for geometry analysis affects the absolute values of shear resistance, but not the qualitative fabric behaviour at different shear angles.
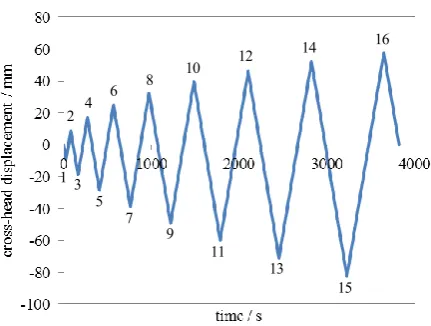
The cross-head displacement, d, on the testing machine (Figure 8) was converted to fabric shear angles, , according to
2
2
, (1)
where 2 1 2 arccos L d (2)
is half the angle between fibre directions in the fabric,5 and L is the side length of the shear frame. This allowed the same shear cycles as for geometry analysis to be reproduced.
8 For the fabrics described above and shown in Figure 4, the shear angle was calculated according to Eq. (1). As suggested by Cao et al.,5 the shear force, Fs, was calculated from the
force applied to the picture frame, Ft, corrected by the force required to shear the empty
frame, Ff, according to
cos 2
f t s
F F
F . (3)
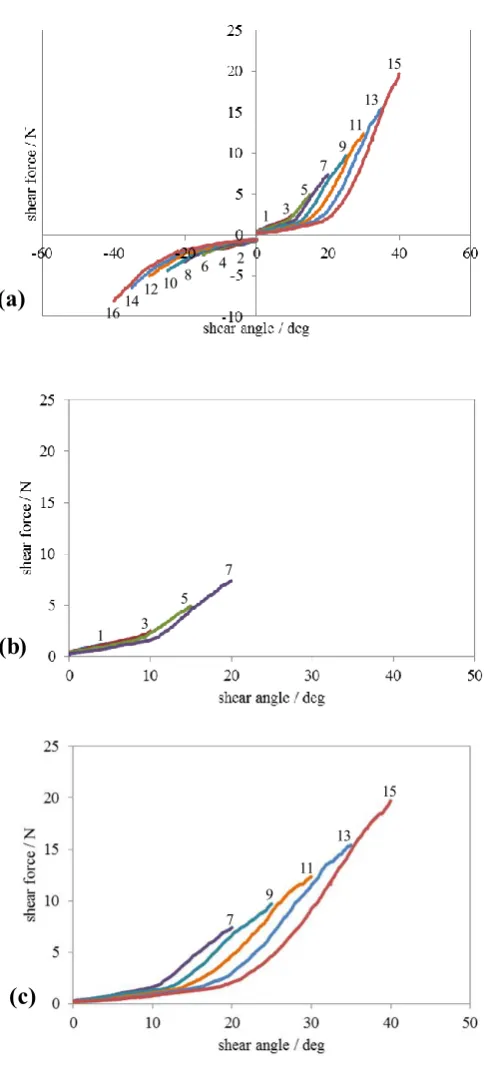
Typical results for all shear cycles are plotted in Figures 9(a) and 10(a) (for clarity, only the loading phase of each shear cycle is plotted, the unloading phase is omitted). For evaluation of the data, the same caveats as for geometry analysis apply. Of particular concern is the accuracy of specimen alignment in the picture frame. Even slight misalignment may result in asymmetry of the curves (as in Figure 9(a), for S0 = 660 g/m2) due to an offset in shear angle
and tension induced in the fibres.
For the fabric with S0 = 660 g/m2, detailed analysis of the data plotted in Figures 9(b) and
9(c) suggest that, for shear cycles with maximum shear angles of up to approximately 20 (cycles 1 to 7), the shear force as a function of the shear angle follows approximately the same trace in each cycle. If the maximum angle is greater than approximately 20 (cycles 7 to 16), the absolute value of the shear force in each cycle is smaller than in previous cycles (in the range of shear angles smaller than the maximum angles in previous cycles). Increasingly more additional force is required in the range of shear angles greater than the maximum angles in previous cycles.
For the fabric with S0 = 285 g/m2, absolute values of force applied to shear the fabric to a
9 of shear angles greater than the maximum angles in previous cycles appears to drop off with increasing maximum angle.
In-plane permeability measurement
Method
For the 2×2 twill weave carbon fibre fabric with S0 = 660 g/m2, the in-plane permeability
was characterised experimentally in unsaturated flow experiments with radial injection geometry at constant injection pressure. Synthetic oil with known viscosity-temperature characteristics (103 mPa×s at 20 C)was used as a test fluid.
At a cavity height of 2 mm, specimens consisted of 3 fabric layers, corresponding to a fibre volume fraction Vf = 0.56. All layers had the same orientation. Specimens were
prepared by shearing each fabric layer individually before stacking, following the procedure described above. Shear angles were increased in steps of 5 (alternating in “+” and “-” direction) until the target maximum angle was reached. Areas which may have been damaged by clamping of the fabric in the shear frame were cut from the originally rectangular layers prior to injection. The resulting square specimens with dimensions 280 mm × 280 mm were used for the injection experiments.
For the fabric with S0 = 285 g/m2, the permeability was measured in a previous series of
unsaturated injection experiments with linear injection geometry at constant injection pressure.12 At a cavity height of 3.5 mm, 9 fabric layers corresponded to Vf = 0.40.Experimental permeability data are available only for unsheared specimens.
Results
For the fabric with S0 = 660 g/m2, results for the measured in-plane permeability of
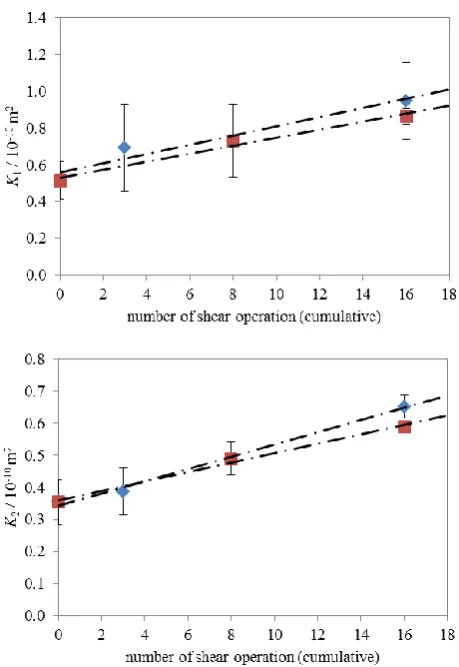
10 pressure in range from 1.68 bar to 1.83 bar). For both clamping configurations, the principal in-plane permeability values, K1 and K2, increase approximately linearly with
increasing maximum shear angle (Figure 12). The increase tends to be slightly stronger for specimens clamped along the warp direction than for those clamped along the weft direction. There is no clear trend for the ratio K1/K2 to change. The ratio of the semi-major
and semi-minor axes of the flow front ellipse in radial flow, R1/R2, which is equal to the square
root of the ratio K1/K2, is approximately constant at a value of 1.2. This implies that the flow
front shape is similar to a circle, and the principal flow direction is sensitive to small changes in fabric structure. This is reflected in the observed changes in the angle , which indicates the orientation of K1 relative to the fabric weft direction.
For the fabric with S0 = 285 g/m2, the measured permeability is given in Table 3 (10
repeats at 0 ,45 and 90 between warp direction and applied pressure gradient; constant injection pressure in range from 0.80 bar to 1.22 bar). Here, the principal flow direction coincides with the weft direction, because the gap width between weft yarns tends to be significantly higher than the gap width between warp yarns (Figure 7).
In-plane resin flow simulation
Method
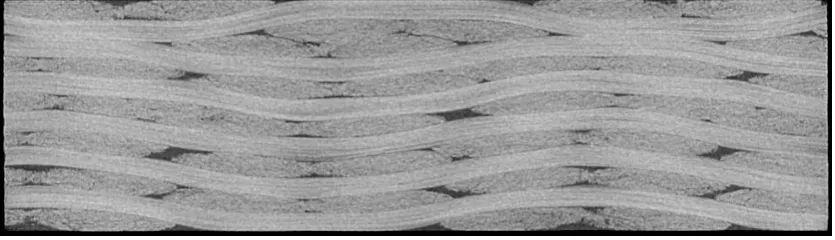
To complement experimental data, permeabilities were predicted based on resin flow simulations. This allows identifying clearly the correlation between geometrical fabric parameters, which can be controlled for the simulations, and permeabilities. Based on the data in Table 1, Figure 6, and additional 3D geometry data (Figure 13) for unsheared specimens acquired using micro-Computed Tomography (-CT), geometrical models of 3 layers of the fabric with S0 = 660 g/m2 at a cavity height of 2 mm
11 The dimensions of the models were chosen such that one complete fabric unit cell (4 × 4 yarns) was included in each layer. For relative positioning of the layers, two cases, zero nesting and random nesting, were considered. To model random nesting, the relative in-plane displacement of layers was normalised over the full length of one unit cell in weft- and warp-direction. Instances of random nesting were generated employing Latin hypercube sampling14 from randomly distributed displacement values. Compared to Monte Carlo sampling, this produces more evenly distributed samples from the entire ranges of variables, thus allowing to fully explore multi-dimensional inputs based on limited numbers of simulations. Modelling of each individual ply was based on geometrical continuity and imposed geometrical constraints. Issues of stochastic variability in yarn paths and yarn cross-sections in each ply, which were discussed by Vanaerschot et al.,15 were not considered here.
In a first step, the geometrical model of the unsheared fabric was generated in an automatic manner based on the measured geometrical data in Table 1. The principles of geometrical fabric modelling are discussed in detail by Lin et al.16 To avoid yarn intersections at cross-over points, realistic yarn paths were defined automatically accounting for fabric crimp, and yarn cross-sectional geometries were adapted locally by changing widths and heights. Then, observed changes in yarn widths due to the fabric shear history (Figures 6 and 7) were introduced successively through manual updates of the respective yarn widths in themodel geometries. The simplifying assumption was made that the yarn width in a lay-up at given level of compaction is the same as the width in a single fabric layer wi th unconstrained thickness, i.e. potential flattening and widening of the yarns due to through-thickness compression was ignored here (Figure 14). The implications of this assumption will be discussed below.
12 cavity. The flow domains were meshed with uniform hexahedral (brick shaped) voxels wi th appropriate size for representation of a sufficient level of geometrical detail. The permeabilities of yarns, which can be estimated based on the models proposed by Gebart17 assuming ideal square or hexagonal filament arrangement, are typically small compared to the overall permeabilities of the fabric stacks. Thus, the yarns can be assumed to be impermeable in order to reduce the computational cost for CFD simulations. Steady-state Navier-Stokes flow through the pore spaces was simulated using the commercial CFD code Ansys CFXTM. The assumptions of yarn impermeability and steady state (i.e. saturated) flow imply that capillary effects, which may affect the unsaturated flow experiments for permeability measurement described above, are not considered in the simulations. Translational periodic boundary conditions were set on opposite faces of the textile unit cell domain in weft and warp direction to represent a continuous reinforcement. A flow -driving pressure drop was applied in either warp or weft direction. No-slip wall boundary conditions were specified at the top and bottom faces of the domain to simulate flow along the mould surfaces during in-plane fabric impregnation. Since inter-yarn gap spaces are typically large compared to pore spaces in the inter-yarns, implying that lubrication at the yarn-gap interface can be assumed to be negligible,18 no-slip boundary conditions were also applied on the yarn surfaces. From the applied pressure gradients along different fabric directions and the calculated average flow velocities, in-plane permeabilities were determined. In a first step, the mesh sensitivity of the predicted permeabilities was assessed. Based on the results of simulations with different mesh densities, the number of voxels for the entire flow domain was chosen as 150 × 150 × 90 (warp × weft × thickness) to obtain a reasonable balance between computation time and accuracy for all following simulations.
The same procedure was applied to modelling flow through 9 layers of the fabric with S0 =
13 used for the flow simulations, for which convergence of the results was found. As for the other fabric, cases with zero nesting and random nesting were simulated.
Results
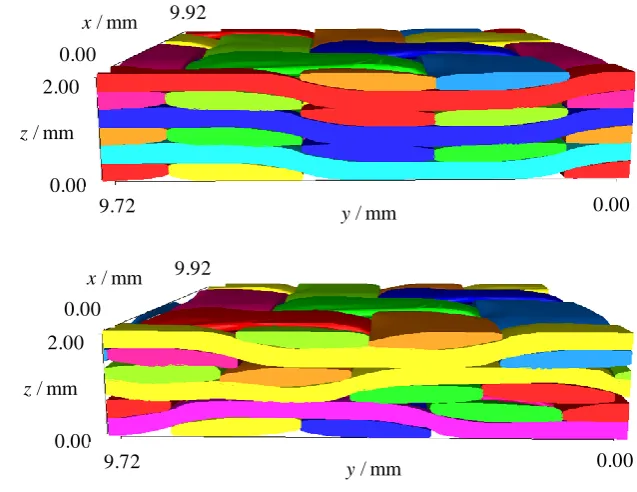
Examples for geometrical models of unsheared fabric (S0 = 660 g/m2) with zero nesting
and random nesting are shown in Figure 15. In the models, weft yarns are oriented along the x-direction, warp yarns are oriented along the y-direction.
Results for the permeabilities in both fabric directions, derived from the results of CFD simulations, are listed in Table 4. In the case of random nesting, six example lay-ups were generated for each shear history, and average permeabilities and standard deviations were determined. The data indicate that, in addition to the effect of nesting, which was discussed by Hoes et al.,19 the fabric history has a significant effect on the permeability. Computed permeabilities are higher for random nesting than for zero nesting, reflecting different geometries of flow channels forming in the lay-up. The permeability in the weft direction, Kx,
is consistently higher than the permeability in the warp direction, Ky. The ratio Kx/Ky tends to
be higher for zero nesting than for random nesting. With increasing maximum angle in the shear history, Kx and Ky increase since the inter-yarn gap width increases as illustrated in
Figure 6.
For the fabric with S0 = 285 g/m2, permeabilities in both fabric directions, derived from the
14 permeability values in the different fabric directions tends to be higher for zero nesting than for random nesting. It is smaller for the fabric that has undergone the shear operations than for the unsheared fabric.
Discussion
For the fabric with S0 = 660 g/m2, parallel yarns are in contact with each other
if previously unsheared (Figure 4), suggesting that contact forces between parallel yarns (Figure 3(a)) are the main deformation mechanism in fabric shear. The average yarn width in the fabric decreases with increasing maximum angle in the shear history, and the gap width increases accordingly. The residual effect of shear on the gap width is small for small maximum shear angles, but more significant for shear angles greater than the angle for onset of fabric wrinkling at approximately 20 (Figure 6).
These geometrical observations correlate well with the measured shear resistance data (Figure 9), which suggest that lateral yarn compression is almost “elastic” for shear angles up to approximately 20 and relatively small shear forces. For greater shear angles, where wrinkling was observed, the force in each shear cycle is reduced compared to the previous one (in the range of angles reached in previous cycles). This suggests that, in each cycle, the fabric loses part of its shear resistance due to “plastic” yarn deformation. The related creation and widening of inter-yarn gaps implies that the effect illustrated in Figure 3(b) is dominant for a range of shear angles, , with cos × wg > 0 (where wg is the gap width at the
start of the cycle). With increasing shear angle (beyond angles reached in previous cycles), increasingly more force is required due to stiffening of the yarns in lateral compression with increasing density of filament packing (and increasing yarn thickness) at reduced yarn width.
For the fabric with S0 = 285 g/m2, geometrical considerations, based on values for wy andsy,
15 only if the shear angle is greater than approximately 34, adjacent warp yarns are in contact if the shear angle is greater than approximately 25. While there are no contact forces between parallel yarns in any direction for shear angles smaller than 25, the observed approximately linear reduction in yarn width with increasing maximum shear angle (Figure 7) is related to friction in yarn cross-over points and constraints on rotational yarn movement imposed by crimp (Figure 3(b)). The difference in the main mechanism for lateral yarn compression implies that shear forces for the fabric with S0 = 660 g/m2 are greater than those for the fabric
with S0 = 285 g/m2.
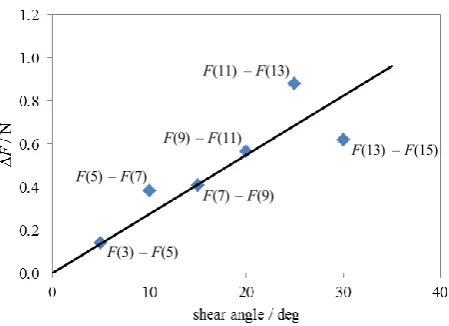
The linear reduction in yarn width correlates with the measured shear resistance data (Figure 10), which indicate that the absolute value of the shear force in each cycle is smaller than in previous cycles. This suggests that, in each shear cycle, the fabric loses part of its shear resistance due to “plastic” yarn deformation. The additional force required for fabric shear in the range of angles greater than the maximum angles in previous shear cycles appears to drop off with increasing maximum angle, suggesting that, in the range of angles discussed here, reduction of the yarn width is not sufficient to result in stiffening in lateral compression.
This difference in behaviour compared to the fabric with S0 = 660 g/m2 is related to the
yarn cross-sectional shape and filament count. As illustrated in Figure 4 and Table 1, yarn widths in both fabrics are similar. However, in the fabric with higher S0 and cf = 12K, the
yarns have greater thickness due to constraints on the maximum yarn width. This lateral pre-compression is thought to result in higher resistance to permanent filament reordering in the yarns. On the other hand, in the fabric with lower S0 and cf = 6K, yarns are flatter and, due to
16 For the fabric with S0 = 660 g/m2, a shear history with a maximum angle of -40
resulted in a reduction in yarn width by 9 % or 10 % (Table 1) and the corresponding creation of inter-yarn gaps. For the same shear history, an increase in permeabilities by a factor of approximately 1.8 (clamped along warp) or 1.7 (clamped along weft) w as observed experimentally. This indicates a correlation between changes in the fabric structure and measured permeability values at different shear histories.
Measured (Table 2) and predicted (Table 4) permeability values for specimens sheared while clamped along the fabric weft direction are compared in Figure 16, where Kx is
assumed to correspond to K1, Ky to K2. This ignores changes in the orientation of the principal
17 employing -CT to allow the effect of yarn flattening and widening for compressed stacks of fabric layers to be quantified. In particular, more accurate modelling of the increased actual width of flattened yarns is expected to result in a reduction in predicted permeability values for large shear angles.
For the fabric with S0 = 285 g/m2, the accuracy of permeability predictions based on flow
simulations for the unsheared fabric improved significantly compared to previous simulations12 (where prediction for Kwarp were in the range between
3.00×10⁻¹⁰ m2 and3.24×10-10 m2, and for Kweft between 3.33×10⁻¹⁰ m2 and 3.43×10⁻¹⁰
m2), because more accurate geometry data were available. A shear history with a maximum angle of -40 resulted in an observed increase in inter-yarn gap width in the order of 80 % (between warp yarns) and 30 % (between weft yarns), respectively. This significant increase in gap width in a single layer transferred into an increase in predicted permeability of a fabric lay-up. After undergoing the shear operations, the predicted permeability is less anisotropic than in the unsheared fabric, because the difference in gap widths in both fabric directions is reduced (Figure 7). However, the predicted change in permeability caused by the shear history is significantly smaller than for the fabric with S0 = 660 g/m2, because the relative change ininter-yarn gap widths is smaller
(Figures 6 and 7). As for the other fabric, yarn flattening and widening in through-thickness compression is expected to reverse partially the increase in permeability caused by the fabric shear history.
18 For the fabric with S0 = 660 g/m2, the measured inter-yarn gap width (Figure 17) shows a
trend to keep increasing when the fabric is sheared repeatedly to the same angle (+30). This implies that, after completion of the first cycle, there is still shear force translated into l ateral yarn compression in the following cycles, although the applied force is significantly small er than in the first cycle (Figure 9). When sheared repeatedly to angles which decrease with increasing number of shear operation, there appears to be no clear trend for the gap width in the fabric to change significantly after the first shear cycle.
For the fabric with S0 = 285 g/m2, results for the measured inter-yarn gap width (Figure
18) suggest that gaps between warp yarns are not affected when the fabric is sheared repeatedly to +30. Gaps between weft yarns appear to decrease slightly in width, although this trend is very weak. This apparent small difference in behaviour in both fabric directions is related to the fabric structure. Since adjacent weft yarns are in contact only if the shear angle is greater than approximately 34, it can be speculated that, due to relatively weak constraints on the yarn width, the relatively loose yarns can spread out when handled. This would explain a reduction in observed gap width. On the other hand, adjacent warp yarns are in contact if the shear angle is greater than approximately 25, implying that the yarns are re-compressed laterally in each shear cycle. As a result, the yarn width (and gap width) does not change. No significant change in gap width was observed for repeated shear of the fabric to angles which decrease with increasing number of shear operation.
The issue of changes in through-thickness permeability was not addressed here. As does the in-plane permeability, the through-thickness permeability depends strongly on the width of inter-yarn gaps in each fabric layer. Hence, it is expected to exhibit a similar dependence on the fabric shear history as the in-plane permeability.
19 For two different 2×2 twill weave carbon fibre fabrics, the effect of specimen history on the fabric structure was mimicked by repeated defined shear deformation. For single fabric layers with unconstrained thickness, quantitative evaluation of photographi c image data of the fabric surface in 0/90 configuration indicated that repeated defined shear deformation results in a residual increase in inter-yarn gap width. Complimentary picture frame shear tests indicated different shear behaviour for both tested fabrics, which have different dominating deformation mechanisms. The densely packed fabric showed high shear resistance and a strong residual increase in inter-yarn gap width, while the coarse fabric showed low shear resistance and a weak increase in gap width. The increase in gap width translates into an increase in experimentally determined permeability values for multi-layer fabric stacks at given levels of through-thickness compaction. For the examples discussed here, an increase in permeability by up to 80 % was observed. Additional CFD analyses of resin flow were found to predict the experimental permeability data with reasonable accuracy provided that accurate geometry data are available. Comparison of predicted and measured permeability data for different fabric shear history implied that through-thickness compression of the fabric in the cavity partially reverses the increase in inter-yarn gap width induced in the uncompressed fabric layers.
It can be concluded that the effect of involuntary deformation of the fabric structure, e.g. during specimen handling, can result in variations in the principal permeability values by factors of up to 2.
Acknowledgement
This work was funded by the Engineering and Physical Sciences Research Council (grant number: EP/IO33513/1), through the EPSRC Centre for Innovative Manufacturing in Composites.
References
20 2. Vernet N, Ruiz E, Advani S, et al. Experimental determination of the permeability of engineering textiles:
Benchmark II. Compos Part A-Appl S 2014; 61: 172-184.
3. Behre B. Mechanical Properties of Textile Fabrics. Part I: Shearing. Text Res J 1961; 31(2): 87-93. 4. Skelton J. Shear of Woven Fabrics. In: Mechanics of Flexible Fibre Assemblies, Sijthoff & Noordhoff,
Alphen, 1980.
5. Cao J, Akkerman R, Boisse P, et al. Characterization of Mechanical Behavior of Woven Fabrics: Experimental Methods and Benchmark Results. Compos Part A-Appl S 2008; 39(6): 1037–1053.
6. Nguyen M, Herszberg I and Paton R. The Shear Properties of Woven Carbon Fabric. Compos Struct 1999; 47(1-4): 767-779.
7. Hammami A, Trochu F, Gauvin R, et al. Directional Permeability Measurement of Deformed Reinforcement. J Reinf Plast Comp 1996; 15(6): 552-562.
8. Smith P, Rudd CD and Long AC. The Effect of Shear Deformation on the Processing and Mechanical Properties of Aligned Reinforcements. Compos Sci Technol 1997; 57(3): 327-344.
9. Lai CL and Young WB. Model Resin Permeation of Fibre Reinforcements after Shear Deformation. Polym Composite 1997; 18(5): 642-648.
10. Bickerton S, Simacek P, Guglielmi SE, et al. Investigation of Draping and Its Effect on the Mold Filling Process During Manufacturing of a Compound Curved Composite Part. Compos Part A-Appl S 1997; 28(9-10): 801-816.
11. Wiggers J. Analysis of Textile Deformation during Preforming for Liquid Composite Moulding. PhD Dissertation, University of Nottingham, 2007.
12. Zeng XS, Long AC and Endruweit A. Numerical Prediction of Permeability of Textiles for the International Benchmark Exercise. In: 11th International Conference on Flow Processes in Composite Materials, Auckland, 2012, pp. 2-9.
13. University of Nottingham. TexGen (Version 3.5.3), http://texgen.sourceforge.net (2012, accessed 26 March 2013).
14. McKay MD, Beckman RJ and Conover WJ. Comparison of Three Methods for Selecting Values of Input Variables in the Analysis of Output from a Computer Code. Technometrics 1979; 21(2): 239–245. 15. Vanaerschot A, Cox BN, Lomov SV, et al. Stochastic framework for quantifying the geometrical
variability of laminated textile composites using micro-computed tomography. Compos Part A-Appl S
2013; 44: 122-131.
16. Lin H, Zeng X, Sherburn M, et al. Automated geometric modelling of textile structures. Text Res J 2012; 82(16): 1689-1702.
17. Gebart BR. Permeability of Unidirectional Reinforcements for RTM. J Compos Mater 1992; 26(8): 1100-1133.
18. Grouve WJB, Akkerman R. An idealised bc for the meso scale analysis of textile impregnation processes.
In: The 9th International Conference on Flow Processes in Composite Materials, Montréal, 2008.
1 Figure 1. Scatter in permeability values measured by different laboratories for the example of a 2×2 twill weave
glass fibre fabric:1 principal permeability value, K1, and ratio, K1/K2, as a function of fibre volume fraction, Vf;
error bars indicate standard deviations.
[image:21.595.122.478.574.674.2]2 Figure 3. Mechanisms of lateral yarn compression; (a): contact forces between parallel yarns; (b): constraints on
yarn rotation are imposed by crimp and friction at cross-over points; here: example plain weave.
Figure 4. Surfaces of two different 2×2 twill weave fabrics, both unsheared; left: superficial density S0 = 660
g/m2, yarn filament count cf = 12K; right: S0 = 285 g/m 2
, cf = 6K.
[image:22.595.149.449.384.520.2]3 Figure 5. Schematic illustration of set-ups for fabric shearing; (a): steel frame allowing measurement of yarn
spacing and yarn width in the fabric after undergoing defined shear deformations, white rectangle in
centre indicates sampling area; (b): picture frame for shear resistance measurement (adapted from Wiggers11).
4 Figure 6. Average width of inter-yarn gaps, wg, for a specimen of a 2×2 twill weave fabric (S0 = 660 g/m
2 ) after
undergoing different shear operations; diamond symbols: gap width between warp-yarns; square symbols: gap
width between weft-yarns.
Figure 7. Average width of inter-yarn gaps, wg, for a specimen of a 2×2 twill weave fabric (S0 = 285 g/m 2
) after
undergoing different shear operations; diamond symbols: gap width between warp-yarns; square symbols: gap
width between weft-yarns.
+5 -5
+40 -40
-20 +20
clamped along warp direction
+5-5
+40 -40
-20 +20
clamped along weft direction
+5 -5
+40 -40 -20
+20
clamped along warp direction
+5-5
+40 -40 -20
+20
[image:24.595.75.527.450.610.2]5 Figure 8. Cross-head displacement as a function of time on testing machine to reproduce shear cycles employed
for fabric geometry analysis. 1
2
3 4
5 6
7 8
9 10
11 12
13 14
6 Figure 9. Typical results of picture frame shear tests for the 2×2 twill weave fabric with S0 = 660 g/m
2 ,
measured for specimens clamped along the fabric warp direction; for clarity, only the loading phase of each
shear cycle is plotted; (a): shear force as a function of the shear angle for all shear cycles; (b): top right quadrant,
shear cycles 1 to 7; (c): top right quadrant, shear cycles 7 to 15. 1
2 3
4
5
6
7
8
9
10
11
12
13
14
15
16
7 9
11 13
15
1 3
5 7
(a)
(b)
[image:26.595.172.417.61.595.2]7 Figure 10. Typical results of picture frame shear tests for the 2×2 twill weave fabric with S0 = 285 g/m
2 ,
measured for specimens clamped along the fabric warp direction; for clarity, only the loading phase of each
shear cycle is plotted; (a): shear force as a function of the shear angle for all shear cycles; (b): top right quadrant,
[image:27.595.175.413.69.409.2]shear cycles 1 to 15.
Figure 11. Difference between shear force in subsequent shear cycles, F, measured at different angles (see
Figure 10(b)) for the 2×2 twill weave fabric with S0 = 285 g/m 2 . 1 2 3 4 5 6 7 8 9 10 11 12 13 14 15 16 1 3 5 7 9 11 13 15 (a) (b)
F(13) – F(15) F(11) – F(13)
F(9) – F(11)
F(7) – F(9) F(5) – F(7)
[image:27.595.186.411.529.692.2]8
Figure 12. Experimentally determined principal permeability values, K1 and K2, for a 2×2 twill weave fabric
with S0 = 660 g/m2, fibre volume fraction Vf = 0.56, after undergoing different shear operations; diamond
symbols: specimens clamped parallel to warp direction during shear; square symbols: specimens clamped
[image:28.595.182.412.90.424.2]9 Figure 13. Cross-sectional -CT data for 6 layers of the 2×2 twill weave fabric with S0 = 660 g/m
2 at a
specimen thickness of 4 mm (same level of fabric compression as for 3 layers at 2 mm thickness); the fabric was
[image:29.595.89.507.74.194.2]previously unsheared; nesting was random.
Figure 14. Typical cross-sections of yarns in a 2×2 twill weave fabric with S0 = 660 g/m 2
in geometrical models
for resin flow simulations; x, y and z are co-ordinates relative to the centroid of the cross-sections; top:
weft-yarn; bottom: warp-yarn.
[image:29.595.149.448.322.475.2]10 Figure 15. Geometrical models of unsheared lay-up for 2×2 twill weave fabric with S0 = 660 g/m
2
(3 layers, 2
mm total thickness); top: zero nesting; bottom: random nesting.
x / mm
y / mm
z / mm
0.00 0.00
2.00 0.00
9.92
9.72
x / mm
y / mm
z / mm
0.00 0.00
2.00 0.00
9.92
11 Figure 16. Comparison of measured and predicted permeability values, K1 and K2, for a 2×2 twill weave fabric
with S0 = 660 g/m 2
, fibre volume fraction Vf = 0.56; diamond symbols: simulation, zero nesting; square symbols:
12 Figure 17. Average width of inter-yarn gaps, wg, for a specimen of a 2×2 twill weave fabric (S0 = 660 g/m
2 )
after undergoing different shear operations; diamond symbols: gap width between warp-yarns; square symbols:
gap width between weft-yarns.
+30
+30
+30 +30 +30
clamped along warp direction
+10 +20
+30 +40
13 Figure 18. Average width of inter-yarn gaps, wg, for a specimen of a 2×2 twill weave fabric (S0 = 285 g/m
2 )
after undergoing different shear operations; diamond symbols: gap width between warp-yarns; square symbols:
gap width between weft-yarns.
+30 +30
+30 +30 +30
clamped along warp direction
+10 +20
+30 +40
1 Table 1. Width of yarns, wy, for specimens of two different 2×2 twill weave fabrics, unsheared and after
undergoing shear to a maximum angle of -40, characterised by the superficial densities, S0; relative changes in
average yarn width, wy/wy, are also given; average values and standard deviations are given where appropriate.
fabric
S0 / g/m 2
clamped along
wy / mm (warp)
wy / wy
wy / mm (weft)
wy / wy
unsheared max. -40 unsheared max. -40
660 warp 2.534 0.079 2.309 0.079 -9 % 2.501 0.065 2.262 0.065 -10 %
weft 2.595 0.096 2.344 0.076 -10 % 2.459 0.098 2.242 0.115 - 9 %
285 warp 2.640 0.147 2.403 0.173 -9 % 2.412 0.188 2.268 0.255 -6 %
[image:34.595.55.540.178.290.2]weft 2.620 0.156 2.415 0.106 -8 % 2.433 0.237 2.306 0.168 -5 %
Table 2. Measured principal permeability values, K1 and K2, angle indicating the orientation of K1 relative to
the fabric weft direction, and ratio, K1/K2, for a 2×2 twill weave fabric (S0 = 660 g/m 2
) at a given fibre volume
fraction, Vf = 0.56; average values, standard deviations and coefficients of variation (standard deviation /
average value) are given where appropriate.
history K1 / 10
-10
m2 K2 / 10 -10
m2 K1 / K2
unsheared 0.513 0.102
(20 %)
0.354 0.070 (20 %)
-39 15 1.457 0.179 (12 %)
sheared, clamped weft, max. -20
0.732 0.198 (27 %)
0.490 0.050 (10 %)
-32 30 1.535 0.596 (39 %)
sheared, clamped weft, max. -40
0.864 0.041 (5 %)
0.589 0.016 (3 %)
85 29 1.468 0.098 (7 %)
sheared, clamped warp, max. +10
0.693 0.239 (34 %)
0.387 0.073 (19 %)
109 23 1.756 0.362 (21 %)
sheared, clamped warp, max. -40
0.947 0.208 (22 %)
0.652 0.038 (6 %)
[image:34.595.104.494.451.640.2]2 Table 3. Measured principal permeability values, K1 and K2, angle indicating the orientation of K1 relative to
the fabric weft direction, and ratio, K1/K2, for a 2×2 twill weave fabric (S0 = 285 g/m2) at a given fibre volume
fraction, Vf = 0.40; average values, standard deviations and coefficients of variation (standard deviation /
average value) are given where appropriate.
history K1 / 10
-10
m2 K2 / 10 -10
m2 K1 / K2
unsheared 3.645 0.438
( 12 %)
2.237 0.248
( 11 %)
1 14 1.650 0.289
( 18 %)
Table 4. Predicted permeability values, Kx and Ky, corresponding to the directions indicated in Figure 15, and
ratio Kx/Ky, for specimens of 2×2 twill weave fabric with S0 = 660 g/m 2
with different shear history and different
nesting configuration; fibre volume fraction Vf = 0.56; average values, standard deviations and coefficients of
variation (standard deviation / average value) are given where appropriate.
history nesting Ky / 10
-10
m2 Kx / 10
-10
m2 Kx / Ky
unsheared
zero 0.41 0.53 1.31
random 0.57 0.08 ( 14 %)
0.68 0.06 ( 8 %)
1.22 0.19 ( 15 %)
sheared, clamped weft, max. -20
zero 0.42 0.60 1.43
random 0.64 0.07 ( 10 %)
0.78 0.07
( 9 %)
1.24 0.20
( 16 %)
sheared, clamped weft, max. -30
zero 0.50 0.86 1.71
random 0.84 0.11 ( 13 %)
1.14 0.10 ( 9 %)
1.37 0.22 ( 16 %)
sheared, clamped weft, max. -40
zero 1.05 1.64 1.56
random 1.35 0.14 ( 10 %)
1.82 0.22
( 12 %)
1.37 0.30
[image:35.595.90.509.402.629.2]3 Table 5. Predicted permeability values, Kwarp and Kweft, and ratio Kweft/Kwarp, for specimens of 2×2 twill weave
fabric with S0 = 285 g/m 2
with different shear history and different nesting configuration; fibre volume fraction
Vf = 0.40; average values, standard deviations and coefficients of variation (standard deviation / average value)
are given where appropriate.
history nesting Kwarp / 10
-10
m2 Kweft / 10
-10
m2 Kweft / Kwarp
unsheared
zero 2.20 4.08 1.86
random 2.50 0.18 ( 7 %)
3.96 0.51 ( 13 %)
1.59 0.22 ( 14 %)
sheared, clamped warp, max. -40
zero 3.69 5.33 1.44
random 4.55 0.48 ( 11 %)
5.50 0.50 ( 9 %)