R E S E A R C H A R T I C L E
Open Access
A comparative view of early development
in the corals
Favia lizardensis
,
Ctenactis
echinata
, and
Acropora millepora
-morphology, transcriptome, and
developmental gene expression
Nami Okubo
1,3*, David C. Hayward
1, Sylvain Forêt
1,2and Eldon E. Ball
1,2*Abstract
Background:Research into various aspects of coral biology has greatly increased in recent years due to anthropogenic threats to coral health including pollution, ocean warming and acidification. However, knowledge of coral early development has lagged. The present paper describes the embryonic development of two previously uncharacterized robust corals,Favia lizardensis(a massive brain coral) andCtenactis echinata(a solitary coral) and compares it to that of the previously characterized complex coral,Acropora millepora, both morphologically and in terms of the expression of a set of key developmental genes.
Results:Illumina sequencing of mixed age embryos was carried out, resulting in embryonic transcriptomes consisting of 40605 contigs forC.echinata(N50 = 1080 bp) and 48536 contigs forF.lizardensis(N50 = 1496 bp). The transcriptomes have been annotated against Swiss-Prot and were sufficiently complete to enable the identification of orthologs of many key genes controlling development in bilaterians. Developmental series of images of whole mounts and sections reveal that the early stages of both species contain a blastocoel, consistent with their membership of the robust clade. In situ hybridization was used to examine the expression of the developmentally important genesbrachyury,chordin andforkhead. The expression ofbrachyuryandforkheadwas consistent with that previously reported forAcroporaand allowed us to confirm that the pseudo-blastopore sometimes seen in robust corals such asFaviaspp. is not directly associated with gastrulation.C.echinata chordinexpression, however, differed from that seen in the other two corals. Conclusions:Embryonic transcriptomes were assembled for the brain coralFavia lizardensisand the solitary coral Ctenactis echinata. Both species have a blastocoel in their early developmental stages, consistent with their phylogenetic position as members of the robust clade. Expression of the key developmental genesbrachyury, chordinandforkheadwas investigated, allowing comparison to that of their orthologs inAcropora,Nematostellaand bilaterians and demonstrating that even within the Anthozoa there are significant differences in expression patterns.
Keywords:Coral development,Favia,Ctenactis,Acropora, Transcriptome, In situ hybridization,brachyury,chordin,forkhead
* Correspondence:[email protected];[email protected]
1
Evolution, Ecology and Genetics, Bldg 46, Research School of Biology, Australian National University, Canberra, ACT 0200, Australia Full list of author information is available at the end of the article
Background
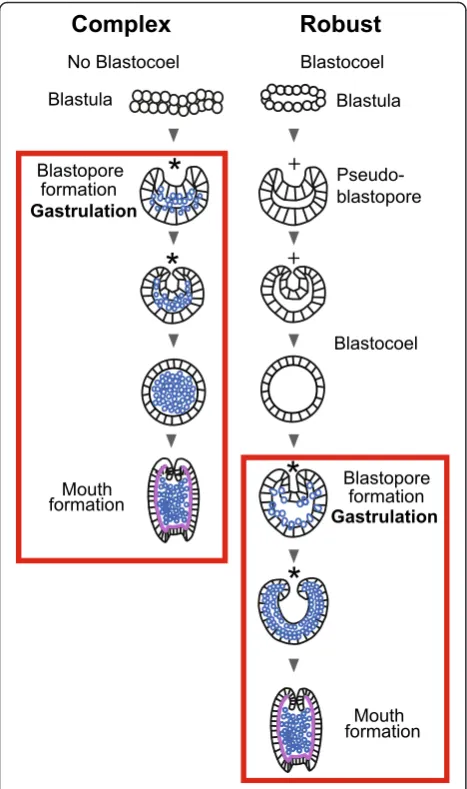
Molecular phylogenetic studies show that the stony corals (Scleractinia) include two large clades, the “ com-plex” and “robust” [1–5]. Although molecular analyses consistently support this dichotomy, morphological sup-port based on adult anatomy is lacking. However, each clade has a characteristic pattern of embryonic develop-ment [6, 7]. In most of the complex corals which have been studied there is either no, or only a minimal, blas-tocoel prior to gastrulation, giving rise to the term “prawn chip” for the flattened cellular bilayer that is present in the genusAcropora[8–10]. In contrast to the complex corals, robust corals form an obvious blastocoel before gastrulation (reviewed in [7]). Commonly, these blastocoel stage embryos develop a depression in their surface and resemble in shape gastrulating embryos of complex corals. However, at this stage they are com-posed of a single cell layer surrounding the blastocoel; they subsequently resume a spheroidal shape before forming a blastopore and undergoing gastrulation.
We recently used in situ hybridization to characterize the expression of Acropora millepora orthologs of sev-eral genes that play key roles in bilaterian gastrulation and axis formation including brachyury, chordin and forkhead[11]. Brachyury is a member of the T-box tran-scription factor family which in vertebrates is expressed around the blastopore at gastrulation, then in involuting mesoderm and finally in the notochord (reviewed in [12]). Studies in diverse organisms (e.g. mouse [13, 14] and ctenophore [15, 16]) suggest that its universal role is in the regulation of genes involved in cell adhesion and the control of morphogenetic movements.
Chordin is the product of the vertebrate ortholog of the Drosophila short gastrulation gene. It is an antagonist of
BMP2/4;chordinandbmp2/4genes are involved in deter-mining the dorsal/ventral axis in all bilaterians, but with an axis inversion unique to chordates [17, 18].
Fox (or Forkhead) genes encode a large and ancient family of transcription factors which is united by the presence of the winged helix domain. Members of the FoxA subfamily have diverse functions including acting as “pioneer” transcription factors which facilitate the remodelling of chromatin and the actions of nuclear receptors, with their many roles. In mammals FoxA genes are important in the development of several endo-dermally derived organs including lung and liver (reviewed in [19]).
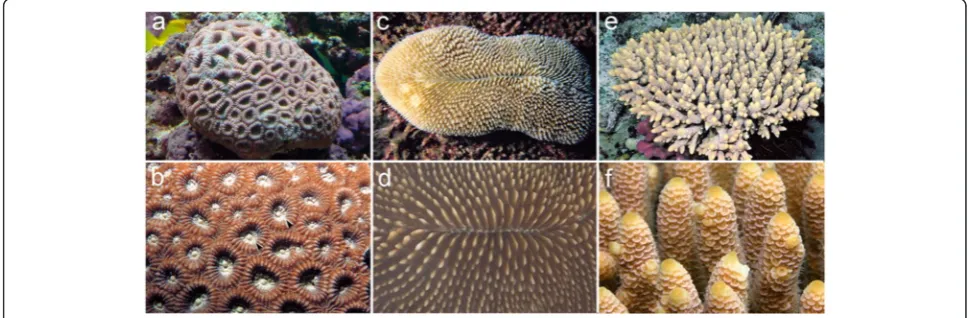
In the present study we first describe the early embry-onic development of two robust coral species with very distinctive adult morphologies and previously uninvesti-gated developmental morphologies, Favia lizardensis and Ctenactis echinata. F.lizardensis is a massive brain coral (Fig. 1a, b),C.echinatais a solitary coral (Fig. 1c, d) and the previously characterised A.millepora is a stag-horn coral (Fig. 1e, f ). We then used RNASeq and de novo assembly to generate transcriptome assemblies from C.echinata and F.lizardensis embryos and identi-fied orthologs of all three of the genes previously charac-terised in A. millepora. This information allowed us to carry out in situ hybridizations revealing both conserved and novel patterns of gene expression.
Methods
Embryo collection
Several specimens of F.lizardensis and C.echinata were collected near the Sesoko Marine Biological Laboratory in Okinawa, Japan (26°38′ N, 127°52′ E) in July, 2009. They were brought to the laboratory and placed in tubs
[image:2.595.55.540.506.665.2]before the predicted time of spawning. C.echinata spawned from 23:00–24:00 on July 14, and different pairs of F.lizardensis colonies spawned on July 20, 21 and 22, 2009. Gametes of each species were gently stirred to mix the bundles and ensure fertilization. Fertil-ized eggs were placed into 2.5 L containers in filtered sea water and development allowed to proceed. For ob-servation, approximately 50 eggs or embryos were placed in a 75-mm Petri dish under a light microscope. The water temperature was maintained at 26.0 to 26.5 °C throughout the period of observation and culture. Staged embryos were harvested and either snap frozen in liquid nitrogen, and stored at−80 deg C until used for nucleic acid extraction, or fixed for 20–40 min in 3.7 % formal-dehyde in filtered HEPES buffered seawater (pH 8.0), and stored in 100 % methanol at−20 deg C until further treatment.
Adult coral colonies were collected with permission of the Agriculture, Forestry and Fisheries Department of the Okinawa Prefectural Government. No permit is required for collecting coral embryos in Japan. Permission numbers for F.lizardensis and C.echinata are “21–22”. Embryos were imported into Australia under CITES permit T-AG-09-500096 where the studies were carried out.
Morphology
Further observations were made and photos taken of embryos fixed with paraformaldehyde and stored in methanol at−20 deg C. Embryos of both species are suf-ficiently large to allow freehand cutting with a micro-knife; such sections are often more informative than embedded, sectioned material, as the plane of section is more easily determined.
RNA isolation
Total RNA was prepared using Tri Reagent (Ambion) based on the method of Chomczynski and Sacchi [20]. Total RNA was prepared from F.lizardensis gastrula stage embryos. For C.echinata, total RNA was prepared separately from fertilized eggs, morula, and gastrula stage embryos. Equal amounts of RNA from each of these stages were pooled. Poly (A) + RNA was prepared using the Dynabeads mRNA purification kit (Life Technologies).
High-throughput sequencing
Libraries were prepared for 76 bp paired end sequencing with the mRNA-Seq Sample Prep Kit (Illumina) using 100 ng poly(A) + RNA. TheF.lizardensis library was se-quenced by Macrogen Inc, Seoul, South Korea. The C.echinatalibrary was sequenced at the Biomolecular Re-source Facility, JCSMR, ANU. Sequences were trimmed with libngs [21] using a minimum length of 40 bp and minimum quality score of 15. The assemblies were gener-ated with the Trinity assembler (r2013-12-16) [22], with
default parameters, discarding contigs shorter than 200 bp. After assembly, redundant sequences were re-moved using cdhit-est (4.6.1) [23] with a minimum simi-larity of 90 % and a word size of 8 bp.
To assess the quality of the transcriptome assemblies, reciprocal blast searches were carried out with proteome databases from the sea anemone Nematostella vectensis (downloaded from UniProt [24]) and the coral A.mille-pora [25] using an evalue cutoff of 10−6. The transcrip-tomes were also searched with the CEGMA 248 eukayotic core genes dataset [26] using tblastn with an evalue cutoff of 10−10. The coverage of these genes in the transcriptomes was measured by dividing the length of the alignment of the top blast hit by the query length. The transcriptomes were annotated using the top hits of blastx searches (evalue cutoff 10−6) against the Uni-ProtKB/Swiss-Prot database [27].
cDNA and PCR
First strand cDNA was made from total RNA using Pri-meScript reverse transcriptase (Takara Bio) and an oligo d(T) primer (oligo d(T)20VN) according to the manu-facturer’s protocol. Candidate target transcripts were identified in the transcriptome assemblies with local blast (NCBI) and PCR primers were designed manually or using MacVector (MacVector, Inc). PCR was carried out using Platinum Taq DNA Polymerase High Fidelity (Life Technologies). PCR products were purified using the QIAquick PCR Purification Kit (Qiagen) and ligated into pGEM-T Easy (Promega). Plasmids were sequenced with vector and internal primers using Big Dye Termin-ator v3.1 (Applied Biosystems) and reactions were run on an ABI 3730 at the Biomolecular Resource Facility, JCSMR, ANU. Sequence analyses and alignments were carried out using DNASTAR (Lasergene) and MacVec-tor (MacVecMacVec-tor Inc).
In situ hybridization
Digoxygenin (DIG) labelled RNA probes were made from linearized plasmid templates. Hybridization conditions were as described in [28]. DIG labelling was detected with an alkaline phosphatase conjugated anti-DIG antibody (Roche) using BCIP/NBT substrate mix (Vector SK-5400). Embryos were dehydrated and cleared through a glycerol dehydration series, mounted on microscope slides in 90 % glycerol and digital images were captured with a Spot camera mounted on a Wild Photomakroskop. Digitized images were processed using Adobe Photoshop.
Results
Morphological comparisons
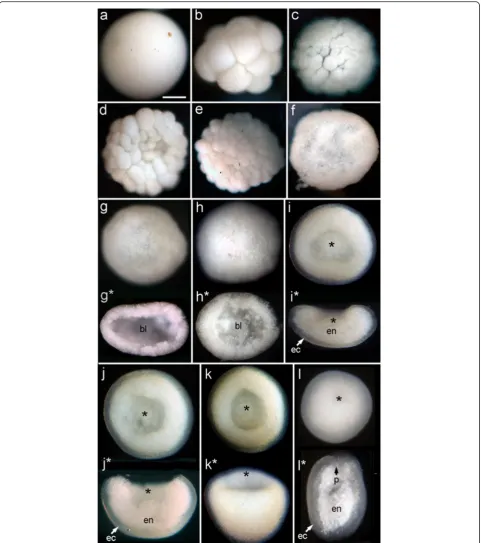
through a greater number of distinctly recognizable mor-phological stages, several of which have an obvious blasto-coel, before gastrulation occurs. In some species this includes formation of a temporary depression, which we have termed a pseudo-blastopore [6], before a hollow spheroidal shape is resumed leading into true gastrulation. The morphological development ofF.lizardensisis shown in Fig. 3, and that ofC.echinatain Fig. 4. Detailed descrip-tions are given in the figure capdescrip-tions. Note that there is a considerable size difference between comparable stages of the three species. For example, diameters of fixed eggs are: A.millepora (470 um), F.lizardensis (390 um), and
C.echinata(260 um); other stages maintain approximately the same size ratios.
Transcriptomes
RNA prepared from embryonic stages of C.echinata and F.lizardensiswas processed for Illumina sequencing. After removal of low quality data (length <40 bp or quality score <15), 18 million paired end reads (2.8 Gbp), and 23 million paired end reads (3.5 Gbp) were obtained for C.echinata andF.lizardensis, respectively. After assembly, this resulted in 40605 contigs (28 Mbp) for C.echinata, and 48536 contigs (40 Mbp) forF.lizardensis(Table 1).
The contig size distribution is shown in Additional file 1. While the average (mean) contig lengths are 708 bp and 834 bp forC.echinataand F.lizardensis respectively, indi-cating that the size distribution is weighted towards smaller sized contigs, the N50 value is 1080 bp forC.echinataand 1496 bp for F.lizardensis. These values are similar to, or larger than, those for several other short read coral tran-scriptome assemblies [29–32].
The quality of the assemblies was assessed in a num-ber of ways. Blast searches were carried out using pro-teomes from two cnidarian species, N. vectensis (24435 sequences) [33] andA.millepora (26622 sequences) [25] (Additional file 2). Approximately 50 % of the F.lizar-densis contigs and 56 % of the C.echinata contigs had hits (evalue <10−6) in the A.millepora proteome. The values for searches against the N.vectensis proteome were 46 and 40 % for C.echinata and F.lizardensis, respectively. In reciprocal searches, approximately 79 % of sequences in the A.millepora proteome had hits in the C.echinata transcriptome and 84 % had hits in the F.lizardensis transcriptome. For N.vectensis, the values were 76 and 77 % for searches against C.echinata and F.lizardensis,respectively. The higher values achieved by searching the transcriptome sequences with the prote-ome sequences is not unexpected since many of the assembled transcriptome sequences are short, and are likely to represent non-coding regions or incomplete open reading frames. The transcriptomes were also searched with a highly conserved set of 248 core eukaryotic proteins [34, 35]. Over 98 % of these were identified in both transcriptomes. The length of the best match was compared to the query length to assess the coverage of the core proteins in the transcriptomes (Additional file 3). The majority of the core proteins were covered by more than 80 % in both transcriptomes. Finally, to annotate the transcriptomes, the assemblies were searched against the UniProtKB/Swiss-Prot data-base [27] using blastx (evalue < 10−6). 39.4 % (16007 con-tigs) of the C.echinata contigs and 32.5 % (15716 contigs) of the F.lizardensis contigs could be annotated (Additional files 4 and 5).
[image:4.595.57.291.261.656.2]Developmental gene sequences
Blast searches were carried out for developmentally im-portant sequences associated with gastrulation and axis determination and orthologous to ones previously charac-terized inAcropora. Orthologs ofbrachyury,forkheadand chordinwere identified in both theC.echinataand F.lizar-densis transcriptomes. Alignments of the predicted pro-teins with those from A.millepora and N.vectesis are shown in Additional files 6, 7 and 8. TheC.echinata and F.lizardensissequences share a higher level of amino acid identity with each other than they do with theA.millepora sequences, consistent with their phylogenetic relation-ships. To isolate template sequences for RNA probe pro-duction, PCR primers were used to amplify products from embryonic cDNA (Additional files 9 and 10).
Gene expression patterns
Figures 5, 6 and 7 compare patterns of embryonic gene expression in the three species.
Brachyury expression
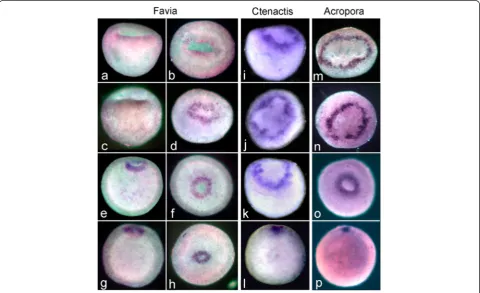
In bothF.lizardensis(Fig. 5a-h) andC.echinata(Fig. 5i-l) the earliest brachyury expression occurs on the rim of the bowl-shaped gastrula as it is elongating in the future oral-aboral axis and the central depression is deepening. This circular expression pattern is similar to the expres-sion of A.millepora brachyury (Ambra), which appears as the embryo is rounding up at the end of the prawn chip stage (Fig. 5m, see also [11]). In all species and stages expression is limited to a circle around the blasto-pore, which steadily decreases in circumference as the blastopore closes.
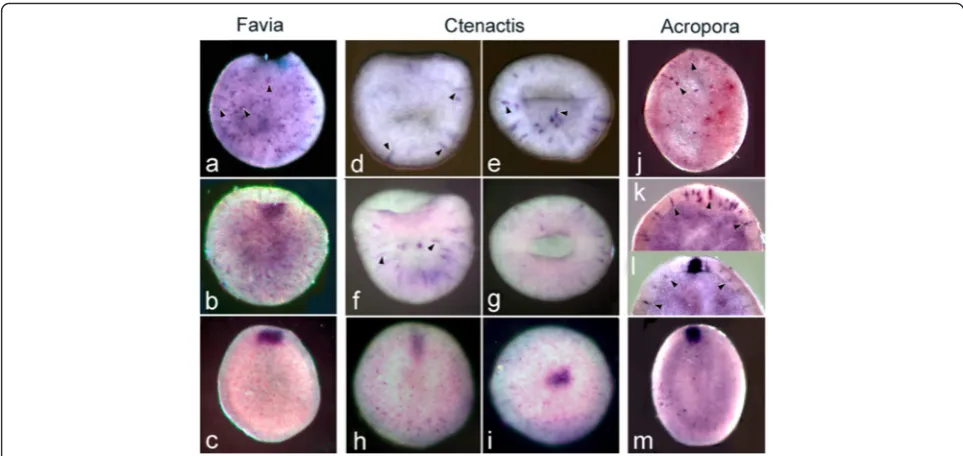
Forkhead expression
The earliest forkhead expression in all three species oc-curs in isolated ectodermal cells as the blastopore is closing (arrowheads in Fig. 6a, d, e, f, j, k, l) with these cells apparent slightly earlier in C.echinata relative to blastopore closure (Fig. 6d, e). Expression then appears
in the ectoderm surrounding the closing blastopore/ opening oral pore (Fig. 6c, h, i, m).
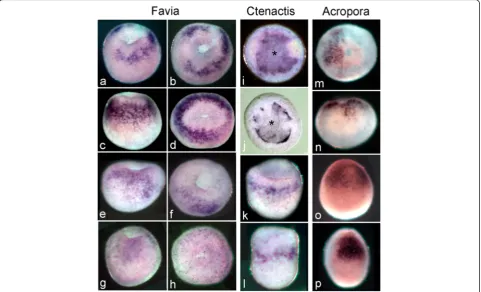
Chordin expression
Expression of chordin in F.lizardensis is variable in ex-tent. The embryos shown in Fig. 7a-f are all similar in age, yet the oral views (Fig. 7b, d, f ) reveal considerable differences inchdexpression; a half circle plus a separate patch of expression (Fig. 7b), a complete circle around the closing blastopore with one area of weaker expres-sion (Fig. 7d), and asymmetric expresexpres-sion on one side of the blastopore (Fig. 7f, g), which becomes weaker as the blastopore closes (Fig. 7g, h).
Chordin expression in C.echinata first appears over a broad area of tissue on one side of the flattened blastula, corresponding to the area which will invaginate to form the endoderm (Fig. 7i). Slightly later, as the presumptive
endoderm moves aborally relative to the surrounding ectoderm, the general expression fades and becomes limited to the inner margins of the rim of the bowl-shaped structure that is being created (Fig. 7j). As the embryo continues to elongate in the oral/aboral axis the ring of ectodermal expression is shifted aborally, away from the rim of the bowl (Fig. 7k, l). Expression con-tinues as a ring in the ectodermal walls of a vase-shaped structure, even as the embryo elongates to form a pla-nula (Fig. 7l).
[image:7.595.59.530.99.141.2]In A.millepora, chordin expression begins in scattered cells around the blastopore [11] before becoming local-ized to one side (Fig. 7m). Slightly later expression be-comes more widespread, both in terms of the number of cells and their distribution (Fig. 7n, o). As the spherical embryo elongates in the oral/aboral axis to form a pla-nula larva, expression is limited to a patch of oral
Table 1Transcriptome assembly details
Reads Contigs Mean length (nt) N50 (nt) Longest transcript (nt)
Ctenactis echinata 18506158 40605 708 1080 11258
Favia lizardensis 22361373 48536 834 1496 16006
Fig. 5Brachyuryexpression compared in the 3 species. The youngest embryos are at the top of the figure and the oldest at the bottom. In
F.lizardensis, age matched embryos are shown in lateral view on the left and oral view on the right. The earliest expression seen is on the rim of the bowl-shaped embryo surrounding the blastopore (a-b). Expression continues around the blastopore/oral pore, as it closes (c-h).C.echinata
[image:7.595.58.539.372.665.2]ectoderm covering approximately one-third of the cir-cumference of the embryo (Fig. 7p). Expression disap-pears entirely by the time of settlement (not shown).
Discussion
The only genomic/transcriptomic resource available for corals closely related to the two studied here is a tran-scriptome constructed from two adultFaviaof undeter-mined species from the Red Sea [31]. Here we report embryonic transcriptome assemblies for C.echinataand F.lizardensis. A comparison with other cnidarian data-sets and with the CEGMA database indicates that these assemblies present a comprehensive picture of early de-velopmental transcriptomes in these species.
In all recent coral phylogenies, the genera Favia and Ctenactisare grouped among the robust corals, well sepa-rated from the complex corals such as Acropora. Unsur-prisingly, this is reflected in the genes studied here, which are usually regarded as being highly conserved. This is es-pecially true ofbrachyury andforkhead, which have long stretches of identical sequence for the three corals. Not only this, but orthologous genes in the three corals are more similar to each other than they are to their N.vecten-sis orthologs, again consistent with phylogeny. It is clear
thatchordinis the least conserved of the genes considered here, in both sequence and expression.
In addition to being the best non-scleractinian se-quence comparator for corals, N.vectensis is also the most relevant comparator for expression patterns and for function, so those two topics will be discussed to-gether below.
[image:8.595.56.538.87.315.2]NvBra expression surrounds the blastopore in N.vec-tensis [36, 37] as does its ortholog inA.millepora,where it demarcates the ectoderm from the presumptive endo-derm; the latter defined by the expression of Amsnail [11, 38]. This expression is consistent with the role of brachyury in the ctenophore Mnemiopsis, where func-tional tests have demonstrated that it is involved in the regulation of the morphogenetic movements involved in gastrulation [16] and in the mouse, where mutant stud-ies have demonstrated that the primitive streak is con-densed and thickened [14, 39]. In both cases Brachyury is believed to affect cell movements by regulating the ex-pression of cell adhesion genes [13, 16]. In the robust corals also, brachyury is associated with the blastopore during gastrulation. The association of early brachyury expression with the start of gastrulation is confirmed by comparison to the wholemounts and sections shown in Figs. 3 and 4. Figure 4k in particular shows that blastula
Fig. 6Forkheadexpression compared in the three species, each of which is arranged in order of age. (a) InF.lizardensisthe earliest expression is in scattered ectodermal cells (arrowheads) as the blastopore is closing. (b) A little later in development an area of contiguous expression appears in cells on the rim of the blastopore. (c) Expression continues in the oral pore as the sphere elongates to become an early planula. InC.echinata
stageC.echinataform a hollow sphere before the begin-ning of gastrulation, in contrast to A.millepora, which only assumes a spherical shape near the completion of gastrulation (Fig. 5o, p)
InN.vectensis, forkhead is expressed around the blas-topore in a pattern very similar to that ofbrachyury. In-deed, Fritzenwanker et al. [40] described the two genes as “an evolutionarily ancient synexpression group in Eumetazoa”, while Magie et al. [41] hypothesized that N.vectensis FoxA defined the ectoderm/endoderm boundary on the basis of double in situs. However, in a more recent study Röttinger et al. [37] demonstrated that brachyury expression starts earlier than that of FoxAinN.vectensis, as is the case inA.millepora, where the expression of forkhead (Amfkh) in the blastopore/ oral pore occurs later than that of Ambra, toward the end of gastrulation [11]. Expression in A.millepora is also seen in scattered ectodermal cells either before or in association with the start of expression around
the blastopore [11] (Fig. 6). The expression of fork-head in the robust corals is similar to that in A.mille-pora, in both scattered ectodermal cells, and around the blastopore. Examination of the sequences shown in Additional file 7 reveals that the coral sequences are very highly conserved, while that of N.vectensis shows some significant divergence. These observations raise the possibility that we are dealing with a paralo-gous sequence, rather than a true ortholog, in N.vec-tensis. However, no other N.vectensis sequence gives as good a match as the one shown. Another possibil-ity for explaining the differing expression in the two species is the co-option of the coral forkhead gene to a second function in single cells.
The important patterning role of chordin as an antag-onist of BMP2/4 has been well characterized in several bilaterians (reviewed in [17, 18]) as well as inN.vectensis. The expression and role of chordin in N.vectensis have been reported [37, 42–45]. The most surprising finding
[image:9.595.58.540.89.381.2]of these studies is that Nvbmp2/4 and Nvchd are expressed at the same end of the directive axis [42, 44], which is orthogonal to the oral-aboral axis, in contrast to their deployment in bilaterians. Genikhovich et al. [46] have recently built on previous work to argue that the interaction between chordin and BMP2/4 is critical in determining the zones of expression of other genes involved in patterning the directive axis of N.vectensis. They conclude that it is the positioning of chordin that is critical and that the maximum of BMP2/4 signalling will always be opposite the chordin expression domain regardless of the spatial expression pattern of BMP2/4. The earliest chordin expression pattern reported for N.vectensis is a ring surrounding the area where the blastopore will form [37], while the earliest reported by Rentzsch et al. in N.vectensis[42] and Hayward et al. in A.millepora[11] is in the form of scattered cells centered on the blastopore prior to its closure. Slightly later, but still before blastopore closure, this expression becomes localized to one side of the blastopore. Then, as the pla-nula forms, this expression becomes localized to an ecto-dermal patch toward the oral end in both organisms. There is some variability in the expression ofF.lizardensis chordin(Flchd). Some specimens show a complete or par-tial ring around the blastopore, while in others there is asymmetric expression in a localized patch on one side of the embryo. It is unclear whether this variability repre-sents different stages of a rapidly changing expression pat-tern or is due to a lesser staining sensitivity in some individuals. In C.echinata, chordin expression appears earlier, at the blastula stage in a zone corresponding to the region which will invaginate. As gastrulation proceeds this generalized expression fades, remaining intense only at the border of the invaginating region (Fig. 7j). While there may be some asymmetry in the expression pattern at this stage, as gastrulation continues and the central depression deepens, expression takes the form of a complete ring around the blastopore with no sign of asymmetry. Since restricted localization of chordin expression is critical to axial patterning in embryonicNematostella, the apparent lack of restricted localization inC.echinata is puzzling. It is possible that the C.echinata embryos available to us may all be younger than a presumed critical period or that such a critical period occurred between the ages of em-bryos available to us. A more comprehensive in situ hybridization series combined with functional studies will be required to resolve this question.
Conclusions
The solitary coral Ctenactis echinata and the brain coral Favia lizardensis, like other robust corals, have a well developed blastocoel before gastrulation. As-sembly of embryonic transcriptomes for both species facilitated the isolation of sequences corresponding to
key developmental genes. Expression of brachyury, chordin and forkhead was investigated, allowing com-parison to that of their orthologs in Acropora and Nematostella. All three corals exhibit early forkhead expression in scattered ectodermal cells, a pattern that has not been reported in N. vectensis. In the de-velopmental stages of C.echinata and F.lizardensis that we were able to examine the expression of chor-din does not show the overt asymmetry seen in Acro-pora and Nematostella. The conserved association of brachyury expression with the blastopore, in addition to the morphological studies, confirms that the early concavity in the blastula stage of robust corals (the pseudo-blastopore) does not indicate the onset of gastru-lation. The expression of forkhead (FoxA) in isolated ectodermal cells, as well as around the blastopore, in all corals so far examined and in contrast toNematostella,as well as the very different expression ofCtenactis chordin, accentuate the need for further comparative studies of cnidarian development if we are to achieve a comprehen-sive understanding of the evolution of this process.
Availability of supporting data
The data are available from the NCBI TSA database; Project ID PRJNA297488.
Additional files
Additional file 1:Distribution of assembled contig lengths.
(PDF 328 kb)
Additional file 2:Reciprocal blast searches withAcroporaand
Nematostellaproteomes.(PDF 393 kb)
Additional file 3:Coverage of 248 core eukaryotic proteins in the
C.echinataandF.lizardensistranscriptomes.The human set of the core protein dataset was used for the analysis. (PDF 395 kb)
Additional file 4:C.echinata transcriptome annotation.Results of blastx search (e < 10−6) against the UniProtKB/Swiss-Prot database. (CSV 2894 kb)
Additional file 5:F.lizardensistranscriptome annotation.Results of blastx search (e < 10−6) against the UniProtKB/Swiss-Prot database. (CSV 2857 kb)
Additional file 6:Brachyury alignment.A. Alignment of brachyury sequences from:AmBra,Acropora millepora, KJ914894;Flbra,Favia lizardensis, this study;Cebra,Ctenactis echinata, this study;Nvbra,Nematostella vectensis, AAO27886. The Tbox domain region is outlined in red. B. Percentage amino acid identities between the sequences. Percentage amino acid similarities are shown in brackets. (PDF 1935 kb)
Additional file 7:Forkhead alignment.A. Alignment of forkhead sequences from:Amfkh,Acropora millepora, JT020561;Flfkh,Favia lizardensis, this study;Cefkh,Ctenactis echinata, this study;Nvfkh,
Nematostella vectensis, XP_001634555. The forkhead superfamily domain is outlined in red. B. Percentage amino acid identities between the sequences. Percentage amino acid similarities are shown in brackets. (PDF 1505 kb)
Additional file 8:Chordin alignment.A. Alignment of chordin sequences from:Amchd,Acropora millepora, JR985644;Flchd,Favia lizardensis, this study;Cechd,Ctenactis echinata, this study;Nvchd,
sequences. Percentage amino acid similarities are shown in brackets. (PDF 2911 kb)
Additional file 9:PCR primers.The sequences of PCR primers used to amplify products from first strand cDNA. (DOCX 47 kb)
Additional file 10:Fasta file of sequences of PCR products.
(TXT 7 kb)
Competing interests
The authors declare that they have no competing interests.
Authors’contributions
NO collected the material, constructed sequencing libraries and carried out the in situ hybridizations. SF assembled the transcriptomes and performed bioinformatic support. NO, DCH and EEB contributed equally to other aspects of the research and writing of the paper. All authors read and approved the final manuscript.
Acknowledgments
We thank the Australian Research Council for support through the Centre for Molecular Genetics of Development, the Centre of Excellence for Coral Reef Studies and Discovery Grant DP1095343. Nami Okubo’s research was supported by JSPS KAKENHI 15 K18599, Tokyo Keizai University (Research Grant 2015), and a grant from the Research Institute of Marine Invertebrates (Research Grant 2015KO-3). We thank the Biomolecular Resource Facility, JCSMR, ANU for DNA sequencing, and Daryl Webb and the Centre for Advanced Microscopy, ANU, for help with microscopy and the use of microscopes. We also thank Prof David Miller for helpful discussions and Kazuhiko Sakai and Yoshikatsu Nakano for their help with adult coral sampling.
Author details
1
Evolution, Ecology and Genetics, Bldg 46, Research School of Biology, Australian National University, Canberra, ACT 0200, Australia.2ARC Centre of
Excellence for Coral Reef Studies, James Cook University, Townsville, QLD 4811, Australia.3Current Address: Department of Economics, Tokyo Keizai
University, 1-7-34 Minamimachi, Kokubunji, Tokyo, Japan.
Received: 7 October 2015 Accepted: 12 February 2016
References
1. Romano SL, Palumbi SR. Evolution of scleractinian corals inferred from molecular systematics. Science. 1996;271:640–2.
2. Romano SL, Cairns SD. Molecular phylogenetic hypotheses for the evolution of scleractinian corals. Bull Mar Sci. 2000;67:1043–68.
3. Chen CA, Wallace CC, Wolstenholme J. Analysis of the mitochondrial 12S rRNA gene supports a two-clade hypothesis of the evolutionary history of scleractinian corals. Mol Phylogenet Evol. 2002;23:137–49.
4. Fukami H, Chen C, Budd A, Collins A, Wallace C, Chuang Y, et al. Mitochondrial and nuclear genes suggest that stony corals are monophyletic but most families of stony corals are not (Order Scleractinia, Class Anthozoa, Phylum Cnidaria). PLoS ONE. 2008;3:e3222.
5. Kitahara MV, Cairns SD, Stolarski J, Blair D, Miller DJ. A comprehensive phylogenetic analysis of the Scleractinia (Cnidaria, Anthozoa) based on mitochondrial CO1 sequence data. PLoS ONE. 2010;5:e11490. 6. Okubo N, Mezaki T, Nozawa Y, Nakano Y, Lien Y-T, Fukami H, et al.
Comparative embryology of eleven species of stony corals (Scleractinia). PLoS ONE. 2013;8:e84115.
7. Okubo N. Restructuring the traditional suborders in the order Scleractinia based on embryogenetic morphological characteristics. Zool Sci.2016;33:116-23. 8. Hayashibara T, Ohike S, Kakinuma Y. Embryonic and larval development and
planula metamorphosis of four gamete-spawning Acropora (Anthozoa, Scleractinia). Proc 8th Int Coral Reef Sym. 1997;2:1231–6.
9. Ball EE, Hayward DC, Reece-Hoyes JS, Hislop NR, Samuel G, Saint R, et al. Coral development: from classical embryology to molecular control. Int J Dev Biol. 2002;46:671–8.
10. Okubo N, Motokawa T. Embryogenesis in the reef-building coral Acropora spp. Zool Sci. 2007;24:1169–77.
11. Hayward DC, Grasso LC, Saint R, Miller DJ, Ball EE. The organizer in evolution-gastrulation and organizer gene expression highlight the
importance of Brachyury during development of the coral, Acropora millepora. Dev Biol. 2015;399:337–47.
12. Smith J. Role of T-Box Genes During Gastrulation. In: Stern C, editor. Gastrulation: from Cells to Embryo. New York: Cold Spring Harbor Press; 2004. p. 571–80. 13. Yanagisawa KO, Fujimoto H. Differences in rotation-mediated aggregation
between wild-type and homozygous Brachyury (T) cells. J Embryol Exp Morphol. 1977;40:277–83.
14. Yanagisawa KO, Fujimoto H, Urushihara H. Effects of the brachyury (T) mutation on morphogenetic movement in the mouse embryo. Dev Biol. 1981;87:242–8.
15. Yamada A, Pang K, Martindale MQ, Tochinai S. Surprisingly complex T-box gene complement in diploblastic metazoans. Evol Dev. 2007;9:220–30. 16. Yamada A, Martindale MQ, Fukui A, Tochinai S. Highly conserved functions
of the Brachyury gene on morphogenetic movements: insight from the early-diverging phylum Ctenophora. Dev Biol. 2010;339:212–22. 17. Holley SA, Jackson PD, Sasai Y, Lu B, De Robertis EM, Hoffmann FM, et al.
A conserved system for dorsal-ventral patterning in insects and vertebrates involving sog and chordin. Nature. 1995;376:249–53.
18. Arendt D, Nübler-Jung K. Comparison of early nerve cord development in insects and vertebrates. Development. 1999;126:2309–25.
19. Hannenhalli S, Kaestner KH. The evolution of Fox genes and their role in development and disease. Nat Rev Genet. 2009;10:233–40.
20. Chomczynski P, Sacchi N. Single-step method of RNA isolation by acid guanidinium thiocyanate-phenol-chloroform extraction. Anal Biochem. 1987;162:156–9.
21. GitHub. https://github.com/sylvainforet/libngs. Accessed 2 Oct 2015. 22. Grabherr MG, Haas BJ, Yassour M, Levin JZ, Thompson DA, Amit I, et al.
Full-length transcriptome assembly from RNA-Seq data without a reference genome. Nat Biotechnol. 2011;29:644–52.
23. Fu L, Niu B, Zhu Z, Wu S, Li W. CD-HIT: accelerated for clustering the next-generation sequencing data. Bioinformatics. 2012;28:3150–2.
24. Proteomes. http://www.uniprot.org/proteomes/. Accessed 4 Oct 2014. 25. Moya A, Huisman L, Ball EE, Hayward DC, Grasso LC, Chua CM, et al. Whole
transcriptome analysis of the coral Acropora millepora reveals complex responses to CO2-driven acidification during the initiation of calcification. Mol Ecol. 2012;21:2440–54.
26. CEGMA. http://korflab.ucdavis.edu/datasets/cegma/) Accessed 15 Jan 2015. 27. UniProt. http://www.uniprot.org/. Accessed 6 Nov 2014.
28. Hayward DC, Catmull J, Reece-Hoyes JS, Berghammer H, Dodd H, Hann SJ, et al. Gene structure and larval expression of cnox-2Am from the coral Acropora millepora. Dev Genes Evol. 2001;211:10–9.
29. Barshis DJ, Ladner JT, Oliver TA, Seneca FO, Traylor-Knowles N, Palumbi SR. Genomic basis for coral resilience to climate change. Proc Natl Acad Sci U S A. 2013;110:1387–92.
30. Libro S, Kaluziak ST, Vollmer SV. RNA-seq profiles of immune related genes in the staghorn coral Acropora cervicornis infected with white band disease. PLoS ONE. 2013;8:e81821.
31. Pooyaei Mehr SF, DeSalle R, Kao H-T, Narechania A, Han Z, Tchernov D, et al. Transcriptome deep-sequencing and clustering of expressed isoforms from Favia corals. BMC Genomics. 2013;14:546.
32. Sun J, Chen Q, Lun JCY, Xu J, Qiu J-W. PcarnBase: development of a transcriptomic database for the brain coral Platygyra carnosus. Mar Biotech. 2013;15:244–51.
33. Putnam NH, Srivastava M, Hellsten U, Dirks B, Chapman J, Salamov A, et al. Sea anemone genome reveals ancestral eumetazoan gene repertoire and genomic organization. Science. 2007;317:86–94.
34. Parra G, Bradnam K, Korf I. CEGMA: a pipeline to accurately annotate core genes in eukaryotic genomes. Bioinformatics. 2007;23:1061–7.
35. Parra G, Bradnam K, Ning Z, Keane T, Korf I. Assessing the gene space in draft genomes. Nucleic Acids Res. 2009;37:289–97.
36. Scholz CB, Technau U. The ancestral role of Brachyury: expression of NemBra1 in the basal cnidarian Nematostella vectensis (Anthozoa). Dev Genes Evol. 2003;212:563–70.
37. Röttinger E, Dahlin P, Martindale MQ. A framework for the establishment of a cnidarian gene regulatory network for“endomesoderm”specification: the inputs of ß-catenin/TCF signaling. PLoS Genet. 2012;8:e1003164. 38. Hayward DC, Miller DJ, Ball EE. snail expression during embryonic
development of the coral Acropora: blurring the diploblast/triploblast divide? Dev Genes Evol. 2004;214:257–60.
40. Fritzenwanker JH, Saina M, Technau U. Analysis of forkhead and snail expression reveals epithelial-mesenchymal transitions during embryonic and larval development of Nematostella vectensis. Dev Biol. 2004;275:389–402. 41. Magie CR, Daly M, Martindale MQ. Gastrulation in the cnidarian
Nematostella vectensis occurs via invagination not ingression. Dev Biol. 2007;305:483–97.
42. Rentzsch F, Anton R, Saina M, Hammerschmidt M, Holstein TW, Technau U. Asymmetric expression of the BMP antagonists chordin and gremlin in the sea anemone Nematostella vectensis: implications for the evolution of axial patterning. Dev Biol. 2006;296:375–87.
43. Matus DQ, Pang K, Marlow H, Dunn CW, Thomsen GH, Martindale MQ. Molecular evidence for deep evolutionary roots of bilaterality in animal development. Proc Natl Acad Sci U S A. 2006;103:11195–200. 44. Matus DQ, Thomsen GH, Martindale MQ. Dorso/ventral genes are
asymmetrically expressed and involved in germ-layer demarcation during cnidarian gastrulation. Curr Biol. 2006;16:499–505.
45. Saina M, Genikhovich G, Renfer E, Technau U. BMPs and chordin regulate patterning of the directive axis in a sea anemone. Proc Natl Acad Sci U S A. 2009;106:18592–7.
46. Genikhovich G, Fried P, Prünster MM, Schinko JB, Gilles AF, Fredman D, et al. Axis Patterning by BMPs: Cnidarian Network Reveals Evolutionary Constraints. Cell Rep. 2015;10:1646–54.
47. Favia lizardensis. http://coral.aims.gov.au/factsheet.jsp?speciesCode=0151. Accessed 20 July 2015.
48. Ctenactis echinata. http://coral.aims.gov.au/factsheet.jsp?speciesCode=0172. Accessed 20 July 2015.
49. Acropora millepora. http://coral.aims.gov.au/factsheet.jsp?speciesCode=0047. Accessed 20 July 2015.
• We accept pre-submission inquiries
• Our selector tool helps you to find the most relevant journal • We provide round the clock customer support
• Convenient online submission • Thorough peer review
• Inclusion in PubMed and all major indexing services • Maximum visibility for your research
Submit your manuscript at www.biomedcentral.com/submit