I
University of Southern Queensland
Faculty of Engineering and Surveying
Feasibility of Improved Traffic Flow on Cohoe
Street, Toowoomba by Intersection
Improvements
A dissertation submitted by
Miss Kelly Pearson
In fulfilment of the requirements of
Bachelor of Engineering (Civil)
I
Abstract
Traffic congestion is an ongoing issue for most Australian cities. With Australia’s
growing population congestion issues will only further deteriorate, as this
dissertation has found on Cohoe Street. Cohoe Street is section of the Warrego
Highway making it a key part of the transportation network in Toowoomba,
Queensland.
The three major intersections along the link, Tourist Road, Herries Street and
James Street, were modelled in SIDRA Intersection using data provided by the
Queensland Department of Transport and Main Roads. The results identified that
Tourist Road and James Street both have movements that are at or nearing
capacity. The sheer volume of through moving traffic on Cohoe Street was
determined as the likely cause for the large delays for turning vehicles at James
Street and Tourist Road.
Cohoe Street is a complex and challenging urban site due to the abutting land
uses (residential and commercial), vehicle composition, traffic volumes and road
classification. As such a number of potential solutions to improve the road link
were identified including methods such as, access control and introducing traffic
signals or roundabouts.
The options assessment identified the optimum solution as upgrading the existing
signalised intersection of Mackenzie and James Street (the Warrego Highway) in
combination with movement restrictions at Tourist Road and James Street.
The key benefits of implementing the recommendations outlined in this
dissertation include the potential for improved safety, provision for enhanced
cyclist and pedestrian facilities and improved intersection efficiency and flow
University of Southern Queensland Faculty of Health, Engineering and Sciences
ENG4111/ENG4112 Research Project
Limitations of Use
The Council of the University of Southern Queensland, its Faculty of Health,
Engineering and Sciences, and the staff of the University of Southern Queensland, do not accept any responsibility for the truth, accuracy or completeness of material contained within or associated with this dissertation.
Persons using all or any part of this material do so at their own risk, and not at the risk of the Council of the University of Southern Queensland, its Faculty of Health, Engineering and Sciences or the staff of the University of Southern Queensland.
III
Candidates Certification
I certify that the ideas and experiential work, results, analysis and conclusions set
out in this dissertation are entirely my own effort, except where otherwise
acknowledged.
I further certify that the work is original and has not been previously submitted for
assessment in any other course or institution, except where previously stated.
Kelly Pearson
Student Number: 0061002991
____________________
Signature
____________________
Acknowledgements
I would like to acknowledge the following people for their contribution and
assistance in this research project,
• Ron Ayers, for his guidance as my supervisor throughout this project.
• My colleagues and Managers at the Department of Transport and Main Roads, for their assistance with data collection and resourcing throughout
this project.
V
Table of Contents
Abstract ... I
Candidates Certification ... III
Acknowledgements ... IV
Table of Contents ... V
List of Tables ... X
List of Appendices ... XI
List of Abbreviations ... XII
Chapter 1: Introduction ... 13
1.1 Introduction ... 13
1.2 Background and Problem ... 14
1.3 Research Objectives ... 17
Chapter 2: Literature Review ... 18
2.1 Introduction ... 18
2.2 Intersection Analysis ... 18
2.2.1 Level of Service ... 18
2.2.2 Capacity ... 20
2.2.3 Service Flow Rate ... 21
2.2.4 Degree of Saturation ... 22
2.3 Traffic Modelling Software ... 23
2.3.1 Analytical/Microscopic Modelling ... 23
2.3.2 Micro-simulation ... 24
2.3.3 Macro-simulation ... 24
2.3.4 Hybrid/Mesoscopic Simulation ... 24
2.4 SIDRA Intersection as a Modelling Tool ... 24
2.5 Methods for Improving Traffic Flow ... 27
2.5.1 Traffic Congestion ... 27
2.5.3 Movement Restriction ... 30
2.5.4 One Way Flow ... 30
2.5.5 Enforcement ... 32
2.5.6 Building New Infrastructure ... 32
2.5.7 Access Control and Management ... 33
2.5.8 Street widening... 33
2.5.9 Grade separation ... 34
2.5.10 Managing Transportation Demand ... 34
2.5.11 Growth management ... 34
2.5.12 Alternate work hours ... 35
2.5.13 Site design to minimize traffic ... 35
Chapter 3: Dissertation Methodology ... 37
3.1 Data Collection ... 37
3.1.1 Traffic counts, AADT, Heavy Vehicle Percentage and Crash History 37 3.1.2 Video Data... 38
3.2 Model Development ... 38
3.2.1Assumptions ... 39
3.3 Methodology Flow Chart ... 40
Chapter 4: Tourist Road Model Development and Results Analysis ... 41
4.1 Geometric Properties of Site 1 ... 41
4.2 Traffic Data ... 43
4.3 Crash History ... 44
4.4 Model Development ... 44
4.5 Results... 44
4.6 Validation ... 47
Chapter 5: Herries Street Model Development and Results Analysis ... 49
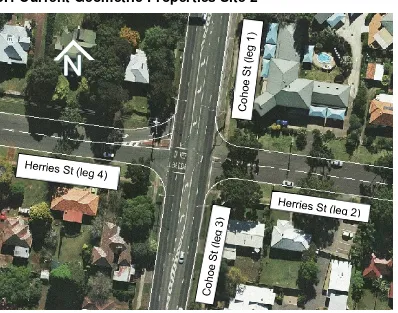
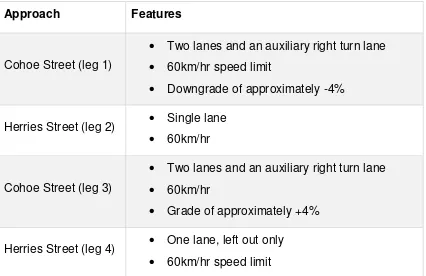
5.1 Current Geometric Properties Site 2 ... 49
VII
5.3 Crash History ... 53
5.4Model Development ... 54
5.5 Results ... 55
Chapter 6: James Street Model development and Results Analysis ... 58
6.1 Intersection Layout ... 58
6.2 Traffic data ... 60
6.3 Crash History ... 61
6.4Model Development ... 63
6.5Results ... 63
6.6 Validation ... 66
Chapter 7: Options Investigation ... 67
7.1 Alternate Options ... 68
7.2 Options Selected for Comparison ... 69
7.2.1 Option A ... 69
7.2.2 Option A Estimate... 73
7.2.3 Option B ... 73
7.2.4 Option B Estimate... 77
7.2.5 Option C ... 78
7.2.6 Option C Estimate ... 82
7.3 Options Assessment ... 83
7.4 Recommendation ... 85
Chapter 8: Recommendations and Conclusion ... 86
8.1 Conclusion ... 86
8.2 Recommendations and Further Work ... 87
Chapter 9: References ... 89
Appendix A- Project Specification ... 91
Appendix B- Traffic Counts ... 93
B.2 Tourist Road- 12 Hour Totals ... 95
B.3 Herries Street- 12 Hour Totals ... 97
B.4 James Street- 12 Hour Totals ... 99
Appendix C- SIDRA Layouts ... 101
C.1 Tourist Road ... 102
C.2 Herries Street- Current Layout ... 102
C.3 Herries Street- Planned Layout ... 103
C.4 James Street ... 103
Appendix D- SIDRA Output Summaries ... 104
D.1 Tourist Road- Current Year (2015), no Bunching ... 105
D.2 Tourist Road- Current Year (2015), 20 % Bunching, Stage 1 ... 106
D.3 Tourist Road- 10 Year Design Period, 20% Bunching ... 107
D.4 Tourist Road- 20 Year Design Period, 20% Bunching ... 108
D.5 Herries Street- Current Layout (2015) ... 109
D.6 Herries Street- Signalised Layout, 0 Year Design Period... 109
D.7 Herries Street- Signalised layout, 10 Year Design Period ... 110
D.8 Herries Street- Signalised Layout, 20 Year Design Period... 110
D.9 James Street- Current Year (2015) ... 111
D.10 James Street- 10 Year Design Period ... 112
D.11 James Street- 20 year design period ... 113
D.8 James Street- Options Investigation (signalisation) ... 114
Appendix E- Chartview Data ... 115
IX
List of Figures
Figure 1: Level of Service (Austroads Guide to Traffic Management, 2013) ... 13
Figure 2: Cohoe Street Toowoomba, Southern Direction (K. Pearson) ... 15
Figure 3: Cohoe Street, Toowoomba (K. Pearson & DTMR) ... 16
Figure 4: Level of Service and Service Flow Rates (Austroads Guide to Traffic
Management, 2013) ... 22
Figure 5: Aerial Photo, Intersection of Tourist Road and Cohoe Street (DTMR)
... 41
Figure 6: Photograph, Intersection of Tourist Road and Cohoe Street (K.
Pearson) ... 41
Figure 7: Site 1 Movement Definitions (K. Pearson) ... 42
Figure 8: Aerial Photo, Intersection of Herries Street and Cohoe Street (DTMR)
... 49
Figure 9: Photograph, Intersection of Herries Street and Cohoe Street
(K.Pearson) ... 49
Figure 10: Site 2 Movement Definitions (K. Pearson) ... 51
Figure 11: Aerial photo, Intersection of James Street and Cohoe Street (DTMR)
... 58
Figure 12: Photograph, Intersection of James Street and Cohoe Street (K.
Pearson) ... 58
Figure 13: Site 3 Movement Definitions (K. Pearson) ... 59
Figure 14: Possible Alternative Routes for Restricted Access at James Street &
Right Turn Diversion from Tourist Road to Herries Street (Option A) (Google
Maps, 2015). ... 71
Figure 15: Alternative Route for Accessing James Street & Diverted Right Turn
from Tourist Road to Herries Street (Option B) (Google Maps, 2015). ... 76
Figure 16: Alternative Routes via Herries Street (Option C) (Google Maps,
List of Tables
Table 1: Performance Measures Used for Defining Levels of Service (Austroads
2007)... 20
Table 2: Key Geometric features of Tourist Road and Cohoe Street Intersection ... 43
Table 3: Tourist Road Peak Hour Summary (QDTMR) ... 43
Table 4: Crash History Site 1 ... 44
Table 5: Movement Summary Tourist Road, Scenario 1 ... 45
Table 6: Movement Summary Tourist Road, 0, 10 and 20 year design period 46 Table 7: Level of Service Summary, Site 1 ... 47
Table 8: Key Geometric Features Site 2 ... 51
Table 9: Site 2 Peak Hour Summary... 52
Table 10: Site 2 PM Peak Hour Summary with Development Contributions ... 52
Table 11: Crash History Site 2 (DTMR) ... 53
Table 12: Movement Summary Site 2, Current Year, 2015 (without development) ... 55
Table 13: Movement Summary Site 2, 0, 10 and 20 Year Design Period (with signalisation) ... 57
Table 14: Key Geometric Features Site 3 ... 60
Table 15: James Street Peak Hour Summary ... 60
Table 16: Crash History Site 2 (DTMR) ... 61
Table 17: Movement Summary Site 3, 0, 10 and 20 year design period... 64
Table 18: Level of Service Summary, Site 3 ... 65
Table 19: Option A Summary ... 69
Table 20: Option A Estimate ... 73
Table 21: Option B Summary ... 74
Table 22: Option B Estimate ... 78
Table 23: Option C Summary ... 79
Table 24: Option C Estimate ... 82
Table 25: Options Assesment ... 83
Table 26: Options Assessment Marking Scheme ... 83
XI
List of Appendices
Appendix A: Project Specification
Appendix B: Traffic Counts
Appendix C: SIDRA Layouts
Appendix D: SIDRA Output Summaries
Appendix E: Chartview Data
List of Abbreviations
AADT - Annual Average Daily Traffic
DTMR – Department of Transport and Main Roads
DVR – Digital Video Road
HV - Heavy Vehicles
MUTCD – Manual of Uniform Traffic Devices
RPDM – Road Planning and Design Manual
TARS- Traffic Analysis and Reporting System
PCR- Passenger car equivalent
LOS- Level of service
VCR- vehicle-to-capacity ratio
HCM- Highway Capacity Manual
Vpd- Vehicles per day
13
Chapter 1: Introduction
1.1 Introduction
Traffic congestion is one of the key critical transportation concerns facing
Australia. Traffic congestion has many impacts on the community additional to
the impedance of mobility and connectivity such as the contribution to air
pollution, excess fuel consumption and hindering economic growth.
Traffic congestion occurs when the demand on the road network is greater than
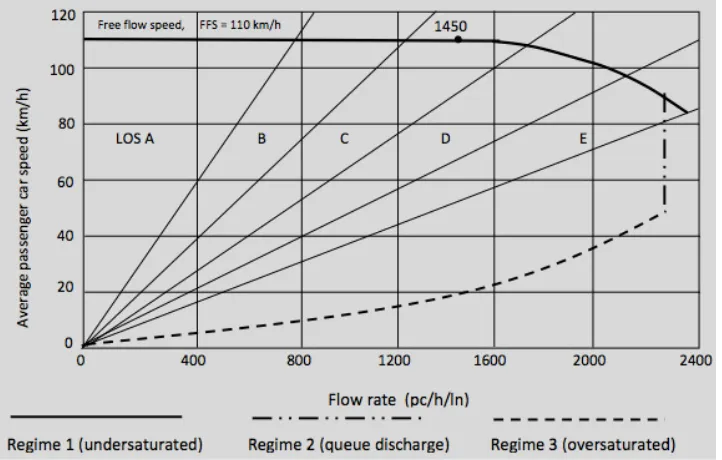
the facilities capacity to operate with acceptable levels of delay. Level of service
is the term used to classify the operating capacity of a road link or intersection. It
is defined by a graded scale from A to F, with A representing optimal free flow
conditions and F being heavily congested. Level of Service can be linked directly
to the ratio of average passenger car speed to traffic volume. Austroads details
this relationship in figure 1 below.
As the number of vehicles using a facility increases, the mean speed tends to
decrease, resulting in a reduced level of service for the intersection or road link.
Traffic composition also contributes to the flow rate of a link, specifically the
[image:15.595.124.485.394.624.2]vehicles are restricted in their ability to gain momentum if slowed or stopped,
have reduced manoeuvrability and occupy a larger space within the road corridor
than passenger cars.
Road transportation is the predominant choice for most Australians and as such
there is a level of expectation from the community regarding the safety and
efficiency of the network. It is the responsibility of the road authorities to manage,
maintain and improve the network to ensure the infrastructure is performing to its
full potential and providing a level of service that meets those needs and
expectations of the community.
The following dissertation aims to investigate the operational characteristics of
Cohoe Street, Toowoomba. Cohoe Street was selected for investigation due to
the complex nature of the link, as detailed in section 1.2.
SIDRA Intersection will be used with data and resources being provided by the
Department of Transport and Main Roads.
1.2 Background and Problem
Toowoomba city is located approximately 130 kilometres west of Brisbane with
the Warrego Highway linking the two. The Warrego Highway is one of the main
Heavy Vehicle route that runs directly through Toowoomba and continues on to
the Western Downs.
The Western Downs Region encompasses the Town of Dalby and the Shires of
Chinchilla, Murilla, Tara, Wambo and division two of the Shire of Taroom. The
region is continuing to develop with industry such as farming and mining
continuing to place greater demand on the Highway.
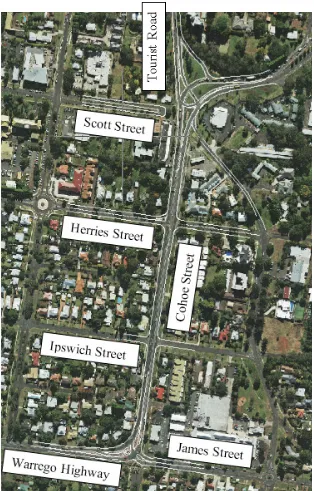
Cohoe Street is a section of the Warrego Highway that provides the entry point
to Toowoomba. It runs from the intersection of Tourist Road to the intersection of
James Street with an approximate North- South orientation. Along the 700 metre
link there are a variety of businesses including motels, a service station, and a
shopping centre along with residential properties including houses and unit
15
Figure 2: Cohoe Street Toowoomba, Southern Direction (K. Pearson)
The three major Intersections, Tourist Road, Herries Street and James Street will
be analysed with the smaller side streets not being considered due to their impact
on the functionality of Cohoe Street being assumed as negligible.
The current configuration of the through road is two lanes in each direction with
a sixty kilometre per hour speed limit. The adjoining minor roads are currently
sign controlled, although there is a commercial development on the North-West
corner of Herries Street that is due for completion in 2016 that plans to introduce
traffic signals at the intersection.
There has been one fatal crash at the Herries Street intersection in 1994 and
numerous minor crashes involving property damage on record from 1993 to 2011.
James Street intersection also has an extensive history of crashes, none have
been fatal. The focus of the dissertation is on the functionality of the road link and
as such the safety of the intersections has not been investigated explicitly.
The second range crossing is a bypass for Toowoomba that has been in the
planning stages for many years. The aim of the project is to divert the large
number of heavy vehicles and passing traffic that currently have to travel directly
through the city’s centre. This year the project received funding and is currently
in the early stages of resourcing. Due to the large scale of the project the planned
opening date is unclear and as such the implications of the project have not been
Street when completed is likely to only to be temporary as traffic will initially
reduce but then continue to grow.
Figure 3 provides an aerial photo of the Cohoe Street link with the adjoining
[image:18.595.59.373.175.666.2]streets highlighted.
17
1.3 Research Objectives
The following is the defined scope of this analysis of Cohoe Street.
1. Research background information, from both Australia and Overseas,
regarding; intersection modelling, Level of Service standards for
intersections and methods for improving over capacity intersections.
2. Gather the required traffic data (counts and growth projections) for the
selected intersections and any other relevant planning proposals that
may impact on the functionality of Cohoe Street. Draft basic layouts of
the intersections and the arterial road. Calculate traffic data for future
cases using traffic growth projection.
3. Develop a model in SIDRA Intersection containing all of the
intersections so they can be analysed individually and potentially as a
network if required. Adopt standard SIDRA parameters for first pass of
analysis.
4. Validate the model by comparing outputs of average delay and gap
acceptance with data collected from video footage of the intersections
and calibrate if necessary.
5. Use the model to predict traffic flows and performance of Cohoe Street
under future predicted traffic flows, and consider strategies to optimise
flows.
6. Depending on the outcome of the analysis, re-model in SIDRA to
develop upgraded layouts for intersections, optimising network
cohesion and efficiency.
Chapter 2: Literature Review
2.1 Introduction
The main objectives of the research is to gain a deeper understanding of the
fundamentals of intersection modelling, validation of the use of SIDRA
Intersection as a reputable software package, the safety and functionality of the
different types of intersections focusing on signalised and sign controlled as well
as different vehicle types and their operational characteristics.
2.2 Intersection Analysis
Intersection analysis is a complex process that is fundamental to transport
planning. The core concepts researched are Level of Service, Capacity, Degree
of Saturation and Service Flow Rate as these are deemed highest priority
concepts for network functionality.
2.2.1 Level of Service
Level of service is at the core of network analysis and is essentially the
fundamental grading scheme by which conclusions are made about the
operational functionality of a network or individual intersection. Understanding the
concept of level of service and how to employ it is a requirement for confidence
in one’s ability to assess the functional lifespan of a road link.
The Highway Capacity Manual describes Level as Service (LOS) as “a
quantitative stratification of a performance measure or measures that represent
quality of service” (TRB, 2010). This is consistent with Austroads (an Australian
and New Zealand Road Transport and Traffic Authority) definition of Level of
service as being “a qualitative measure describing operational conditions within
a traffic stream, and their perception by motorists and/or passengers” (Austroads,
2007). The Department of Transport of Main Roads (DTMR) accepts these
definitions and uses Level of Service to determine the lifespan of an intersection.
LOS has six levels of service from A to F as defined by (TRB, 2010). LOS A
identifies the ideal operating conditions as seen from the traveller’s perspective
with LOS F representing the worst. The system of an A to F scale is designed to
aid in simplifying the decision around a facility’s operational performance.
Although LOS A represents the optimal case scenario facilities are typically not
19
reasoning (TRB, 2010). Acceptance of LOS is situational as one authority may
accept a LOS D but to another authority or at another site this may be considered
unacceptable.
It should be noted that an urban facility is described as a section of roadway that
incorporates urban street segments and can generally be defined as an urban
arterial (TRB, 2010). To be considered an urban arterial there must be at least
one facility along the link that requires a possible stop or yield on the through
movement (TRB, 2010). This requirement for Cohoe Street will be met with the
inclusion of the development at Herries Street and as such it shall be considered
as an urban arterial for the purpose of analysis.
The LOS standards and control measures differ between sign controlled and
signalised intersections. The difference is due to the variance in driver
expectations between functionality of traffic signals and sign controls. Traffic
signals give the road users the perception that the link has a higher traffic volume
hence the requirement of signals, which brings an expectation and acceptance
of longer average delays. In comparison sign controlled intersections don’t have
the same degree of predictability as signals. This can decrease the road users’
acceptance of delay times at sign controlled sites (TRB, 2010).
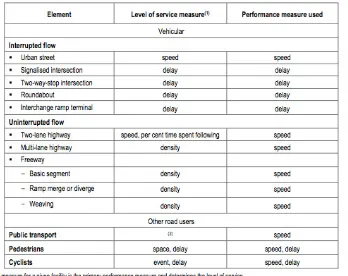
Austroads adapted information outlined in the Highway Capacity Manual to
develop a table outlining the performance measures used for defining levels of
service. The table highlights the principal control measure for varying types of
Table 1: Performance Measures Used for Defining Levels of Service (Austroads 2007)
2.2.2 Capacity
Capacity is a fundamental concept in traffic analysis therefore research into the
implications and role it has pertaining to network operations was imperative to
confidently undertake a link analysis.
The Highway Capacity Manual provides two definitions for capacity one
pertaining to system elements and one for vehicles capacity as follows,
“The capacity of a system element is the maximum sustainable hourly flow rate at which persons or vehicles reasonably can be expected to traverse a point or a
uniform section of a lane or roadway during a given time period under prevailing
roadway, environmental, traffic, and control conditions” (TRB, 2010).
“Vehicle capacity is the maximum number of vehicles that can pass a given point
during a specified period under prevailing roadway, traffic, and control conditions.
This assumes that there is no influence from downstream traffic operation, such
as queues backing into the analysis point” (TRB, 2010).
Austroads employs the above definitions and refers to them in the Guide to Traffic
[image:22.595.93.441.73.349.2]21
Numerous factors contribute to the capacity of a network or facility such as traffic
volumes and vehicle type, control conditions and the geometric properties
(roadway conditions). The conditions of a network should be fairly consistent
when analysed as alterations in prevailing conditions impacts a segments
capacity (TRB, 2010).
The geometric elements of a network element can influence capacity in some
instances whereas in others it may be impacting on driver perception and speed.
Drive perception and speed are performance measures rather than flow rate or
capacity. Roadway conditions incorporate the following lane number and widths,
alignments both vertical and horizontal and lane configurations at intersections
(TRB, 2010).
Introducing heavy vehicles onto a roadway can impact on the capacity of the
network. Heavy Vehicles are considered to be vehicles that have more than four
wheels such as B-Double and Road Trains. Heavy vehicles have limitations
around their operational performance in respect to acceleration, deceleration and
maintaining speed on steep grades especially when compared to passenger
cars. The size of a road train for example is 36m whilst an average passenger
car is around 2.5m. This difference means that the Heavy Vehicles are physically
occupying more of the roadway, reducing the capacity (TRB, 2010). These issues
surrounding Heavy Vehicles are hard to overcome especially when amplified in
certain situations. Steep downgrades where trucks must employ lower
gears/speeds and on steep upgrades where the differential speed between trucks
and cars is large creates inefficiencies in the roadway with gaps created being
difficult to occupy (TRB, 2010).
The traffic flow distribution across the lanes of a roadway network can also have
implications on capacity with directional flows sometimes being linked to the AM
peak or the PM peak. For two lane rural highways it is directional distribution that
has the most implications with the ideal scenario being an even distribution
across the directions of travel (TRB, 2010).
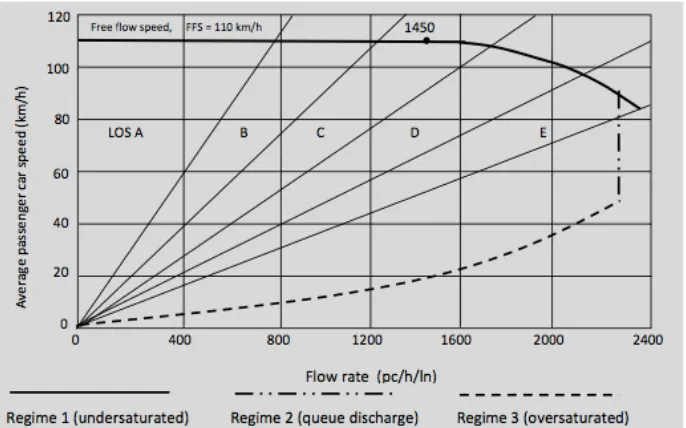
2.2.3 Service Flow Rate
Service flow rate is the suggested maximum hourly rate for which a person or
vehicle can fairly traverse a point whilst retaining a designated level of service.
rather than a range. There is a service flow rate value for each level of service,
which is typically calculated over a fifteen-minute period of time and indicates the
pedestrian or vehicle capacity for that level of service. A level of service relating
to actual traffic volumes is determined using the calculated service flow rate
(Austroads, 2013). Figure 4 is from the Austroads Guide to Traffic Management
and shows the relationship of Levels of Service and service flow rates for a free
speed of 110km/hr. This is called an operation curve.
2.2.4 Degree of Saturation
Degree of Saturation for the approach to a signalised intersection can be
described as the ratio of capacity to the arrival demand flow. It is a discrete
numerical value with up to one representing at capacity or saturated flow and
above indicating oversaturated approach with queuing occurring. Volume to
capacity ratio (VCR) is another term used to describe degree of saturation.
Typically degrees of saturation in the lower end of the range represent higher
quality of facility. 0.9 is considered the target volume to capacity ratio for signals
and 0.80 for sign controlled. These values are often referred to as ‘practical
degrees of saturation’ (Austroads, 2013).
The roadway conditions, terrain conditions, traffic volume and types directly affect
[image:24.595.56.399.230.444.2]degree of saturation much like LOS and Capacity. Terrain relating to roadways Figure 4: Level of Service and Service Flow Rates (Austroads Guide to Traffic
23
can be defined in three ways; level, rolling and mountainous. Level terrain
describes a geometric alignment that enables heavy vehicles to operate similarly
to passenger cars with speed. Rolling terrain describes a geometric alignment
that for heavy vehicles a significant decrease in speed to that of passenger cars
is required to navigate the network. A crawl speed is not accepted for extended
periods of time. Mountainous terrain is a geometric alignment that restricts heavy
vehicles to a crawl speed for extended distances or at recurring intervals
(Austroads, 2013). Roadway conditions are inclusive of the design speed, lane
widths, vertical and horizontal alignment and facility type i.e. signalised or sign
controlled (Austroads, 2013).
2.3 Traffic Modelling Software
Intersection modelling and analysis can be a complex or simple task depending
on the specifics of the site being investigated. Signalised intersections particularly
are more complex with issues relating to signal phasing and pedestrian
requirements. Manual calculations are possible but with technology consistently
improving there is a visible move towards computer modelling for traffic analysis.
There are predominantly four types of software based traffic modelling;
analytical/microscopic modelling, microscopic simulation, macroscopic
simulation and hybrid/mesoscopic simulation. Each package uses traffic volumes
and growth, vehicle types and road geometry to give an indication of how the
intersection is operating.
The selection of software is situational with time, resources, project scope and
budget all requiring consideration.
2.3.1 Analytical/Microscopic Modelling
The Austroads Research Report The use and application of microsimulation
traffic models describes analytical modelling as a technique that directly relates
to traffic flow theory, often being a group of equations governing driver behaviour
characteristics such as changing lanes, gap acceptance or platooning. Some
examples of the many available micro model software packages are as follows;
• SIDRA Intersection
• SCATES
• OSCADY
2.3.2 Micro-simulation
Micro-simulation tracks the movement of individual vehicles through a network
using a sub-second time increment. The programing utilises random number
generators making model calibration intensive (James Luk and Johann Tay,
2006). The outputs are given as both a text file and a visual animation. Example
software packages are as follows;
• AIMSUN
• VISSIM
• QuadstoneParamics
• CORSIM
2.3.3 Macro-simulation
Macro-simulation tracks the movement of vehicles as grouped traffic streams
rather than individual entities. The time step over which platoons are tracked is
one or more seconds (James Luk and Johann Tay, 2006). Traffic signal
optimisation is an ideal task for macro-simulation. The following are example
software packages;
• VISUM
• CUBE Suite
• TRANSYT
• CONTRAM
2.3.4 Hybrid/Mesoscopic Simulation
Hybrid Simulation encompasses an in-depth microscopic simulation of some core
components of a model with analytical models for example intersection
operations and speed flow relationships (James Luk and Johann Tay, 2006).
Example software packages are as follows;
• TransModeler
• Aimsun
2.4 SIDRA Intersection as a Modelling Tool
SIDRA Intersection is one such Micro Model packaged and is the choice for
25
Intersection and therefore it was selected as the tool for undertaking the analysis
of Cohoe Street. The following section reviews a case study that also validates
the use of SIDRA along with the SIDRA User Guide.
Austroads continues to support research in the field of road design, traffic
management and transport planning. Project number NS1371 “Modelling of
Signalised Intersections: Case Study” was published in 2010 (publication number
AP-R365/10) and prepared by Ian Espada, Paul Bennett and James Luk with
Young Yoo acting as Project Manager.
The project investigated options available for modelling signalised intersections
with the aim of providing guidance for technical persons on selecting the
appropriate modelling techniques (Austroads, 2010). The researchers based the
project around a case study, choosing two sites of varying complexity to model in
different software packages. The outcomes compared were not only the results
of the models but also the resourcing required to develop the model and the need
for specialist capability to develop the model.
When modelling a signalised intersection the main programs used in industry are
either micro-modelling software such as SIDRA Intersection or micro simulation
with VISSIM, Q-PARAMICS and AIMSUN being the most commonly used by
road/transport authorities within Australia. Both have advantages and
disadvantages with the main difference being that micro simulation uses a visual
simulation of the road network functioning in comparison to Micro modelling which
is developed from traffic flow theory (Austroads, 2010).
The report found that when comparing the outputs of SIDRA with that of
fixed-time micro simulation models they were equally accurate when approximating
maximum and mean back of queue for the study site, which was under saturated
conditions. SIDRA outputs were also comparable to field measurements of cycle
average queue (Austroads, 2010).
When comparing SIDRA with VA and SCATSIM both of which are complex micro
simulation software packages the outputs of SIDRA for queue length
approximations were found to be less accurate under certain conditions.
Comparatively for fixed time models the output accuracy for the different
advantage in choosing to use either micro simulation or SIDRA when referring to
model accuracy alone (Austroads, 2010).
Although the outputs of the micro simulation models were thought to be more
accurate, practicalities around their use were also highlighted. SIDRA is fairly
simplified software in that only basic training is required to be able to develop a
model and utilise its capabilities. Comparatively micro simulation modelling
requires significantly larger resourcing requirements in the range of 20% and
higher labour demand. Micro simulation though has the ability to encompass
greatly variable phase sequences and visual simulations but these do require a
greater level of training to correctly input the data and manipulate the software
(Austroads, 2010).
Austroads (2010, commented that is has been identified by road and transport
authorities that the use of SIDRA is occasionally over extended along with the
over-use of micro simulation packages resulting in uneconomical resource use
highlighting the importance of the research being done.
With the aim of the project being to simplify the selection of modelling techniques
a recommended hierarchy of modelling techniques was formed from the
conclusions of the case study. The hierarchy suggests manual calculations,
micro-modelling using packages such as SIDRA and then micro simulation. The
idea is that the least costly option should be taken first and then if the need arise
move to a more complex modelling system. This would see the best use of
resources and time meaning more efficient and cost effective practice for
businesses (Austroads, 2010).
Selection of the correct software and process has been proven to have great
implications on the overall cost of a project and not just for the initial analysis of
the intersections. Examples of when overdesign can occur is in the determination
of merge and queue lengths. The additional length adds unnecessary
construction costs. Under design is also a possibility with the implications being
greater than just cost, as substandard design can lead to driver frustration.
Examples of under design include queue lengths and signal phasing with the
worst case scenario resulting in a decrease in the safety of the facility. It is
27
analysis phase of a project including specifically the software selection although
caution around over analysis needs to be taken as well (Austroads, 2010).
The case study also brought to light some of the limitations of the software used
in the area of environmental concern. Both the micro simulation and micro model
software outputs were lacking accuracy in their estimations of environmental
factors. As a recommendation more emphasis needs to be placed on
investigating and potentially modelling the impacts of a road network on the
environment (Austroads, 2010).
Overall the project has demonstrated the importance of selecting the correct
technique when modelling signalised intersection. SIDRA Intersection was
second place on the recommended hierarchy for technique selection, validating
its position as a comprehensive and cost effective software packages.
2.5 Methods for Improving Traffic Flow
One of the key objectives of this project is to provide feasible recommendations
on how to improve the traffic flow on Cohoe Street, Toowoomba. A Toolbox for
Alleviating Traffic Congestion is a document prepared by the Institute of
Transportation Engineers, America that details a multitude of ways to improve
congestion. The Toolbox was published in 1989 but still proves relevant to today.
The following section will review some of the key segments from the report and
establish a correlation with the Australian Austroads Design Guides. The impacts
of congestion along mitigating treatments will be discussed, as finding a solution
begins with the big picture of understanding the implications that traffic
congestion has on a community.
2.5.1 Traffic Congestion
Traffic congestion is one of the main critical transportation issues facing most
developed countries around the world. Congestion impacts on the community in
a multitude of ways including, impeding mobility, hindering economic growth,
contributing to excess fuel consumption and air pollution. It is important to
recognise that traffic congestion is a more complex issue than simply too many
vehicles. There are land use and institutional levels to the problem that contribute
Traffic congestion occurs when the demand on the road network is greater than
the facilities capacity to operate with accepted levels of delay (ITE, 1989). Some
of the consequences that congestion can have for a community are described by
the Institute of Engineers as follows;
Local Impacts- Drivers will often look for alternate routes to avoid congestion,
often this is through local streets in residential areas. The streets have not been
designed to cater for the increase in traffic resulting in neighbourhood complaints
(ITE, 1989)
Economic Growth- Effective transportation access to development sites and
employment is a key consideration when considering project opportunities.
Residents will look for good transportation systems within suburbs when
relocating making it a significant selling point. Good transportation is also
fundamental to the movement of goods and services therefore directly influencing
economic growth (ITE, 1989)
Community Access- Community access is not only important for residents when
looking for areas to live but it’s also imperative for public safety (fire, ambulance,
police) (ITE, 1989).
Quality of life- The view of some people is that congested road links are a
reflection of deterioration in quality of life. This may seem extreme but for some
people the choice to relocate is to avoid urban issues like traffic congestion (ITE,
1989).
Traffic crashes tend to become more prevalent in congestion whether it is
navigating intersections or stop go traffic on main arterials. Minimizing the
congestion has the potential to improve safety (ITE, 1989).
Environmental Impact- Air quality is heavily impacted by traffic congestion. If
changes can be made to travel behaviour or improvements to the traffic system
the severity could be reduced (ITE, 1989).
The impacts outlined above highlight the importance of identifying and mitigating
traffic congestion. There are numerous ways this can be done outside of building
new capacity or expanding upon existing infrastructure such as managing the
29
Adapting existing infrastructure to create capacity is typically the cheapest to
implement. It may include techniques such as implementing traffic control
devices, restricting turn movements or converting two way flow to one all of which
require the overarching tool of enforcement.
2.5.2 Intersections Traffic Control Devices
Intersection traffic control devices are useful for improving the flow of vehicles
and pedestrian safety. Devices include signage (stop, give way), traffic islands,
turning lanes, channelization and enhanced design. Substantial benefits are
gained with the separation of traffic and generally enhanced safety operation.
The associated costs involved with the planning and implementation of this
technique is modest but can vary substantially depending on the number installed
and the site complexity. As such, defining the real costs and benefits is difficult
(ITE, 1989).
The Institute of Transport Engineers outlines eleven principles to consider when
designing and improving at grade arterial intersections, they are as follows;
1. Decrease the number of conflict points
2. Control the approach and departure speeds of vehicles
3. Coordinate traffic control devices with traffic volumes
4. Select intersection type to best serve the volume of traffic
5. With large volumes consider separation of turn movements
6. Minimize driver decisions by avoiding multiple or compound merging and
diverging manoeuvres.
7. Disperse conflict points
8. The heaviest and quickest flows should be prioritized
9. Decrease conflict area
10. Isolate non-homogenous flows i.e. turn lanes
11. Give consideration to cyclists and pedestrians
These techniques align with the Austroads Guide to Traffic Management Part 6-
Intersections, Interchanges and Crossings where they suggest that regulatory
signs and/or physical devices such as channelization are possible treatments for
reducing volumes at intersections. Providing turn bays and reviewing signage are
also detailed as possible treatments for improved operational efficiency
2.5.3 Movement Restriction
Prohibiting or restricting turn movements is a way of eliminating conflict points,
improving safety and reducing congestion. Turn prohibitions are not always
necessary for all times of the day, rather they can be kept to peak hours or times
where there are known issues. Adequate signage needs to be clearly visible to
motorists with increased enforcement likely required at the early stages of
implementation. Restricting turn movements to certain phases at signalised
intersections is common practice and most effective when separate turn lanes
are provided.
The cost/benefit of restricting turn movements is difficult to quantify as it causes
a change in travel route. The ITE (1989) states that in San Francisco data
compiled showed that crashes were reduced from 52% to 38% across the four
intersections studied. Each of the intersections carried high volumes with 30,000
to 50,000 vehicles per day (ITE, 1989).
Designated turn lanes are an alternative to prohibiting turns but they require
additional width. Restricting parking, if available, is a way of obtaining the required
width but the implications of reduced parking need to be fully examined.
The ITE (1989) recommends that the following six points be examined when
considering prohibiting turns.
1. The degree of delay and congestions caused by the turning movements
2. The number of crashes resulting from the turn movements
3. Availability of alternate routes
4. Potential impacts of diverting the flow to other intersections
5. Possible environmental impacts resulting from diverted traffic flow
6. Feasibility of alternate solutions i.e. provision of turn lanes
2.5.4 One Way Flow
Converting existing two way flow to one way can be of benefit in certain situations
although great consideration needs to be given to impact on travel routes and
access.
One-way streets typically operate in one of three ways
31
2. Traffic typically flows in one direction but at certain times is reversed to
provide additional capacity
3. Traffic flows in both directions but during peak hour flow is restricted to
one way. The restricted flow direction can alternate depending on the peak
(ITS).
The Austroads Guide to Traffic Management Part 5- Road Management (2013)
quotes the ITE (1989) for the disadvantages and advantages of one way
movements but in regards to the above operational characteristics of one way
flow the recommendations differ. Part 5 of the Guide to Traffic Management
(2013) encourages one way flow to be in the same direction at all times with
reversible flow only being used rarely.
One way links provide increased capacity through reduction in intersection delays
with reduced turn conflicts, reduction to travel time, allowing turns from multiple
lanes and re-distributing traffic flows. Increased safety is also a positive outcome
with the reduction of conflict points for vehicles and pedestrians (ITE, 1989).
The Austroads Guide to Traffic Management Part 5- Road Management (2013)
states that increases in capacity ranging from 20 to 50% over two-way operation
have been recounted. Along with reductions to total crash occurrences ranging
from 10 to 50% and decreases in travel time of 10 to 50%.
The ITE (1989) recommends as a general rule that two-way streets should only
be converted to one-way when;
1. It’s demonstrated that a specific traffic issue will be alleviated or the overall
efficiency will be improved
2. It is more cost-effective and desirable than alternative options
3. Parallel streets with acceptable capacity are readily available or can be
constructed
4. Safe transition back to two-way flow can be provided
5. Transit service is maintainable
6. The street will align with the master plan and be compatible with adjoining
2.5.5 Enforcement
Each of the techniques identified above require strict enforcement to achieve the
desired outcome. Changing individual behavior is a process that happens over
time requiring education and clarification of the changes. There are actions that
form an integral part of each of the programs outlined above.
1. Education- sufficient time must be allocated to informing the public of any
changes and the expected benefits associated with the change.
2. Clarity in the explanation and description of the proposed programs.
3. Increase in the number of enforcement staff in the initial stages of
implementation.
4. Sensible fines for failing to comply with regulations (ITE, 1989).
Increased enforcement could come at substantial cost and as such needs to be
accounted for in the overall program budget. The benefits however should be
substantial.
Austroads does not appear to make mention of the enforcement requirements for
recommended treatment options. Enforcement does form a part of the
overarching approach to local area traffic management as highlighted by the ITS
and as such should be considered when implementing/considering options that
require change in drivers behavior.
2.5.6 Building New Infrastructure
Increasing capacity can also be done through building new infrastructure. New
highways are one such form of new infrastructure they are typically considered in
urban environments where congestion is often the greatest. The benefits stem
from substantial reductions in traffic volumes on the existing road link as such
reducing congestion. The success of a new road link is determined by its
accessibility and ability to serve the locations that vehicles are destined for such
as employment or shopping developments (ITE, 1989).
The Second Range Crossing is a new highway that is due for completion in 2018.
It will essentially serve as a bypass for Toowoomba in an attempt to reduce the
number of heavy vehicles traveling through the city center. As mentioned by the
33
of the new road along with the ability to serve amenities. As such the impact of
the bypass on Cohoe Street will be disregarded for this investigation, as the
implications are not quantifiable.
2.5.7 Access Control and Management
The road hierarchy is a classification system for the road network based on the
intended function of the road. The functional classification of highways is related
to the level of accessibility and mobility (continuous free flowing travel). Access
control and management refers to the enforcement and implementation of
guidelines that define the way in which access will be provided to a highway.
Highways have the primary function of providing mobility; this is maintained by
allowing access at selected locations (ITE, 1989).
Correctly implemented access control can provide an increase in safety. Safety
is known to decrease as the number of access points such as driveways and
intersections increases along a highway or arterial road link. Traffic flow can also
be maintained or improved through limiting access (ITE, 1989)
The Austroads Guide to Traffic Management Part 5- Road Management provides
extensive detail regarding access management that coincides with the Institute
for Traffic Engineers recommendations. The guide describes techniques for
assisting with the provision of access management including intersection spacing
and indented turn lanes. Increased distance between intersections typically
improves the flow of traffic on arterial roads, which leads to reductions in traffic
congestion and improvements to air quality. Auxiliary left and right turn lanes
improve not only traffic flow but safety as well by removing the conflict between
turning and through moving vehicles (Austroads, 2013)
2.5.8 Street widening
Street widening can be implemented in two ways. One being to widen the existing
traffic lanes and the second option is to provide additional lanes. Driver
perception and behaviour is effected by lane widths. Decrease in width can lead
to a feeling of confinement resulting in reduced travelling speeds. Providing
additional lanes physically increases the capacity of the road link. (ITE, 1989)
The cost of impending wider lane widths is site dependant. In some situations it
may be a simple line marking exercise that reduces the width of the shoulder or
lanes requires moderate roadworks and in some instances land resumption
although in the case of highways the ITE states that the addition of lanes to a
highway can provide three to four times the benefit in comparison to costs.
Austroads details the typical road space requirements for general traffic use in
the guide to traffic management along with a volume guideline for the provision
of overtaking lanes. Overtaking lanes are a form of street widening that is
commonly implemented on rural highways. It is also common practice within
industry to use street widening as a method for improving the capacity of road
links in the urban environment.
2.5.9 Grade separation
Grade separation refers to the physical separation of differing traffic flows such
as bridges (overpasses). Grade separation can be applied to vehicular traffic and
pedestrians to ease congestions and also improve safety. Grade separated
pedestrian facilities are common in the urban environment where there is
generally increased concentrations of pedestrians.
Grade separation will always provide an increase in capacity although the costs
to implement are often significant due to the disturbance to traffic and business
during the construction period, right-of-way requirements and construction costs.
The Institute of Traffic Engineers suggests that an alternative option to the
established grade separated structure is a flyover. The disruption to traffic
throughout construction is minimal and right-of-way is not an issue (ITE, 1989).
2.5.10 Managing Transportation Demand
The toolbox for alleviating traffic congestion provides solutions that are outside of
the typical construction methods box such as the managing the transportation
demand. Growth management, alternate work hours and site design to minimize
traffic are some of the actions described under managing the transportation
demand.
2.5.11 Growth management
Growth management is described by the ITE as the use of public policy to
regulate, density, geographic pattern, location and rate of growth of development.
Theoretically one can limit the trip generation of a locality to any desired level if
the characteristics of the trip generations for various locations are known. The
35
of the existing infrastructure. A comprehensive growth management plan is not
limited to transportation actions but can incorporate programs relating to
economic development, community infrastructure, housing and open space (ITE,
1989).
2.5.12 Alternate work hours
Dispersing the demand for travel over a larger time period through alternate work
hour initiatives is another demand management method. Distributing the demand
enables the existing road network to serve more commuters without the
requirement for costly improvements to capacity. Three methods for alternate
work hour programs have been identified by the ITE (1989);
Staggered hours- staggered hour’s sees groups of employees starting at differing
times. Spacing the start times outside of conventional work hours allows
employees to travel when there is reduced demand on the public transport and
road network.
Flex time- flexible working hours allows employees to select their own schedule
within the company’s guidelines. Such as starting between 7:00am and 9:30am
and with many companies allowing their employees to vary the time each day.
Compressed work hours- giving employees the opportunity to complete the
typical hours of a five-day week within four days i.e. four ten-hour days totaling
the normal workweek of forty hours. The benefit comes from eliminating one day
of commuting per week and the longer shifts leads to travel being outside of the
conventional hours (ITE, 1989).
This type of technique requires social adjustment which can take a while to
implement. Government agencies such as QDTMR already employ flexible work
hours with city commuters benefiting the most.
2.5.13 Site design to minimize traffic
The predominant reason for employees travelling solo to work is the need and
convenience of running errands and shopping on the journey. The ITE (1989)
states that a survey of office workers in suburban employment centers indicated
that sixty percent of the total respondents made at least one stop either on the
way to or from the office (ITE, 1989). Site design to minimize traffic refers to the
facilities such as daycare centers or convenience stores. Providing these every
day services reduces the number of motorists travelling solo to and from work.
This is not common practice today and as such there is very little knowledge of
the impacts that it may have. Implementing a congestion-reduction site design
requires commitment from site developers or a site plan review scheme that
37
Chapter 3: Dissertation Methodology
The objective of this dissertation was to model Cohoe Street, Toowoomba in
SIDRA Intersection, specifically the intersections with Herries Street, James
Street and Tourist Road. The aim of the model was to investigate the current
operational capacity of the network and determine the functional lifespan. It was
identified that intersections are currently at or nearing capacity, exceeding the
desirable level of service as outlined by the Department of Transport and Main
Roads. Optimised solutions have been investigated with the final
recommendations focussing on improving network capacity and safety.
For the purpose of this dissertation the additional side streets that are located
along Cohoe Street have been excluded as their contribution to the link is
considered negligible. The three main intersections of Cohoe Street are with
Tourist Road, Herries Street and James Street.
3.1 Data Collection
The required data to undertake this research has been sourced from the
Department of Transport and Main Roads using both human resources and
computer based databases. Traffic counts, Annual Average Daily Traffic volumes
(AADT), Heavy Vehicle percentages, video footage of Cohoe Street and crash
history for the link is the specific data that has been acquired for the model
development. Each of these data requirements and their contribution is outlined
below;
3.1.1 Traffic counts, AADT, Heavy Vehicle Percentage and Crash History Traffic counts were collected for the intersections of Herries Street, James Street
and Tourist Road with Cohoe Street. These counts were provided by the
Department of Transport and Main Roads and were carried out using number
plate recognition. The counts provide detailed traffic information pertaining to the
volume and vehicle type for each designated movement and therefore will form
a vital part of the model development.
The AADT for the section of Cohoe Street being investigated is approximately
15,000 vehicles per day with a heavy vehicle percentage of almost 23%. This
data was obtained through the program Chartview which is a DTMR resource
percentage of heavy vehicles implied that there is congestion issues with the road
link.
Historical crash data for the network is one of the additional data sets that is
available through Chartview this allowed for details of the crashes that have
occurred at both Herries Street and James Street to be obtained. Both of the sites
have had a large number of crashes over the year and this research may or may
not find that the intersection type (sign controlled) had a factor in those incidents.
3.1.2 Video Data
Many of the State’s major intersections have fixed video cameras monitoring
them for safety purposes. The Traffic Management Centre (TMC) is a division
within DTMR in Toowoomba that have the role of monitoring the cities extensive
camera network. Fortunately there is a fixed camera located at the intersection
of James Street and also at the top of the Range. A request was sent through via
email to the TMC asking for a range of video recordings. The specified peak to
record was selected as 4:00pm to 6:00pm using a 2011 traffic count at the
permanent counter located approximately 100m east of James Street as a
reference. The returned request provided ten hours of recordings. Due to locality
of the cameras the data had to be captured over multiple days.
The video data has provided a form of validation for the outputs from the SIDRA
model in relation to average delays and gap acceptance. SIDRA has the ability
to be manually calibrated to suit the real life data. Calibration was not required as
the average variance between the real footage and the SIDRA average delay
was under ten percent. Driver behaviour will also be noted from the video data
as the horizontal alignment of the link has a tight curve that requires deceleration
especially for heavy vehicles to negotiate safely.
3.2 Model Development
SIDRA Intersection was used to model the individual intersections with the each
site analysed individually and as network. The geometric layouts for each
intersection were developed using aerial photography and Digital Video
Recording (DVR) to measure the lane widths. Standard parameters for gap
acceptance were adopted as SIDRA has based these from the extensive
research that has been undertaken and published within the relevant
39
to suit those outlined in DTMR standards. The average vehicle length was
assumed as 26 metres with a queue space of 30 metres.
The main output required was the Level of Service for each site and the overall
Level of Service for the link. The subsequent runs of the model were for a 10 and
20 year future time period using the current traffic volumes and the coinciding
growth percentage. The level of service outputs determine if upgrades are
required and a timeframe for improving the intersections capacity. Different
options using the Road Planning and Design Manual along with the Austroads
Guide to Road Design were modelled in SIDRA to develop an optimal solution.
The final recommendation will not only provide an improved LOS but will aim to
limit any social and environmental impacts that are typical with roadworks.
3.2.1 Assumptions
For the purpose of the investigation a standard traffic growth rate of two percent
compounded has been adopted for each site. Two percent is the default value in
SIDRA and is also the base line used by the Department of Transport and Main
Roads. The average heavy vehicle length has been assumed as twenty six
meters.
The effect on traffic volumes and composition from the planned second range
crossing (Toowoomba bypass) has not been considered, as the actual impact is
3.3 Methodology Flow Chart
Historical crash data - DTMR Traffic counts- DTMR
Data
Video footage- DTMR
Model
Development
Measure aerial photo in
CAD for roadway
Calculate heavy vehicle percentages
for the peak hour using raw traffic
Develop SIDRA models for each
intersections current layout
Input Parameters:
• Intersection Geometry (lane widths, lengths and grades)
• Peak hour volumes
• 2% compound traffic growth factor • Design forecast 20 years
• Average heavy vehicle size
Results Analysis
Intersection is and will
continue to operate at a
LOS C or better for 10 Intersection will
reach a LOS D
within 10 years
Solution Investigation
Discussion/
Recommendations
Re-configure SIDRA
model to find solution
that provides an
acceptable LOS for a
10yr design life
Consider the social and
environmental impacts of the
potential solutions to determine
41
Figure 5: Aerial Photo, Intersection of Tourist Road and Cohoe Street (DTMR)
Chapter 4: Tourist Road Model Development and
Results Analysis
This chapter details the intersection of Tourist Road with Cohoe Street which shall
be referred to as Site 1 from this point forward. The following chapter outlines the
site layout, traffic volumes and detailed discussion of the results obtained through
the model.
4.1 Geometric Properties of Site 1
T
o
u
ri
st
R
d
(
le
g
1
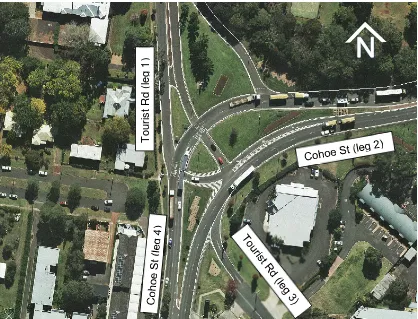
[image:43.595.120.538.242.561.2])
The Intersection of Tourist Road and Cohoe Street is a four leg intersection as
illustrated in figure 4. Standard leg naming convention has been adopted, leg 1
being to the North and subsequent leg numbering following a clockwise direction.
Tourist Road North (leg 1) has two approach lanes and one departure lane, each
separated with a raised median. The through and right movements exiting Tourist
Road North (leg 1) onto Cohoe Street (leg 4) are separated with a twenty metre
centre median forming a staged crossing. The Warrego Highway (leg 1) approach
has two through lanes and a single auxiliary right turn lane. Cohoe Street South
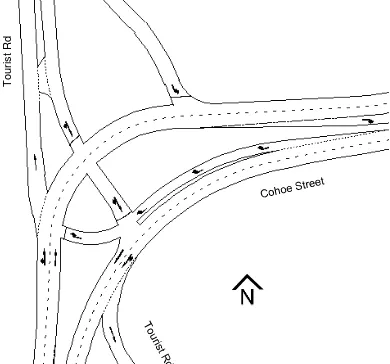
(leg 4) has two approach lanes and leg 3 is exclusively a departure lane. Figure
7 depicts the movements of each lane. It should be noted the arrows are
diagrammatical and do not represent the actual line markings of the site.
The intersection is located on relatively steep terrain with an approximate grade
of 6% from the East as can be seen in figure 6. Key features of the site have been
[image:44.595.64.454.382.746.2]summarised in Table 2.
Figure 7: Site 1 Movement Definitions (K. Pearson)
T
o
u
ri
st
R
d
43
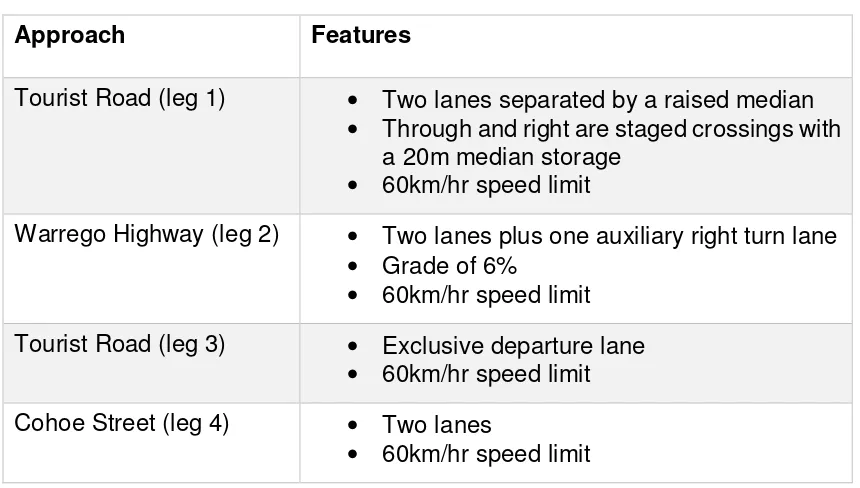
Table 2: Key Geometric features of Tourist Road and Cohoe Street Intersection
Approach Features
Tourist Road (leg 1) • Two lanes separated by a raised median • Through and right are staged crossings with
a 20m median storage • 60km/hr speed limit
Warrego Highway (leg 2) • Two lanes plus one auxiliary right turn lane • Grade of 6%
• 60km/hr speed limit
Tourist Road (leg 3) • Exclusive departure lane • 60km/hr speed limit
Cohoe Street (leg 4) • Two lanes
• 60km/hr speed limit
4.2 Traffic Data
Twelve hour traffic counts were provided by DTMR with the peak hour flows
summarised in table 3. The AM peak was identified as 7:30 to 8:30am and the
PM peak as 4:30 to 5:30pm. Refer Appendix B for detailed counts.
Table 3: Tourist Road Peak Hour Summary (QDTMR)
T im e P e ri o
d Cohoe Street (leg 2) Tourist Road (leg 3)
G ra n d T o ta l L ig h t R ig id A rt ic. R o a d T ra in T o ta l L ig h t R ig id A rt ic. R o a d T ra in T o ta l
AM 1188 54 33 26 1301 0 0 0 0 0
PM 778 38 40 34 890 0 0 0 0 0
T im e P e ri o
d Cohoe Street (leg 4) Tourist Road (leg 1)
L ig h t R ig id A rt ic. R o a d T ra in T o ta l L ig h t R ig id A rt ic. R o a d T ra in T o ta l
AM 528 38 37 34 637 280 12 5 1 298 2236
[image:45.595.115.542.461.758.2]4.3 Crash History
The crash history for site one has been provided by DTMR. Fortunately there has
only been one incident recorded for the site, the details are summarised in Table
4.
Table 4: Crash History Site 1
Date Crash Severity Description Crash Description
20/02/2009 Property damage only Opposing vehicles; turning
4.4 Model Development
The first scenario modelled examined Tourist Road in isolation, not taking into
account the planned development at Herries Street. Scenario one was run with a
zero year design period as the implementation of traffic signals at Herries Street
will be complete by 2016. Scenario two incorporated SIDRAs recommended
bunching factor of 20% when signals are located within zero to two hundred
meters downstream of a site (SIDRA Solutions 2012).
The PM peak traffic volumes were selected with a 60-minute time period. The
standard peak flow of thirty minutes for a sixty-minute analyses time period was
adopted. The inputs required were; geometry, sign control type, grade, speed,
traffic volume, growth factor