Distinct Feature Extraction for Video-based Gait
Phase Classification
1
Minxiang Ye,
2Cheng Yang,
1Vladimir Stankovic,
1Lina Stankovic,
3,4Samuel Cheng
1
Department of Electronic and Electrical Engineering, University of Strathclyde, Glasgow, UK
2
Department of Electrical Engineering and Computer Science, York University, Toronto, ON M3J 1P3, Canada
3
Department of Electronics and Information Engineering, Tongji University, Shanghai, China
4
School of Electrical and Computer Engineering, University of Oklahoma, Tulsa, OK 73019, USA
Abstract—Recent advances in image acquisition and analysis have resulted in disruptive innovation in physical rehabilita-tion systems facilitating cost-effective, portable, video-based gait assessment. While these inexpensive motion capture systems, suitable for home rehabilitation, do not generally provide ac-curate kinematics measurements on their own, image process-ing algorithms ensure gait analysis that is accurate enough for rehabilitation programs. This paper proposes high-accuracy classification of gait phases and muscle actions, using readings from low-cost motion capture systems. First, 12 gait parameters, drawn from the medical literature, are defined to characterize gait patterns. These proposed parameters are then used as input to our proposed multi-channel time-series classificationand gait phase reconstruction methods. Proposed methods fully utilize temporal information of gait parameters, thus improving the final classification accuracy. The validation, conducted using 126 ex-periments, with 6 healthy volunteers and 9 stroke survivors with manually-labelled gait phases, achieves state-of-art classification accuracy of gait phase with lower computational complexity compared to previous solutions.1.
Index Terms—feature extraction, gait phase classification
LIST OFSYMBOLS
K Number of gait phases P Gait phase label
L Length of frames in standardized gait cycle curve λi The i-th gait parameter
Vjz(f) Gait parameter value at framef inj-th gait cycle curve for gait parameter z
Szj(f) Gait parameter value at framef inj-th standard-ized gait cycle curve for gait parameter z φ(Pa, Pb) Distance between two gait phase labels
Gz The gait cycle curve cluster for gait parameterz
˚
Sz
m(f) Gait parameter value at framef in them-th gait cycle curve of cluster Gz for gait parameterz
¯
Sz(f) Gait parameter value at framef in the averaged curveS¯ of clusterGz for gait parameterz
¯
ωz
m(x, y) Shared weight for frames x andy in m-th gait cycle curve of cluster Gz for gait parameterz PS¯z(f) Gait phase label at framef in the averaged curve
¯
Sz(f)of clusterGz for gait parameter z
˚
S Gait cycle curve PS˚z
m(f) Gait phase label at framef in them-th gait cycle
curveS˚of clusterGz for gait parameterz
1This work was presented in part atIEEE ICME-2017[1].
τ Continuous edge ratio of adjacent frames
(u, v) Feature pair that links two frames offsets byl+
uLandl+vLfrom centroid frame f within an L-length sliding window
<l(u, v) The feature value linked by(u, v)
$f Length of frames in sliding window centered at framef
Qz
ε(Pa, Pb) Quality of ε-th feature candidate pair for gait parameterzto classify gait phase labels Pa, Pb
Ω Total desired number of feature pairs for all gait parameters
H Combination of any two gait phase labels rz Neighbor radius of two gait pattern curves for gait
parameterz
ρf Class probability vector at framef
ηf(a, b) Correlation coefficient of adjacent gait phase la-belsPa, Pb at framef
¨
Tp Median duration of gait phase in the training set
I. INTRODUCTION
This paper tackles the challenges of tele-rehabilitation sys-tems, in particular gait assessment, enabled by processing of measurements from sensor-driven motion capture systems. The choice of tele-rehabilitation system should not be cumbersome for the patients. The system should facilitate quick and painless data collection while the patients perform a few standard exercises, and should limit infrastructure change especially when targeting home-based or local clinic-based rehabilitation [2], [3]. Furthermore, gait analysis algorithms for physical rehabilitation programs (see [4] and references therein) should be very accurate, irrespective of sensors used.
become increasingly popular as decision support tools in many rehabilitation applications. However, commercial multi-camera motion analysis systems, such as VICON [14] and Qualisys [15], are limited by high cost, ample space requirements, a complicated installation process and limited portability.
With advances in optical sensing technology, relatively inexpensive and portable optical motion capture systems have gained attention [5]. For example, Microsoft (MS) Kinect [19] is proposed for motion capture for: (i) Frailty syndrome detection [20], to assess a person’s mobility via Timed Up and Go (TUG) tests [21]; (ii) Gait recognition [22], to classify an entire gait sequence into classes (each class corresponds to one person), integrating color, depth and inertial sensing; (iii) Sleep apnoea detection [23], to classify types of respiratory events by tracking the patient’s chest and abdominal movements; (iv) Heart rate and rhythm estimation [24], to collect bio-metrics under high acquisition noise; (v) Treadmill-based gait training to track foot movement of patients with neurological impairments [25]; (vi) Postural control assessment to measure compensatory step length in the mediolateral direction [26] and standing balance with good concurrent validity [27]; (vii) 3D multi-view motion tracking and model-based rendering to facilitate reliable motion analysis [28]; and (viii) Post-stroke rehabilitation assessment [4] to capture kinematics and evaluate rehabilitation progress on the 4-meter walking test [29].
Regardless of the motion capture system used, both the
quality of acquired representative joint movements of interest
and effectiveness of distinct feature selection for specific pathological classification, have a significant impact on gait assessment methods [30]. This is especially critical for systems relying on inexpensive motion capture systems, which need to demonstrate a comparable level of accuracy to clinical systems.
Lie group features, investigated in many action recognition applications [31], [32], have proved to be a strong feature for classifying actions. However, only long-time actions are investigated in the literature (see the review paper [33] and references therein), and the frame-wise solutions often suffer from temporal misalignment of features. Population Hidden Markov Model (pHMM) is proposed in [34] to obtain a fixed length of silhouettes within a gait cycle for aligning temporal features. However, the algorithm requires high-quality silhou-ette extraction, reconstruction, and additional training.
Motivated by this gap in the literature, preliminary stud-ies, and the emergence of low-cost motion capture systems suitable for home rehabilitation, in this paper, we propose a methodology for extracting features for precise alignment of gait patterns. Note that unlike gait/action recognition [22], [31]–[33], whose task is to classify the entire gait sequence into different actions (e.g., sitting, standing, walking), we are focused on classifying each frame of a gait sequence into different gait phases (classes) to accurately characterize gait motion. This in turn facilitates the diagnostics of individual gait phase for physical therapy, thus improving the quality of the overall gait assessment. Therefore, making reference in italics to Fig. 3 of the overall systems architecture, the main
contributions of this paper are:
1) A video-based gait pattern extraction methodology de-signed specifically to avoid over-fitting the classifier. The proposed methodology characterizes well subject-sensitive gait patterns and reduces the amount of training samples without sacrificing the classification perfor-mance. In addition to kinematics (including gait tra-jectories) as is usual practice, we exploit gait phase information.
2) A globally optimalgait phase feature extractionmethod to address the problem of temporal feature mis-alignment across frames. The proposed method achieves a global optimal set of resulting feature pairs, which are inputs to the classifier. Furthermore, to reduce compu-tational complexity of the above filtering-based feature extraction method, without sacrificing the classification performance, we propose an optimized feature extraction method that is computationally efficient.
3) A gait phase reconstruction method to avoid mis-classification of the periodic time sequential gait phase labels and recover the predictions.
Building on the conference version [1], where preliminary results of the feature extraction method (point 2 above) were presented, this paper includes the following additional contri-butions:
1) Feature candidate pair detection method (Alg. 2) 2) Feature pair mining method (Alg. 3)
3) Demonstrating the added value of using extracted gait parameters with respect to using the more traditional approach of using normalized joint trajectories directly 4) In-depth comparison and discussion between proposed
and various benchmarked schemes.
In Section II, we review related work on extracting gait phase information for gait assessment. In Section III-B1, we first briefly describe the gait phase classification problem and give an overview of the proposed system. Next, we present our proposed gait pattern extraction, gait phase feature extraction and gait phase reconstruction processes. Furthermore, we pro-pose two mining algorithms to extract feature pairs and discuss the performance of both approaches. Finally, in Section IV, we present the experimental results in terms of classification performance and computational complexity.
II. RELATEDWORK
inaccuracy of the captured joint trajectories limits the valida-tion of this preliminary study. Furthermore, no benchmarking is included. In [37], representative kinematic parameters are extracted from a unified representation via a generic full-body kinematic model to segment motion sequences into repetitive action sequences, based on the zero-velocity crossing of the feature selection. The proposed unsupervised tempo-ral segmentation method in [37] requires manual parameter tuning of the involved unscented Kalman filter, frequency analysis and adaptive k-means clustering to achieve good per-formance. However, such unsupervised segmentation requires prior knowledge of the number and order of actions occurred in the motion sequences. Moreover, the method fails when a full sequence is not measured correctly. A similar video-based gait phase classification system in [2] first acquires joint trajectories by tracking 2D bull-eye paper markers using a sin-gle high-speed expensive RGB camera. Heuristic thresholding criteria performs further automatic gait phase labelling once six gait events are extracted. Motivated by [2], a 3D motion capture system is proposed in [4] to facilitate the kinematics representation by tracking 3D trajectories of retro-reflective ball markers together with image processing algorithms. Based on the high precision joint trajectories, a heuristic method [4] is proposed to extract stance and swing phases. Both [2] and [4] require adaptive parameter tuning to achieve acceptable classification accuracy.
In this paper we provide the following improvements on the prior state-of-the-art work reviewed above: (1) a comprehen-sive set of gait parameters, based on 3D joint trajectories, to generalize high-level kinematics across all gait phases, and (2) gait phase classification of each frame, given a gait sequence, unlike [2] which focus on detecting gait event frames, and not the gait phase periods between gait events.
In [12], a lower limb exoskeleton robot ROBIN-H1, a walking rehabilitation service for stroke patients, is used to acquire pitch orientations and angular velocities of the robot
legs. The task of classifying stance and swing phases by the captured kinematics are then investigated by training a Multilayer Perceptron (MLP) neural network (NN) and an NN-based non-linear autoregressive with exogenous inputs (NARX). Results show that NARX-NN outperforms MLP-NN, but the online classification accuracy (ACC) loss is 5.7% worse than its offline version. [12] suggest that further improvement could be made by acquiring more representative walking pattern data and applying an autoencoder.
Knee joint angle and foot switches are acquired as features to detect gait events in [30]. Classification fit percentages comparison between artificial neural fuzzy inference systems (ANFIS), autoregressive models with exogenous variables (ARX), output error models (OE), NARX and other NN-based models, demonstrate that the best model is NARX with a 88.59% fit rate.
In [34], a pHMM is proposed to extract a dynamics-normalized, averaged, gait cycle by observing silhouettes of gait stances, leading to the state-of-the-art identification of the human subject. Various-length silhouettes are projected into a fixed-length sequence by training pHMM on manual silhouettes created from a subset of the Gait Challenge dataset. However, human silhouettes vary with respect to subject shape, gait speed and walking direction, and it is impractical to generate a dataset manually to cover all possible silhouettes, especially for physical rehabilitation programs. Thus, a more robust and practical high-level motion representation approach is to rely on joint trajectories.
In [38], a commercial motion capture system ‘Visual3D’ is employed to acquire knee angle parameters to perform four-class gait phase four-classification by J48 Decision Tree, Random decision forest, MLP, and Support Vector Machines (SVM) [39]. It is demonstrated that random decision forest achieves the best classification accuracy.
In Section III, we optimally extract distinct features by observing transitions of 12 gait parameters within a sliding
Stance Swing
Gait Cycle
ShoulderHip
Knee
Ankle
Toe
Heel
Toe1
Heel1
0 10 20 30 40 50 60 70 80 90 100 110 120 130 0.1
0.2 0.3
Frame
Knee Ang
le Ratio
× × ×
× ×
×
× ×
×
×
×
Gait EventP1 P2 P3 P4 P5 P6 P7 P8 P9
λ2 Heel Strike
Foot Flat
Heel Off T e1
Of
T e Off
Heel1 Off
Heel Strike Heel1
Strike
Mid-stance Mid-swing
Loading Response1
Loading Response2
Mid-stance
Terminal Stance1
Terminal
Stance2 Pre-swing Initial-swing
[image:3.612.107.508.510.696.2]Terminal Swing Mid-swing
window at varying gait speed and direction, unlike [12] and [30] that only rely on a single kinematics parameter at a fixed gait speed and direction. As a result, temporal feature misalignment is addressed by extracting distinct feature tran-sitions via gait cycle standardization and clustering, mapping spatio-temporal feature transitions by random decision forest and reconstructing adjacent gait phases by fine-tuning gait events. In Section IV, we employ state-of-the-art SVM, a two-layer NN, and a NARX-NN model [12] as benchmarks for the evaluation of the classification performance.
III. GAITPHASECLASSIFICATION
Gait assessment reveals significant factors of abnormal gait, guiding the rehabilitation assessment and treatment, support-ing clinical diagnosis and therapeutic effect evaluation. Gait phase analysis, as an important part of gait assessment [40], facilitates medical diagnosis [30] by analyzing movement of joints of interest.
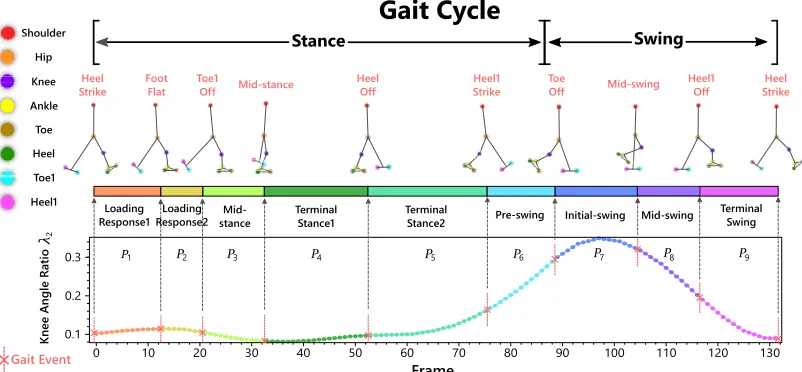
In this paper, we propose a gait phase analysis method, which aims to accurately identify the start and end of each gait phase, that is, the time period between two consecutive gait events. This is achieved by classifying each frame of the captured video into one of K = 9 different gait phases (see Fig. 1), labeled as {P1,· · ·, PK}, in order to locate K gait
[image:4.612.328.546.58.173.2]events such as heel strike, toe off, etc.
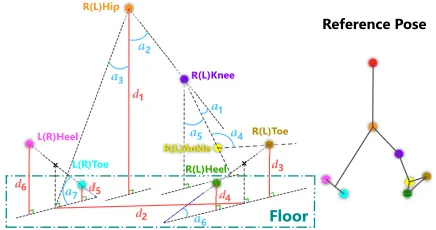
TABLE I: Definitions & observations of the proposed 12 gait parameters. See Fig. 2 for the definition of parameters diandai.
Parameter Value Observation
foot distance ratioλ1 dd21 foot switch knee angle ratioλ2 180a1◦ limb support
thigh plane angle ratioλ3 180a2◦ femur swing
toe raise ratioλ4 dd3
1 toe contact
heel raise ratioλ5 dd41 heel contact toe 1 raise ratioλ6 dd51 toe 1 contact
heel 1 raise ratioλ7 dd6
1 heel 1 contact
leg plane 1 angle ratioλ8 180a3◦ leg 1 swing
ankle angle ratioλ9 180a4◦ limb support
shank plane angle ratioλ10 180a5◦ tibia swing
foot angle ratioλ11 180a6◦ foot support
foot 1 angle ratio λ12 180a7◦ foot 1 support
We define 12 gait parameters (λ1,· · ·, λ12) and their kine-matics observations, following [2] and [41], as shown in Table I. Thesegait parameterscharacterize gait motion during the 4-meter walking test. The change of these gait parameters during the walking test is used to perform gait phase clas-sification. A visual representation is shown in Fig. 2. Joint trajectories [4] are used to calculate gait parameters per frame, which will, in turn, be used to perform feature extraction and classification to label the gait phases.
The block diagram of the overall proposed system is shown in Fig. 3, comprising 3 major steps: (1) gait pattern extraction, (2) gait phase feature extraction, and (3) gait phase reconstruc-tion. These are described in the following three subsections, respectively.
R(L)Knee
R(L)Heel
L(R)Toe L(R)Heel
R(L)Hip
R(L)Toe
Floor x x
1 d
2 d 5 d
1
a
2
a
3 d
4 d 6
d
3
a
6
a
5
a a4
7
a
Reference Pose
Fig. 2:Visual representation of distancesdi and anglesai that are
used to define gait parameters in Table I. ‘x’ denotes the 3D position at a segment centroid of two relevant joints represented by the same colour-coded cycles as in Fig. 1. Note that in this figure, the camera is placed at the subject’s right side. Thus R (right) ankle is captured while L (left) ankle is only tracked when the camera is placed on the left side.
A. Gait Pattern Extraction
Gait pattern, i.e., the sequence of limb movements during walking, can be characterized by the defined gait parameters (see Table I). While gait patterns are periodic as shown in Fig. 1, they vary among subjects due to differences in age, activity type, gender, proportion and health status. We define a gait pattern as the joint movement, i.e., changes in λ1,· · ·, λ12, occurring on a complete normalized gait cycle, invariant of walking speed and direction.
Gait cycle detection: Before we characterize the gait pat-terns, each gait cycle is split based on heel strike event detection. The heel strike event occurs when the foot makes contact with the ground, heel-first; thus, it can be extracted by detecting change points of distances between heel joint and the ground, via the inflection points search method of [4].
Based on trajectories of joints of interest, obtained, for example, by tracking the markers placed on the joints in the recorded video, as in [4], gait parameters (see Table I) are calculated in each frame. For the j-th gait cycle, let Vλi
j (f), i= 1,· · · ,12, denote the value of gait parameterλiin Frame f given a gait parameter sequence. For example, Vλ2
1 (10) denotes the value of knee angle ratio of gait cycle 1 at Frame 10 within a gait parameter sequence.
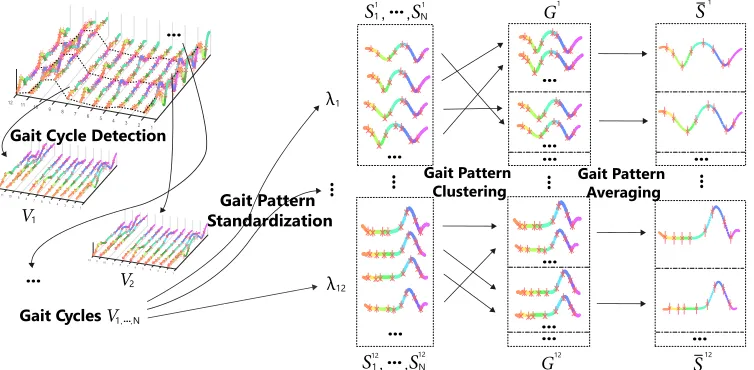
Toextract distinctive gait patternsafter gait cycle detection, we adopt the following three steps: (Step1) resample complete gait cycles into a fixed length ofLsamples, called standardized gait patterns; (Step2) cluster similar gait patterns into groups per gait parameter using density-based spatial clustering of applications with noise (E-DBSCAN) [42]; (Step3) generalize gait patterns through DTW-Barycenter Averaging (DBA) [43]. We describe these three steps one by one, next.
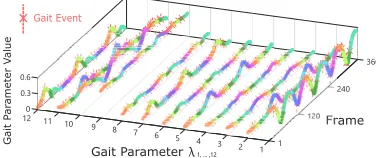
Step1: Gait pattern standardization. First, we adopt gait pattern standardization to mitigate the influence of varying gait speed. Fig. 4 shows an example of gait phase periodicity for our proposed 12 gait parameters. Since, in general, Vλi
j varies for different gait cycles,i.e., differentj, we adopt 2nd-cubic Bezier curve interpolation to resample Vλi
j to a fixed length of Lsamples leading to a standardized gait parameter curve Sλi
[image:4.612.48.302.395.569.2]Video-based Motion Capture
Acquired joint trajectory sequences
Kinematics Extraction
Gait Cycle Detection
瀎 !, , !"瀐
Gait parameter sequences
Gait Pattern Clustering
Gait cycle curves{#$}
Standardized gait cycle curves $
Gait Pattern Standardization
Gait cycle curve clusters $
Gait Pattern Averaging
Averaged gait cycle curves {%&$} Gait Pattern Extraction
Feature Candidate Pair Detection Alg.2
$
Potential feature candidate pairs
Feature Pair Mining Alg.3
Selected Feature candidate pairs
Gait Phase Feature Extraction
Gait cycle curves $'()*+
Eq.7 & 8
Gait features
ERF Classifier
Gait Phase Reconstruction
Class probabilities{-$}'./'
Gait Phase label sequences
Feature Pair Filtering Alg.1
{012, 34$}
Class weights{5!, , 56}
[image:5.612.103.509.58.309.2]$
Fig. 3:Overall system diagram. Note that either Alg. 1 (proposed Filtering method) or Algs. 2 and 3 (proposed Optimized method) are used.
360
240
Frame 0
12 11 10 9
Gait Parameter
8 7 6 5 4
3 2 1
1 0.3
Gait P
ar
ameter V
alue
0.6
×Gait Event
1, ... ,12 λ
Fig. 4:An example of the gait pattern representation (360 frames are used in this gait sequence). Note that all 12 gait parameter curves and their gait phase progress jointly characterize gait patterns.
Step2: Gait pattern clustering. Clustering analysis is usually used to group similar gait patterns in order to further perform abnormal detection, person recognition, etc. Gait phases are usually ignored in the literature for those tasks. However, similar standardized kinematics might have different gait phases across subjects and this variability is important to capture key gait events. For example, in [44], a wearable sensor-based gait phase detection system uses gait phase duration to classify level-walking and walking upstairs and downstairs by learning a decision tree model. In this paper, we take both gait parameter change and gait phase transition into account to capture the differences between standardized gait patterns. The function Φz
i,j(x, y) that measures the distance between samplexini-th gait patternSz
i and sampleyinj-th gait pattern Sjz is defined as:
Φzi,j(x, y) = Siz(x)−Sjz(y)
·exp φ(PSz
i(x), PSzj(y))
, (1)
where
φ(Pa, Pb) = K−1
2
−
1 b
2|Pa−Pb|
K+ 1 cmod 2 = 0
·
K−1
2
−|Pa−Pb|mod
K+ 1
2
.
(2)
Note thatPSz
i(x)∈ {1,2,· · · , K} refers to the corresponding
gait phase label at sample xini-th the gait patternSz i.1(p) is an operator that returns 1 if a Boolean expression p is true, and 0, otherwise. We use Eq. (1), including both the numerical distance(Sz
i(x)−Sjz(y))and exponential label dis-tance exp φ(PSz
i(x), PSjz(y))
, instead of other conventional distance functions that are commonly used in DTW. Further-more, we employ parameter-free E-DBSCAN to obtain groups of gait patterns via DTW with distance function Φz
i,j(x, y). Each cluster groupGz={S˚z
1,· · ·,˚SMz }representsM similar gait patterns.
Step3: Gait pattern averaging. After E-DBSCAN clus-tering, we employ DBA algorithm to extract labeled gait parameter curves to represent distinctive gait patterns. We define the averaged curve S¯z as a curve that averages all curves in the same cluster and is initialized as the curve with minimum Euclidean distance compared with all other curves. Then, for each cluster, distance function Ψzm(x, y) is the conventional DTW distance function between the sample xin the averaged curveS¯zand the sampleyat anyS˚mz in the m-th cluster,m= 1,· · · , M, given by:
Ψzm(x, y) = exp−ω¯zm(x, y)· S˚mz(y)−S¯z(x)
, (3)
where a shared weightω¯z
m(x, y)is computed as:
¯
ωmz(x, y) =
PK
k=1
1 P˚Sz m(y)=k
PK
k=1
Pmy
y0=1
1 P˚Sz
m(y0)=k
·
expφ PS¯z(x), P˚Sz m(y)
.
(4)
[image:5.612.79.267.344.423.2]121110987654321
121110987654321
1211 10 9 8 7 6 5 4 3 2 1
×× ×× ×× ×× ×× ×× ×× ×× λ1 ×× ×× ×× ×× ×××××× ×× ... × × ×× ×× ×× ... ... ... ×× × ××× ×× ... λ 12 ... × × × × × × × × ×××× × ×× × ×× ×××××× × ×× × × × × × ××× × × × ×× ×××× ×××× ... ...
S1, ,... SN
... ... ×× ×× ×× ×× ×× ×× ×× ×× ×× ×× ×× ×× ×××××× ×× ××× × × × ×× ×××× ×××× ×× ×××××× ×××× × ×× ×
Gait Cycles 1 N, ,...
12 12
S11, ,...SN1
S12 G12 ... ... ... ... S1 ... ... V1 V2 V G1 Gait Pattern Standardization Gait Cycle Detection
Gait Pattern Clustering
[image:6.612.128.505.62.247.2]Gait Pattern Averaging
Fig. 5: Proposed gait pattern extraction, showing steps from left to right: extraction of gait parameter curvesVλi via gait cycle detection,
then standardizing toSz (Step1), clustering toGz (Step2) and averaging asS¯z (Step3).
˚
Sz
m(y)−S¯z(x)in Eq. (3). We adopt these two measurements to tradeoff: 1) between S˚z
m(y) and cluster mean S¯z(x); 2) among gait phase labels PS¯z(x) and P˚Sz
m(y) for better gait
pattern generalization.
To obtain the corresponding gait phase label for each sample at the averaged curve S¯z, we first extract all warped paths between the averaged curve and all curves within a cluster via DTW using distance function Eq. (3). Then, we adopt min-max standardization to limit the path cost at each iteration of DBA. Finally, for each sample x, we measure the summed path cost for each possible label across all warped paths at all iterations and then label samplexas the label with minimum-sum path cost. Therefore, both numerical gait parameter value averaging and gait phase progress averaging are taken into account to obtain a good representation of a set of similar gait patterns.
Fig. 5 shows the overall gait pattern extraction process, with appropriate notation. The resulting series of the standardized curves S¯z are obtained by performing Steps 1-3 for the purpose of data reduction from a large number ofSz curves. For example, we obtain 2 to 7 clusters in S¯z for each z ∈ {λ1,· · · , λ12}, from a total 205 gait patterns Sz during our experiments.
Note that the class weights Ck=1,···,K of each gait phase label are further used during classification to address the class imbalance problem via:
Ck=1,···,K=
12·L
Pλ12
z=λ1
PL
l=1
1 PS¯z(l)=k
. (5)
B. Gait Phase Feature Extraction
Recall that our task is to classify each frame into one of K = 9 gait phases. Two main challenges in this multi-class gait phase classification problem are: (1) partial gait parameter curves due to both incomplete gait cycles and missing values due to the occlusion at joints of interest; (2) subject-sensitive gait patterns with varying gait speeds. In order to address these two challenges, inspired by image classification study [45],
we introduce the feature candidate pair and sliding window, to mitigate feature alignment, and random decision forest to handle the missing observations due to partial gait cycles.
In general, feature engineering of gait phase classification comprises: (1) Feature Alignment: extracting time-varying features to solve temporal misalignment that causes feature mismatch, such that extracted abstract features are invariant to gait speed and subject-dependent patterns. (2) Feature Mining: mine distinct feature pairs, reducing feature candidate pair set without sacrificing the performance.
1) Proposed Feature Alignment: To extract the transition information of adjacent gait phases, we use gait pattern curves
¯
Sz obtained as explained in Sec.III-A (Step 3). We slide a window across the frames, in order to extract time-varying and linearly separable temporal features. The extracted full gait cycle length L is set to be the length of the sliding window. Since some gait cycles are incomplete, we estimate the length of each incomplete gait cycle from full gait cycles based on the speed of the hip marker.
Considering the continuity of two adjacent gait pattern curves, we make S¯z periodic such that its starting frame is connected to the end frame (see Fig. 6) of its replica by:
˜
Sz= ¯
Sz(1) + ¯Sz(L)
2
¯
Sz(x) = ¯
Sz(x+L) x∈1−0.5L,· · ·,1
¯
Sz(x) +(τ L−x)( ˜Sz−S¯z(1))
τ L x∈1,· · ·, τ L
¯
Sz(x) x∈τ L,· · ·, L−τ L
¯
Sz(x) +(τ L+x−L)( ˜Sz−S¯z(L))
τ L x∈L−τ L,· · ·, L
¯
Sz(x−L) x∈L,· · ·,1.5L,
(6)
×
× ×
×
×
× ×
×
Standardized Frame
L 1.5L
1-0.5L
G
a
it
P
a
tt
er
n
Cur
v
e
S
2
_
× Local Extrema
l
l-0.5L l+0.5L
Target Sliding Window
T ʏ
ʐ ʑ
ʒ
T T
Move
0.5L
w w
w Sliding Window Start Frame
T Target Frame
Move w
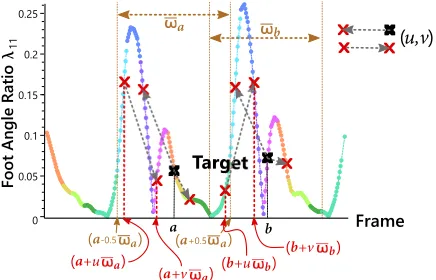
[image:7.612.155.461.62.204.2]1
Fig. 6: Feature candidate pair extraction in standardized frame domain: for target framel∈1, . . . , L, different candidate pairs(u, v), that link frames with local extrema, give different value responses in terms of knee angle ratioλ2. Same frames with local extrema give different (u, v)values for different target frames from 1 toL and its correspondingL-length sliding window starting from frame1−0.5Lto0.5L.
gait cycle averaging. The standardized time stamp at sample xbecomesx/Lgiven a fixed length ofLsamples of a sliding window, centered at x. In order to address misalignment of features, we introduce feature pair (u, v), where uandvtake values in the range[−0.5,0.5]with a minimum resolution step of 1/L to describe any two points near x within the sliding window.
To capture the time-varying features for each sample x within anL-length sliding window on the periodic gait pattern curve S¯z(x),z ∈ {λ1,· · ·, λ12}, given a feature pair (u, v)z for gait parameter z, we calculate the feature value as:
<l(u, v) =
kS¯z(l+uL)−S¯z(l+vL)k
|u−v| , (7)
where we set L = 100 during the training stage for all extracted gait patterns S¯z. As a result, we have L
2
= 4950
feature candidate pairs for each gait parameter, including
(−0.5,−0.49),(−0.5,−0.48),· · ·,(−0.5,0.5),(−0.49,
−0.48),· · · ,(0.49,0.5) as(u, v)z.
x
0 0.05 0.1 0.15 0.2 0.25
Foot Ang
le Ratio
x
x
x
x
x
x
Target
x
x
x
x
a
b
a b Frame
x
x
u,v
x
a a-0.5
( ) (a+0.5 a)
a
a+u
( )
a
a+v
( )(b+u b)
b
b+v
( )
11
λ
( )
Fig. 7:Feature pairs(u, v)at target framesaandb. We can observe different values of foot angle ratio parameterλ11for the same(u, v) pair at the target framesaandb.
In order to ensure the same time-varying feature statistics for the same (u, v) at the testing stage, we introduce the following equation to calculate the feature value:
<f(u, v) =
kVz(f+u$f)−Vz(f +v$f)k
|tz(f+u$
f)−tz(f+v$f)|
, (8)
In the above equation, for a framef,t(f+u$f)denotes the u shifted timestamp from the time at which target frame f is acquired given a $f-frame long sliding window centered at frame f. Thus, a gait sequence sampled from frame f +
u$f to framef+v$f represents a complete gait cycle. We demonstrate the feature pairs (u, v) in the time domain in Fig. 7.
2) Proposed Feature Mining: To reduce the size of the feature candidate pairs set, which we denote Ω, we select only the most informative pairs. We employ enhanced random decision forests (ERF) [46] to mitigate the issue of missing feature values that often occur near the boundary of the gait parameter curves.
Two mining approaches are proposed to extract the feature pairs: (1) filtering method: enumerate all (u, v) link com-binations in terms of standardized length L = 100 such that the quality of 12 L2
feature candidate pairs for all gait parameters is evaluated during mining; (2) optimized method: find all (u, v) link combinations of local extrema frames via Persistence1D [47]. We explain these two approaches and evaluate their performance next.
2.1)Filtering method (Alg. 1): We enumerate all possible
(u, v) link combinations of any two frames within an L -length sliding window centered on the target frame. Then we compute the feature values using (7) from the standardized curveS¯z extracted in Sec. III-A. To ensure the feature values are in the same feature space as the ERF model, we use Gini impurity [48] as evaluation metric to quantify the information content of a feature candidate pair. To avoid overfitting the ERF model, we select Pλ12
z=λ1num
z best feature candidates
from a total of 12 L2
candidate pairs, where numz is the resulting feature count for each gait parameterz. The distinct feature pairs are chosen via the followingCriteriaand Alg. 1: (1) Given a finite set of feature candidate pairs{(u, v)z
ε} for each gait parameterz, we compute Gini impurityGz
ε(Pa, Pb) (see Alg. 1) to separate samples with gait phase labelsPa and Pb,a, b∈ {1,· · ·, K} as a measure of qualityQzε(Pa, Pb)for theε-th feature candidate pair (u, v)εfor gait parameterz. (2) For each z, we calculate the quality Qz for all possible gait phase label combinations
[image:7.612.66.284.501.641.2]by:
Qz = (L
2)
X
ε=1 X
H∈H
Qzε(H). (9)
(3) To maximize the total quality, only numz distinct pairs with the highest quality are considered, where
numz= Ω
P(
L 2)
ε=1 P
H∈HQzε(H)
Pλ12
z=λ1
P
H∈HQz(H)
. (10)
Algorithm 1: Feature candidate pair filtering.
Input:Standardized gait pattern curves{Sz}(Sec.III-A); Potential feature candidate pair list {(u, v)z};
Output: Feature pair list{(u, v)z};
1 update standardized gait pattern curves{S¯z} via Eq. 6; 2 foreach z∈ {λ1,· · ·, λ12} do
3 foreach H = (Pa, Pb)∈ Hdo 4 foreach (u, v)∈ {(u, v)z} do
5 compute{<l(u, v)z}for all{S¯z}via Eq. 7; 6 find best split forPa andPb that minimizes
Gz
ε(Pa, Pb) = 1−p2Pa−p 2 Pb from {<l(u, v)z};
7 update {<l(u, v)z} for all{Sz} via Eq. 7; 8 update Gzε(Pa, Pb)using the found best split; 9 set Qzε(H) = 1− Gzε(H);
10 update Qz via Eq. 9;
11 estimate numz using Eq. 10; 12 foreach z∈ {λ1,· · ·, λ12} do
13 sort {(u, v)z} byQz; 14 keeptop numz in{(u, v)z};
2.2) Optimized method (Algs. 2 and 3): We observe heuristically that most of the distinct feature pairs link two frames where at least one frame has a local extrema value. Given the large time-varying feature value response and avail-ability of a more distinguishable difference for classifying two gait phases, a computationally more efficient way to extract feature candidate pairs (u, v) is to find those pairs that link local extrema.
For a standardized gait pattern curveS¯z, we propose Alg. 2 to extract feature candidate pairs {(u, v)z} where neighbour radius rz is designed to discard duplicate feature candidate pairs with similar feature values during adjacent frames. A good value forrz is determined as follows: find the minimum frame length for which any two distinguishable frames are separated, and calculate the median duration T¨p=1,···,K for each gait phase in the training sets. For example, for our datasets, we observed that min( ¨Tp=1,···,K) ≈ 6% of a gait cycle; therefore, we need to access at least rz = 6%L = 6 frames to observe two distinguishable frames within the same gait phase. Note that a standardized gait pattern curveS¯z=2for knee angle ratioλ2is first extracted as explained in Sec. III-A (see Fig. 6).
As shown in Fig. 6, the standardized frames from 1 toLare
Algorithm 2: Feature candidate pair detection.
Input:Standardized gait pattern curves{S¯z} (Sec.III-A); Neighbor radiusrz;
Output: Potential feature candidate pair list{(u, v)z}; 1 updatestandardized gait pattern curves{S¯z}via Eq. 6; 2 foreach framel∈ {1,· · · , L} do
3 findframes{fi=1:n}from frames
l−0.5L+ 1,· · ·, l+ 0.5L−1with local extrema and persistences β={βi=1:n}via [47];
4 ifn <2
√
L then
5 βthreshold=median(β);
6 else
7 βthreshold= 0;
8 keepframes{fj=1:˚n}with corresponding persistence βj< βthreshold;
9 forU ={fj=1:˚n}do
10 forV ={U,· · · , fj=˚n} do 11 ifV −U > rz then
12 add(u, v) = (UL−l,VL−l)to feature candidate pair list {(u, v)z};
Algorithm 3: Feature pair mining.
Input:Potential feature candidate pair list
{(u, v)z1,· · · ,{(u, v)zN
z} for each gait parameter
z∈ {λ1,· · · , λ12}; Desired Feature CountΩ;
Output: Feature pair list{(u, v)z}for each gait parameterz;
1 foreach zin{λ1,· · ·, λ12} do
2 fornz={1,· · · , Nz} do
3 estimateprobability of each candidate pair by Onz =
num((u,v)nz)
num((u,v)1,···,(u,v)Nz);
4 letOmedianz =median({O1,· · ·, ON z});
5 foreach (u, v)z in{(u, v)z} do
6 extractgait phase probabilities{p1(u,v)z,· · ·, p
K (u,v)z}
when (u, v)z is detected at its target framel;
7 foreach zin{λ1,· · ·, λ12} do
8 set feature countΩz=PΩλ12·Omedianz z=λ1Omedianz
;
9 sortfeature candidate pairs {(u, v)z} descending by probabilityOnz;
10 group{(u, v)z} by its top 2 gait phase labels with relative high gait phase probabilities;
11 addΩz (u, v)z in total of groups to feature pair list
{(u, v)z} balancedly based on class weights Ck=1,···,K;
pairs. For each enumerated frame inside the sliding window, we adopt Persistence1D [47] to extract local extrema and its persistence. In order to filter out those extrema with a relatively small value change, we heuristically use median persistence as threshold. For the remaining frames with local extrema, we link any two frames and compute its normalized offset to the target frame las feature candidate pair (u, v).
In order to reduce the feature dimension, we propose Alg. 3 to select the potential feature candidate pairs based on their probabilities of occurrence in terms of gait parameter z ∈ {λ1,· · ·, λ12}. This reduces the number of input feature candidate pairs when globally optimal feature selection criteria is applied, such that significant computation time is saved to maximize the factor of variation between gait phases.
Given a total of 12 L2
= 59,400 feature candidate pairs for all gait parametersz∈ {λ1,· · ·, λ12}, the filtering method examines each (u, v)pair by Gini impurity and selects those candidate pairs as per Eq. (10) on all extracted standardized gait patterns S¯ within the training samples. Instead of this exhaustive search (Alg. 3), the proposed optimized method first detects potential feature candidate pairs via Alg. 2 where those pairs with low feature response are dropped. Afterwards, the pairs will be selected according to their probabilities of occurrence in the training samples, via Alg. 3. Specifically, our proposed optimized feature extraction methods (Alg. 2 and Alg. 3) decrease the computational complexity of evaluating all feature candidate pairs from O(12· K2 L
2
·Mlog(M))
(recall that M is the total number of the input standard-ized curves Sz ∀z ∈ λ1,· · ·, λ12) to O(12M Llog(L)) +
O(MPλ12
z=λ1Nz) compared with the filtering method in
Alg. 1.
C. Gait Phase Reconstruction
After the ERF-based frame-wise classification, we re-segment each gait phase period using the proposed gait phase reconstruction approach described next.
Since the gait phase is defined as the period between two adjacent gait events, the gait phase label sequence is a periodic piece-wise smooth signal. The gait phase label sequence obtained by the gait phase classifier, described in the previous subsection, sometimes contains classification errors and could even be non-periodic. To improve the final classification result, we use the fact that the labels sequence changes smoothly over time.
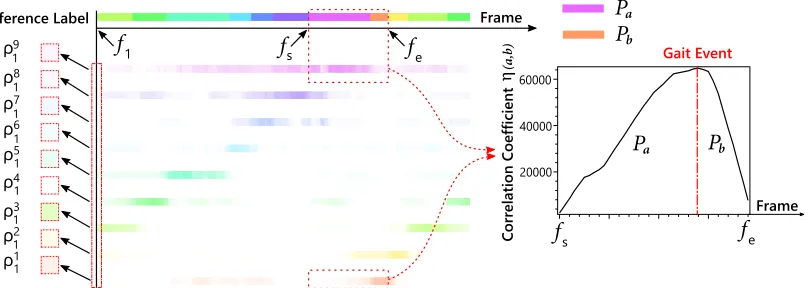
In particular, we first locate a gait event as a time-stamp within two adjacent gait phases. Then, we obtain a class probability vector ρf = {ρ1f,· · ·, ρ
K
f}, given feature values
<z(u, v) for each frame f from the trained ERF model as discussed in Sec. III-B. Since, as shown in Fig. 8, mis-classification often occurs near the boundary of two adjacent gait phases, we introduce a correlation coefficient ηf in Eq. (11) to capture similarity between adjacent gait events Pa andPb, within the framesfs,· · ·, fe:
ηf(a, b) = f X
i=fs
ρai fe X
i=f ρbi −
f X
i=fs
ρbi fe X
i=f
ρai. (11)
As shown in Fig. 8, we refine the gait phase labels by detecting the gait event at the moment when the correlation coefficient reaches the global maximum. We keep updating, iteratively, the gait phase labels until convergence.
IV. SYSTEMVALIDATION
In this section we report our experimental results2. Each step proposed in the methodology section is assessed in terms of classification accuracy and complexity in order to show its importance towards the final result. Each step is benchmarked against relevant algorithms in the literature.
Joint trajectories are obtained using the MS Kinect v2-based motion capture system of [4], which does not rely on Kinect skeleton data and shows close accuracy to commercial 12-camera VICON system [14]. Note that, our proposed algorithms are applicable to other motion capture systems, requiring only 10 standard joint trajectories defined in the widely used Plug-in-Gait model [49] for gait assessment as input. However, the overall gait phase classification perfor-mance will depend on the tracking accuracy of the employed motion capture system.
9 stroke survivors and 6 healthy volunteers were asked to walk for 6 meters while the middle 4-meter motion is recorded at two different rehabilitation sessions. All 15 participants read the participant information sheets and completed the consent forms before data collection The study covered in this paper is conducted with ethical approval from both National Health Service (NHS) and University of Strathclyde Ethics Committee (UEC). As per similar experiments in [12], [27], [30] where 15 subjects, 10 subjects (116 strides), and 25 strides are used, respectively, in our experiments, 126 records (613 strides) are captured from 15 subjects with various walking speeds, directions and patterns. We acquire trajectories of hip, knee, ankle, toes, heels joints during the 4-meter walking test. To form ground-truth for classifying K = 9 gait events, we first manually identify all frames that separate adjacent gait phases by finding specified gait poses defined in [41]. Then, the timestamps are carefully refined by pose template matching on interpolated gait parameters (see Table I). Finally, we assign a gait phase label to each frame by slicing the extracted gait events.
To evaluate the classification performance, we use classifica-tion accuracy (ACC), average receiver operating characteristic (ROC) curve [22], [50] and area under the curve (AUC) [50] as evaluation metrics. ACC is defined as the percentage of correctly classified frames across all sequences. The average ROC is plotted by measuring the true positive rate (TPR) and false positive rate (FPR) based on one-versus-all binary classi-fication across all sequences and all gait phases. For each gait phase k, the corresponding TPR measures the proportion of frames at phasekthat are correctly classified. FPR calculates the proportion of frames not at gait phasekthat are incorrectly classified as gait phase k frames. We divide our dataset into training and testing set, where the training set comprises stroke survivors 1-5 and healthy volunteers 1-3, and testing
2Code to reproduce our experiments is available at https://github.com/
ρ1
ρ8
ρ7
ρ6
ρ5
ρ4
ρ3
ρ2
ρ1
Reference Label Frame
20000 40000 60000
f
sf
e9
1
1
1
1
1
1
1
1
f
1f
sf
eFrame
Corr
elation Coef
ficien
t
η
Gait Event
P
aP
bP
aP
b [image:10.612.109.513.61.205.2](a,b)
Fig. 8: Class probability representation in a complete gait cycle and correlation coefficient for adjacent gait phase periods. Unique color is assigned to each gait phase label where low transparency means low probability of the label occurrence at specified frame.
set comprises stroke survivors 6-9 and healthy volunteers 4-6. Grid search is adopted to tune hyper-parameters.
We evaluate the importance of different steps in the pro-posed system (Fig. 3) in the following way. First, to justify the selection of ERF as classifier, we tested One vs One multi-class SVM and classical two-layer softmax NN against ERF. To test the reliability and validity of the defined 12 gait parameters at frame-wise level, we feed to the classifiers normalized trajectories and compare performance when the proposed 12 gait parameters are used as features instead. To assess the value of gait phase reconstruction, we test schemes with and without this step.
We group our evaluations and benchmarking as follows: (1) Schemes denoted with SVM1, NN1, and ERF1 use nor-malized joint trajectories as input (as discussed in [51]), e.g., acquired joint trajectory sequences from the output of video-based motion capture are fed directly into the classifier (after normalization); (2) Schemes denoted with the classifier name without any superscripts, e.g., SVM, NN, and ERF, perform Kinematics Extraction and the proposed Gait Cycle Detection (see Fig. 3) and feed the resulting gait cycle curves Vz(λ) directly into the classifier; (3) The scheme denoted by NARX-NN uses the state-of-the-art NARX-NARX-NN model [30] (we use Matlab 2016a Neural Time Series toolbox) on the standardized gait cycle curves Sz; since the NARX-NN performs worse when data with incomplete gait cycle is used, we only use frames with complete gait cycles. (4) NARX-NN2,Filtering2
(Alg. 1) andOptimized2 (Alg. 2 and Alg. 3), denote NARX-NN, the proposed system with feature candidate pair filtering, and the proposed system with feature candidate pair detection and feature pair mining, respectively, without the Gait Phase Reconstruction block. (5) The proposed Filteringand Opti-mized schemes with all the steps, e.g., including Gait Phase Reconstruction.
Note that for the NARX-NN model, given a regression resultΓf at framef [30], its corresponding gait phase label is P(f) =1bΓfc modK= 0 ·K+bΓfc modK, where1 all ones matrix,b·creturns the first smaller integer, and mod
returns a remainder, and the corresponding class probability is
calculated by:
ρkf= (
1− |k−Γf| k∈ {bΓfc,dΓfe}
0 k6∈ {bΓfc,dΓfe}.
(12)
Levenberg-Marquardt method is used to train a two-layered NARX-NN. In the experiments, data is randomly spit into 70% data used for training, 15 used for validation and 15% used for testing. All9×10trained networks are evaluated for the 15% testing data for time delays from 1-9 frames with 10 network per time delay. The mean ACC of the NARX-NN model is evaluated in [1], showing that the best result is obtained for an input time delay of 8 frames; this will be used in the following experiments.
For our proposed gait phase classification system, we ran-domly choose approximately 80% of the training data as training set and the rest as validation to tune hyper parameters. Note that both sets include frames with incomplete gait cycles, to match the training configurations using NARX-NN. We train 20 sets of ERF models with depth 20 and 30 trees to evaluate the ACC for various sizes of feature candidate pair set, Ω.
The results are shown in Table II and Fig. 9. The advan-tage of an improved characterized gait presentation using the proposed kinematics extraction method can be observed from Table II and Fig. 9. The methods that apply the proposed Kinematics Extraction (SVM, NN, ERF) show a significant ACC and AUC improvement over feeding normalized joint trajectories to the classifiers (schemes with superscript 1). Indeed, SVM consistently and significantly outperforms SVM1 with both higher ACC and AUC, while ERF, NN, ERF1 and NN1 show similar results, but all being significantly worse than the proposed (Filtering and Optimized) methods. NARX-NN generally outperforms SVM and NARX-NN classifiers, but it is consistently outperformed by the proposed method.
TABLE II: Best performance (in terms of ACC in[%]) for allK= 9gait phase classes for all tested schemes.
Gait Phase Class 1 2 3 4 5 6 7 8 9 Mean
SVM1 52.3 38.7 72.8 55.2 66.3 68.7 86.4 83.6 75.7 67.7
NN1 62.0 49.1 80.8 80.6 78.7 81.6 90.8 87.4 80.8 77.7 ERF1 51.6 54.7 83.3 78.6 73.1 70.6 92.2 83.2 71.2 74.1 SVM 81.4 61.9 74.1 66.4 79.6 87.5 88.5 87.9 82.1 79.3
NN 79.7 60.5 77.3 75.6 80.4 83.7 87.6 89.9 79.6 80.0
ERF 69.7 61.9 78.8 75.0 80.9 84.2 88.5 89.2 77.3 81.1
NARX-NN2 79.7 82.4 81.8 80.4 79.4 82.9 84.5 87.3 86.2 83.3
Filtering2 81.7 85.5 82.4 83.2 82.1 84.3 82.0 87.8 86.3 84.5
Optimized2 83.1 87.2 86.7 85.3 84.3 85.2 83.2 88.5 86.3 86.1
NARX-NN 82.3 91.2 90.3 90.3 81.9 88.2 92.9 88.5 89.1 88.8
Filtering 98.2 99.1 99.1 98.6 97.6 98.7 98.4 98.2 97.8 98.9
Optimized 98.5 99.3 99.2 98.9 98.0 98.7 98.7 98.2 98.0 99.2
0 0.2 0.4 0.6 0.8 1
False Positive Rate
0 0.6 0.8 1
True Positive Rate
SVM1(AUC=0.9155)
NN1(AUC=0.9779)
ERF1(AUC=0.9700)
SVM (AUC=0.9638) NN (AUC=0.9818) ERF (AUC=0.9812)
NARX-NN2(AUC=0.9816)
Filtering2(AUC=0.9890) Optimized2(AUC=0.9882)
NARX-NN (AUC=0.9884)
Filtering (AUC=0.9980) Optimized (AUC=0.9982)
0 0.05 0.1 0.15 0.2 0.8
[image:11.612.319.557.62.388.2]0.85 0.9 0.95 1
Fig. 9:Average ROC curves for all tested schemes.
Optimized and Filtering methods consistently outperform all prior benchmarks.
Next, in Figs. 10 and 11, we compare more closely the two proposed approaches of feature candidate pair mining, Filter-ing and Optimized. Since the FilterFilter-ing method enumerates L2 feature candidate pairs for each gait parameter during feature extraction and mining, we can observe that the ERF model is over-fitted when the feature number reaches approximately 630 with the highest final ACC. On the other hand, for the Optimized method that extracts all feature candidate pairs with local extrema linkage, a smaller feature number can achieve higher ACC. Both validating and testing ACCs at the classifier stage are improved by using the optimized feature candidate pair detection and mining method (Algs.2 and 3).
0 200 400 600 800 1000
80 84 88 92 96
ACC (%)
Filtering2
Optimized2
Fig. 10: Validating performance (ACC) of the two mining methods during classifier stage using ERF.
0 200 400 600 800 1000
80 84 88 92 96 100
ACC (%)
Filtering2
Optimized2
Filtering Optimized
Fig. 11: Testing performance (ACC) of the four mining methods before and after gait phase reconstruction using ERF.
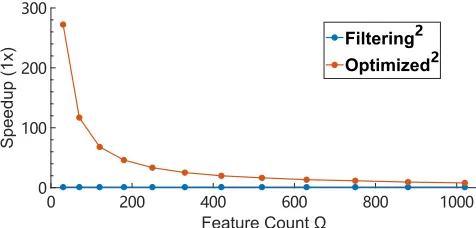
To evaluate the computational efficiency, we define Speedup = Tbaseline/Tevaluate, where Tbaseline is the av-erage total execution time required to train a classifier using the proposed filtering method, while Tevaluate refers to the average total execution time for obtaining the results using the evaluated methods (e.g., Alg. 2 + Alg. 3, or NARX-NN). For instance, the Speedup of optimized mining approach during testing equals to the execution time ratio between optimized and filtering mining approach on testing sets using correspond-ing trained models. The experiments were performed on an Intel i7-4710HQ 2.5GHz CPU, Windows10 OS, implemented using Visual C++ and Matlab 2016a.
Fig. 12 confirms that there is a large computation perfor-mance boost using the proposed optimized feature candidate mining approach compared to the filtering method. The re-duction in computation time comes from detecting feature candidate pairs with local extrema linkage before selection instead of using Gini impurity calculations.
[image:11.612.54.296.600.718.2]0 200 400 600 800 1000 0
100 200 300
Speedup (1x)
Filtering2
[image:12.612.55.293.55.169.2]Optimized2
Fig. 12: Computation performance (1x times of baseline) of the proposed feature extraction methods: the base line computation time is measured using the filtering method with 1020 feature candidate pairs.
also observe a slight improvement in the final ACC and smaller best ACC feature count after the gait phase reconstruction process, as shown in Fig. 11.
Finally, we compare computational efficiency with the NARX-NN model-based method, where for fair comparison, we use the frames with full gait cycles only. The parameters for each method are set to achieve their best final ACCs. We reportSpeedupof the three approaches in Table III. Note that the corresponding best ACC results for these three methods are shown in Table II. It can be seen that Optimized method is the fastest method, 2 to 6 times faster than the NARX-NN model.
TABLE III:Speedup(1x times of baseline) of the proposed feature extraction methods and NARX-NN model corresponding to their highest ACC.
Method Filtering Optimized NARX-NN
Train 1 18.2 3.1
Test 253 1286 1110
V. CONCLUSION
We propose a gait phase classification system suitable for clinical diagnostics during rehabilitation programmes. Specifically, we propose gait pattern extraction based on 12 defined gait parameters to help feature extraction from a noisy large-scale dataset via clustering and averaging using proposed distance functions. We mitigate feature misalignment by introducing gait pattern standardization. Optimized feature candidate pair detection and mining algorithms (Algs. 2, 3) are proposed to reduce the computational complexity without sacrificing the classification performance. In order to refine the gait phase labels, we developed a classification approach to relocate the gait events between adjacent gait phases. The overall proposed, frame-wise, multi-channel, time-series classification algorithm demonstrates a significant accuracy and computational complexity improvement with respect to the state-of-the-art NARX-NN model.
VI. ACKNOWLEDGMENT
This project has received funding from the Euro-pean Unions Horizon 2020 research and innovation programme under the Marie Skodowska-Curie grant agreement No 734331. The University of Strathclyde gratefully acknowledges the support of NVIDIA Cor-poration with the donation of the Titan Xp GPU used for this research.
REFERENCES
[1] M. Yeet al., “Gait phase classification for in-home gait assessment,” in 2017 IEEE International Conference on Multimedia and Expo (ICME), July 2017, pp. 1524–1529.
[2] C. Yanget al., “Autonomous gait event detection with portable single-camera gait kinematics analysis system,”Journal of Sensors, Dec 2015. [3] C. Yang, U. Ugbolue, D. McNicol, V. Stankovic, L. Stankovic, A. Kerr, B. Carse, K. Kaliarntas, and P. Rowe, “Automation enhancement and accuracy investigation of a portable single-camera gait analysis system,” IET Science, Measurement and Technology, pp. 1–9, 2019.
[4] M. Ye et al., “A depth camera motion analysis framework for tele-rehabilitation: Motion capture and person-centric kinematics analysis,” IEEE JSTSP, vol. 10, pp. 877 – 887, Aug. 2016.
[5] B. J. E. Misgeld et al., “Body-sensor-network-based spasticity detec-tion,”IEEE JBHI, vol. 20, no. 3, pp. 748–755, May 2016.
[6] C. Zhanget al., “Classification of eeg signals using multiple gait features based on small-world neural network,” inInt. Conf. Ubiquitous Robots and Ambient Intelligence, Aug 2016, pp. 61–66.
[7] Q. T. Lyet al., “Detection of gait initiation failure in parkinson’s disease patients using eeg signals,” in 2016 38th Annual Int. Conf. the IEEE EMBC, Aug 2016, pp. 1599–1602.
[8] Y. D. Xuan et al., “Elderly gait analysis and assessment based on body area network,” inGreenCom IEEE Int. Conf. Cyber, Physical and Social Computing and Communications, Aug 2013, pp. 1729–1733. [9] M. Derawiet al., “Fusion of gait and ecg for biometric user
authenti-cation,” inInt. Conf. BIOSIG, Sep 2014, pp. 1–4.
[10] “M3d,” http://www.tecgihan.co.jp/en/products/m3d forceplate, Jan 2019.
[11] J.-T. Zhanget al., “Concurrent validation of xsens mvn measurement of lower limb joint angular kinematics,” Physiological Measurement, vol. 34, no. 8, p. N63, 2013.
[12] J.-Y. Jung et al., “A neural network-based gait phase classification method using sensors equipped on lower limb exoskeleton robots,” Sensors, vol. 15, no. 11, pp. 27 738–27 759, Oct 2015.
[13] J. Taborriet al., “A novel hmm distributed classifier for the detection of gait phases by means of a wearable inertial sensor network,”Sensors, vol. 14, no. 9, pp. 16 212–16 234, Sep 2014.
[14] VICON, “Motion capture,” http://www.vicon.com, Jan 2019. [15] Qualisys, “Motion analysis,” http://www.qualisys.com, Jan 2019. [16] C. Yang et al., “Human upper limb motion analysis for post-stroke
impairment assessment using video analytics,”IEEE Access, vol. 4, pp. 650 – 659, Feb 2016.
[17] A. Leuet al., “A robust markerless vision-based human gait analysis system,” inIEEE SACI, May 2011, pp. 415–420.
[18] Y.-R. Li et al., “A gait analysis system using two cameras with orthogonal view,” inMultimedia Technology (ICMT), 2011 Int. Conf., July 2011, pp. 2841–2844.
[19] “Developing with kinect for windows,” https://developer.microsoft.com/ en-us/windows/kinect, Jan 2019.
[20] E. Gianaria et al., “Kinect-based gait analysis for automatic frailty syndrome assessment,” inIEEE ICIP, Sep 2016, pp. 1314–1318. [21] D. Podsiadloet al., “The timed “ up & go”: A test of basic functional
mobility for frail elderly persons,”Journal of the American Geriatrics Society, vol. 39, no. 2, pp. 142–148, 1991.
[22] Q. Zou, L. Ni, Q. Wang, Q. Li, and S. Wang, “Robust gait recognition by integrating inertial and rgbd sensors,”IEEE transactions on cybernetics, vol. 48, no. 4, pp. 1136–1150, 2018.
[23] C. Yang, G. Cheung, V. Stankovic, K. Chan, and N. Ono, “Sleep apnea detection via depth video and audio feature learning,”IEEE Transactions on Multimedia, vol. 19, no. 4, pp. 822–835, April 2017.
[25] G. Paolini et al., “Validation of a method for real time foot position and orientation tracking with microsoft kinect technology for use in virtual reality and treadmill based gait training programs,”IEEE TNSRE, vol. 22, no. 5, pp. 997–1002, Sep 2014.
[26] R. A. Clarket al., “Validity of the microsoft kinect for assessment of postural control,”Gait & Posture, vol. 36, no. 3, pp. 372–377, 3 2012. [27] Y. Yang et al., “Reliability and validity of kinect rgb-d sensor for assessing standing balance,”IEEE Sensors Journal, vol. 14, no. 5, pp. 1633–1638, May 2014.
[28] Z. Liu, Z. Lin, X. Wei, and S. Chan, “A new model-based method for multi-view human body tracking and its application to view transfer in image-based rendering,”IEEE Transactions on Multimedia, vol. 20, no. 6, pp. 1321–1334, June 2018.
[29] D. Peterset al., “Assessing the reliability and validity of a shorter walk test compared with the 10-meter walk test for measurements of gait speed in healthy, older adults,”Journal of geriatric physical therapy, vol. 36, pp. 24–30, March 2013.
[30] C. Galv´an-Duqueet al., “Comparison between classical and intelligent identification systems for classification of gait events,”J. Control Science and Engineering, vol. 1, pp. 21–34, 2015.
[31] R. Vemulapalli et al., “Human action recognition by representing 3d skeletons as points in a lie group,” inIEEE CVPR, June 2014, pp. 588– 595.
[32] R. Vemulapalliet al., “Rolling rotations for recognizing human actions from 3d skeletal data,” inIEEE CVPR, June 2016, pp. 4471–4479. [33] S. Zhanget al., “A review on human activity recognition using
vision-based method,”Journal of Healthcare Engineering, July 2017. [34] Z. Liu and S. Sarkar, “Improved gait recognition by gait dynamics
normalization,” IEEE Transactions on Pattern Analysis and Machine Intelligence, vol. 28, no. 6, pp. 863–876, 2006.
[35] J. Zhaoet al., “Gait assessment using the kinect rgb-d sensor,” inIEEE EMBC, Aug 2015, pp. 6679–6683.
[36] F. Gholamiet al., “A microsoft kinect-based point-of-care gait assess-ment framework for multiple sclerosis patients,”IEEE JBHI, vol. PP, no. 99, pp. 1–1, 2016.
[37] Q. Wang et al., “Unsupervised temporal segmentation of repetitive human actions based on kinematic modeling and frequency analysis,” in3DV 2015, Nov 2015, pp. 562–570.
[38] J. D. Farah, N. Baddour, and E. D. Lemaire, “Gait phase detection from thigh kinematics using machine learning techniques,” in2017 IEEE International Symposium on Medical Measurements and Applications (MeMeA), May 2017, pp. 263–268.
[39] C. wei Hsu, C. chung Chang, and C. jen Lin, “A practical guide to support vector classification,” http://www.csie.ntu.edu.tw/∼cjlin/papers/ guide/guide.pdf, 2010.
[40] S. Mulroyet al., “Use of cluster analysis for gait pattern classification of patients in the early and late recovery phases following stroke,”Gait & Posture, vol. 18, no. 1, pp. 114–125, 2003.
[41] W. R. Frontera, Ed., DeLisa’s Physical Medicine & Rehabilitation: Principles and Practice, 5th ed. Lippincott Williams & Wilkins, 2010, vol. 1, ch. 5, pp. 121–137.
[42] P. Sharmaet al.,Efficient Density-Based Clustering Using Automatic Parameter Detection. Springer, 2016, vol. 1, pp. 433–441.
[43] F. Petitjeanet al., “A global averaging method for dynamic time warping, with applications to clustering,”Pattern Recognition, vol. 44, no. 3, pp. 678 – 693, 2011.
[44] J. S. Wanget al., “Walking pattern classification and walking distance estimation algorithms using gait phase information,” IEEE TBME, vol. 59, no. 10, pp. 2884–2892, Oct 2012.
[45] J. Shotton et al.,Efficient Human Pose Estimation from Single Depth Images. Springer, 2013, pp. 175–192.
[46] S. Bharathidason et al., “Improving classification accuracy based on random forest model with uncorrelated high performing trees,”IJCA, vol. 101, no. 13, pp. 26–30, Sep 2014.
[47] T. Weinkauf et al., “Persistence1d: Extracting and filtering minima and maxima of 1d functions,” https://www.csc.kth.se/∼weinkauf/notes/ persistence1d.html, Jan 2019.
[48] L. Breiman,Classification and regression trees. Routledge, 2017. [49] VICON, “Plug-in-gait model,” https://www.vicon.com/downloads/
documentation/plug-in-gait-model-details, Jan 2019.
[50] T. Fawcett, “An introduction to roc analysis,”Pattern recognition letters, vol. 27, no. 8, pp. 861–874, 2006.
![TABLE II: Best performance (in terms of ACC in [%]) for all K = 9 gait phase classes for all tested schemes.](https://thumb-us.123doks.com/thumbv2/123dok_us/1358580.89354/11.612.51.535.55.392/table-best-performance-terms-phase-classes-tested-schemes.webp)