City, University of London Institutional Repository
Citation
:
Silva, N., Blascheck, T., Jianu, R., Rodriguez, N., Raubal, M., Schreck, T. and
Weiskopf, D. (2019). Eye Tracking Support for Visual Analytics Systems. In: Krejtz, K. and
Sharif, B. (Eds.), ETRA '19 Proceedings of the 11th ACM Symposium on Eye Tracking
Research & Applications. (11.). New York, USA: ACM. ISBN 978-1-4503-6709-7
This is the accepted version of the paper.
This version of the publication may differ from the final published
version.
Permanent repository link:
http://openaccess.city.ac.uk/id/eprint/21945/
Link to published version
:
Copyright and reuse:
City Research Online aims to make research
outputs of City, University of London available to a wider audience.
Copyright and Moral Rights remain with the author(s) and/or copyright
holders. URLs from City Research Online may be freely distributed and
linked to.
Eye Tracking Support for Visual Analytics Systems
Foundations, Current Applications, and Research Challenges
Submission 20
ABSTRACT
Visual analytics (VA) research provides helpful solutions for in-teractive visual data analysis when exploring large and complex datasets. Due to recent advances in eye tracking technology, promis-ing opportunities arise to extend these traditional VA approaches. Therefore, we discuss foundations for eye tracking support in VA systems. We first review and discuss the structure and range of typical VA systems. Based on a widely used VA model, we present five comprehensive examples that cover a wide range of usage sce-narios. Then, we demonstrate that the VA model can be used to systematically explore how concrete VA systems could be extended with eye tracking, to create supportive and adaptive analytics sys-tems. This allows us to identify general research and application opportunities, and classify them into research themes. In a call for action, we map the road for future research to broaden the use of eye tracking and advance visual analytics.
CCS CONCEPTS
•Human-centered computing→Visual analytics;Interactive systems and tools;Visualization theory, concepts and paradigms;
KEYWORDS
Eye tracking, visual analytics, gaze-adaptive systems, support
ACM Reference Format:
Anonymous Author(s). 2019. Eye Tracking Support for Visual Analytics Systems: Foundations, Current Applications, and Research Challenges. In ETRA ’19: 2019 Symposium on Eye Tracking Research and Applications, June 25–28, 2019, Denver, Colorado.ACM, New York, NY, USA, 10 pages. https: //doi.org/10.????/???????.??????
Permission to make digital or hard copies of part or all of this work for personal or classroom use is granted without fee provided that copies are not made or distributed for profit or commercial advantage and that copies bear this notice and the full citation on the first page. Copyrights for third-party components of this work must be honored. For all other uses, contact the owner/author(s).
ETRA ’19, June 25–28, 2019, Denver, Colorado
© 2019 Copyright held by the owner/author(s). ACM ISBN ???.
https://doi.org/10.????/???????.??????
1
INTRODUCTION
Reliable eye tracking is now affordable enough that it can be inte-grated into regular workstations to support a variety of day-to-day work and leisure activities. This paper maps the road for using eye tracking in an area, in which this technology holds particular promise: Visual Analytics (VA).
VA describes a range of technologies that rely primarily on visual representations, interaction, and human-steered computation for analysts to explore, analyze, and make decisions with and from data. VA systems are, for example, an interactive website that allows people to visually explore and understand historical migration data from different perspectives; a biomedical desktop application that lets researchers analyze complex experimental data; or a crisis management command center setup involving many screens, real-time data, and multiple decision makers.
The common theme of VA systems is that they communicate with analysts primarily through the visual channel. We hypothesize that this makes VA systems particularly amenable to an integration with eye tracking. Up to now, only a few eye-based VA systems exist [Okoe et al. 2014; Shao et al. 2017; Silva et al. 2018, 2016b]. We believe that the next generation of VA systems could more broadly use eye tracking to infer and learn analysts’ interests, goals, workflows, and tasks to proactively support them.
2
RELATED WORK
Guidance systems [Collins et al. 2018] and recommender systems are emerging topics in VA and both demonstrated potential in sup-porting analysts. Using eye tracking we can potentially infer what people focus on [Just and Carpenter 1980]. Therefore, eye tracking offers a new and important channel through which applications and analysts can interact with each other. Because eye tracking is becoming affordable and allows systems to provide recommen-dations and guide analysts in data analysis processes, we discuss each of these topics individually, and give first hints about how to achieve eye tracking supported VA.
2.1
Recommender Systems and Eye Tracking
Recommender systems assist people in identifying potentially inter-esting items. With applications in many domains (e.g., e-commerce, information retrieval, or social media) recommendation technology is the target of constant improvements due to its real application value. These improvements and the use of pervasive techniques (e.g., eye tracking) in new recommendation applications were discussed in previous work [Felfernig et al. 2013]. Example recommender systems that integrate eye tracking were developed to help and guide people, select products [Castagnos et al. 2010; Castagnos and Pu 2010; Chen and Pu 2011], support reading, browse images, watch videos [Xu et al. 2008], assist air traffic controllers [Silva et al. 2015; Zhao et al. 2016], or recognize activities on cartographic maps [Kiefer et al. 2013]. In addition, advantages and pitfalls of using eye movement data in adaptive systems were discussed [Bed-narik 2005]. Techniques to estimate human preferences were also developed, such as an evolutionary recommendation system [Jung et al. 2013], a support vector machine to distinguish user activi-ties [Kiefer et al. 2013], and a collaborative filtering approach to increase the accuracy of recommendations [Song and Moon 2017].
Also, Renner and Pfeiffer [2017] have used eye tracking for attention guiding in the context of assistance through augmented reality. In addition, Blattergerste et al. [2018] compared selection mechanisms in VR, which included eye gaze.
2.2
Guidance in Visual Analytics
Guidance is an important component in the support of analysts when exploring large datasets. An example is the use of advising mechanisms that point analysts to interesting data features or clus-ters. Ceneda et al. [2017] presented a model to classify key aspects of guidance in VA. A selection of challenges associated with the imple-mentation of guidance were then discussed by Collins et al. [2018], including the use of external inputs to guidance systems, such as eye tracking. Although this work already identifies eye tracking as a mean for guidance, it is not the main suggested mechanism, and its described role in the survey remained preliminary.
2.3
Visual Analytics and Eye Tracking
Eye tracking is also finding its way into evaluation of VA sys-tems [Andrienko et al. 2012; Kurzhals et al. 2014]. In addition, a multitude of visualization techniques for analyzing eye movement data have been developed [Blascheck et al. 2017]. In addition, an analysis of VA systems using eye tracking and the visualization of
the collected eye movement data has been proposed in combina-tion [Blascheck et al. 2016].
However, the above approaches did not discuss how eye track-ing could guide analysts in their actual interactive analysis of data (i.e., while using a VA system). Only a few recent works proposed and implemented eye tracking support for VA systems. Steichen et al. [2013] investigated how to infer visualization tasks and cognitive abilities from eye movement data using bar and radar graphs. Silva et al. [2016a] used eye tracking to control a degree-of-interest dis-play when exploring hierarchically organized data. Shao et al. [2017] proposed an exploration of scatter plot sets by recommending un-seen scatter plots most dissimilar to un-seen ones. Silva et al. [2018] combined interaction with eye tracking and data features to com-pute rankings of time series and perform recommendations. These examples are encouraging and indicate the usefulness of integrating eye tracking into VA systems. However, they might not generalize well to certain tasks or data types.
Up to now, a systematic review of challenges, and a road map of how to achieve eye tracking support for VA systems is missing. Therefore, we provide such a road map in this paper,give examples of common VA systems for different domains and contexts, discuss how eye tracking can be integrated within these contexts, and organize research challenges associated with this endeavor.
3
BACKGROUND — VA PROCESS MODEL
VA encompasses technologies by which analysts relate to data by means of interactive data visualization, tightly integrated with data analysis algorithms, supporting the discovery of actionable insights into large and complex data. As a research field, VA builds on multiple disciplines, including analytical reasoning and human cognition, planning and decision making, visual representations and interaction techniques, data mining and machine learning, data management technologies, among others [Keim et al. 2010; Thomas and Cook 2005].
To describe a VA process, Keim et al. [2008] defined a well-known process-driven model (cf. Figure 1). As mentioned above, the VA process suggests that analysts aim to obtain insight into data by approaches that integrate data visualization and analysis. The vi-sual analysis process is highly interactive, supporting analysts in interacting with the visualization (e.g., create views, drill down into views), and the data analysis model (e.g., select or configure analysis methods, clustering, classification, find suitable parameters).
To organize the discussion of how eye tracking can be integrated into VA systems, we consider the mentioned VA model. We enhance the four high-level building blocks of this VA model (Data, Visual-ization, Model, and Knowledge) with more detailed concepts (e.g., system, analysts’ tasks, parameters, cf. Figure 1). Note, this specifi-cation serves our discussion goals. More encompassing extensions of the basic model have been suggested by others (e.g., Sacha et al. [2014], which details the knowledge generation process).Next, we further explain the detailed concepts that we introduced into the VA model.
Eye Tracking Support for Visual Analytics Systems ETRA ’19, June 25–28, 2019, Denver, Colorado
Figure 1:VA process model by Keim et al. [2008]. We further detail this model with context, system, and the analyst to discuss how to integrate eye tracking into VA systems.
analysis (e.g., input or output factors in production), or social media analysis (e.g., large networks and high-frequency messaging). An analyst may for example use a VA system in the lab, real-world emergency situations in the field using mobile devices, or in the office. The context relates to both the system aspects as well as the analysis goals and tasks.
Analyst.The range of analysts using VA systems is broad. We can divide them into experts and novices in a specific domain or in visualization. A domain and visualization expert could be a data journalist, whereas a domain expert with less knowledge in visual-ization could be a biologist. Typically, visualvisual-ization researchers are experts in the field of visualization, however, they do not necessar-ily have specific domain knowledge. Lastly, an increasing number of people that are neither domain nor visualization experts (general public) are interested in analyzing data.
Knowledge.Analysts using a VA system usually have multiple specific goals in mind. These goals can be reached by performing multiple analytic tasks. Shneiderman [1996] defined a widely-used taxonomy of analytic tasks that are universally applicable: overview, zoom, filter, details-on-demand, relate, history, and extract tasks. Similarly, Pike et al. [2009] defined goals and tasks of analysts. However, they further divided the analytic discourse of an analyst with a VA system into low-level choices versus high-level goals for an investigated problem. Knowledge obtained from the VA can occur in implicit or explicit form [Federico et al. 2017].
System.The VA system comprises the implementation of a VA design that runs on a specific hardware and software platform. It typically involves different visual media and interaction modalities. The range spans from desktop computers to tablets, smartphones, smart watches, public or wall-sized displays, virtual and immer-sive environments. The system specifications determine the many performance aspects it may deliver (e.g., response time, display res-olutions, interaction modalities). Recently, natural user interfaces like voice and gesture recognition are being considered, in addition to typical desktop interaction modalities. Eye tracking capabilities can also extend these systems.
Data.The data analyzed in a VA system originates from dif-ferent data sources and represent multiple data types. The data sources can be from real world measurements and observations (e.g., medical images, seismic data, astronomy) or theoretical/virtual world measurements using mathematical and simulation models (e.g., molecular dynamics, meteorology, economic or financial mod-eling, simulation). The data from these sources can have different
data types. Shneiderman [1996] defines seven data types: 1D, 2D, 3D, temporal, multi-dimensional, hierarchical (tree), and network. Typically, the first step before analyzing the data is to pre-process and transform the data into an appropriate form for further explo-ration. This may include data cleansing, normalization, grouping, or integration of multiple heterogeneous data sources [Keim et al. 2008]. Important aspects of data influencing the analysis process include the quality of the data that may be affected by missing data values, erroneous measurements, uncertainty, and others.
Visualization.After the data is transformed into an appropri-ate form, it can be mapped to a visualization technique. The build-ing blocks of a visualization accordbuild-ing to Bertin [1967] are marks (points, line, areas) and visual variables (size, form, value, orienta-tion, posiorienta-tion, color, and texture). The different types of visualiza-tions based on groups of imposition are also classified (diagrams, networks, maps, symbols) and types of imposition, divided into arrangement and construction (rectilinear, circular, orthogonal, or polar). Some examples based on this classification are (stacked) bar charts, pie charts, sunburst charts, node-link diagrams, scatter plots, or map representations.
Interaction.To reach their goals, analysts perform multiple tasks and interact with VA systems. Preim and Dachselt [2010] considers interaction style (e.g., direct manipulation, speech, ges-tures, menus) and interaction techniques, (e.g., selection, brushing, dynamic queries). Interaction further depends on devices (e.g., key-board, pointing, touch) and on intent [Haag et al. 2013]. Many taxonomies exist for interaction intent [Amar and Stasko 2004; Brehmer and Munzner 2013; Munzner 2014; von Landesberger et al. 2014]. The most well-known and established by Yi et al. [2007] defined select (mark as interesting), explore (show something else), reconfigure (show different arrangement), encode (show different representation), abstract/elaborate (show more/less detail), filter (show conditionally), and connect (show related items). Eye track-ing information can complement classic interaction operations. In our work, we focus on the inference of analysts’ goals, states, etc. and on how to support the analysis process thereby.
Model.The model specifies the data analysis method to be ap-plied to the data, and to support the analysis goals. Here, many different methods from statistics and machine learning can be con-sidered. Examples can include regression modeling, outlier and anomaly detection, similarity search, cluster analysis or classifica-tion, and frequent pattern mining [Han et al. 2011].
The analysis goal and data at hand influence the choice of the model. VA systems often aim to integrate data modeling with visu-alization via interaction [Endert et al. 2017]. For example, model tools can be applied to visualize the mining process, or serve as an interface for analysts to select and compare model parameters.
4
INTEGRATION OF EYE TRACKING INTO
desktop, mobile, virtual, augmented, and mixed reality).These ex-ample VA systems do not include an integration of eye tracking. However, we discuss for each how eye tracking could be integrated and how to infer analysts interests.We use the VA model described in Section 3 to identify promising extensions to these example VA systems by integrating novel eye tracking technologies. We also identify challenges of such an integration.The extensions and challenges presented are usually common to all of the VA systems discussed and could even be generalized to other applications. Un-less stated otherwise, we assume that desktop applications are used in an office setup with reliable eye tracking.
4.1
Tableau — Business Intelligence Analytics
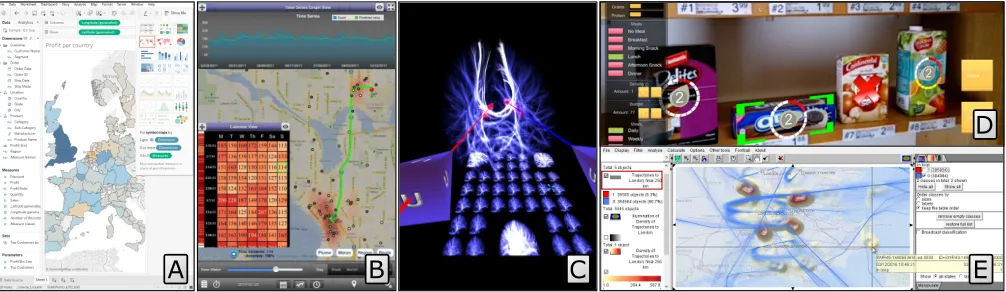
Tableau [2019] (cf. Figure 2 A) is a business intelligence and ana-lytics software intended for analysts from all types of sciences and different domains (e.g., energy, education, government, finances, manufacturing, health care, insurance, sports, law). It offers desktop as well as tablet, web, and embedded versions. It provides function-ality for analysts to get an overview of data, filter it, and inspect details. An exhaustive history is created, which is available even after Tableau is closed. To a lesser extent, Tableau includes the op-tion to relate and extract data. Zooming is only available for certain visualization techniques.
Analysts can load data from a file or connect to a server. Tableau supports many common data and charting types. An analyst can fil-ter, perform calculations, and integrate data from multiple sources. The visualization techniques that Tableau provides ranges from simple data tables to diagrams such as bar, pie, line, area charts, box plots, Gantt and bubble charts, maps, heat maps, tree maps, and scatter plots. To interact with Tableau, analysts can directly manip-ulate data points, use menus and dialogues. In Tableau desktop, one can use a classical keyboard and mouse pointing interaction. On a tablet gestures are used, as analysts interact via touch screen. The interaction techniques supported in Tableau include the selection of one or multiple data points and brushing to highlight the same data points in multiple views. Based on the taxonomy by Yi et al. [2007], Tableau supports different intents of an analyst (i.e., select, explore, reconfigure, encode, abstract/elaborate, and filter). Tableau offers functionality for automatic data analysis such as outlier detection, clustering, and regression analysis.
Benefits and challenges of an eye tracking integration.The
analysts’ expertise level when using Tableau varies, as in several other VA applications. Hence, detecting analyst expertise using eye tracking, and adapting the UI or application behavior can provide appropriate guidance. A novice might feel lost while using Tableau, therefore, detecting when a person is “lost” (e.g., based on num-ber of rapid saccades between AOIs) could trigger a help function dependant on which features analysts are working on. When an expert is detected, the help function could be triggered at a later stage than it would normally for a novice.
Tableau offers many visualization types that could be created by choosing different dimensions and measures as well as by specify-ing marks in a panel [Bertin 1967]. Integratspecify-ing eye trackspecify-ing into visualization creation could be supported, e.g., by suggesting which dimension, measure, mark, or visualization could be chosen based
on analysts’ focus. This would help an analyst explore the data exhaustively. Suggestions could also be given based on collabora-tive efforts. If multiple analysts are exploring the same dataset, the software could display suggestions based on previously collected eye movement data.
Exploring data in Tableau could be enhanced by automatically highlighting data elements when an analyst focuses on them for an amount of time. In addition, a combination of keyboard interactions and fixation duration could perform gaze-based filtering. Instead of dragging a dimension or measure with the mouse to the filter panel, an analyst could instead look at one of them, the system highlights it, and triggered by a keyboard shortcut it automatically opens the filter menu to select which elements should be excluded or included.
Supporting analysts during the data mining process in Tableau is similar to creating new visualizations. A separate pane next to the data pane offers functionality for automatic analysis (e.g., clustering). Based on where an analyst is looking at, suggestions and guidance could be given to help with the data mining.
4.2
Mobile VA for Law Enforcement
Razip et al. [2014] worked with a consortium of law enforcement agencies to develop and evaluate a VA system (cf. Figure 2 B) to aid patrol officers, detectives, and crime analysts. It was intended to be used on desktops inside offices, and in the field, on mobile devices. The system stores, collates, and displays geographically and temporally annotated crime reports. It consists of a map onto which crime incidents are plotted as color-coded points; an interactive time series view that plots incident counts over time; a calendar view showing incident counts for specific dates; and an interactive clock view to plot incident counts for concrete times of day. It also retrieves and overlays census information onto the map. All views are linked through brushing interactions in which a selection in one view is mirrored into others.
A study with officers indicated that the system is used differently across the multiple categories of analysts. Shift supervisors pointed out that they used the temporal reporting features in conjunction with the geo-spatial features to assist in resource allocation plan-ning. Patrol officers primarily used a mobile version in the field – geo-spatial and temporal filtering allowed an increased awareness of their area of patrol responsibility. Mobile analysts referred the need for voice controlled commands to perform common functions, as their hands were often busy with other tasks. Detectives used the system to solve crimes, for example, by investigating crime patterns. Crime analysts used it to generate insights into patterns and analyze trends in crime that they reported to their police departments.
Benefits and challenges of an eye tracking integration.
An-alysts using desktop computers are stationary in front of large screens and their eyes can be tracked accurately. In mobile contexts, analysts’ positioning in relation to the screen, lighting conditions, and screen sizes are variable, making accurate eye tracking more difficult. Task-support in each mode should account for different degrees of uncertainty in the eye movement data they rely on.
Eye Tracking Support for Visual Analytics Systems ETRA ’19, June 25–28, 2019, Denver, Colorado
A
B
C
E
[image:6.612.56.559.83.229.2]D
Figure 2: VA Systems: A) Tableau, B) Law enforcement analytics, C) FiberClay, D) Situated Analytics, E) V-Analytics.
seek patterns in the data, the system could offer analytic support in the form of recommendations. Examples are analysis recommen-dations, e.g., “You looked at correlations betweenX andY, you may be interested inZas it is correlated withX”, or collaborative recommendations, e.g., “This data may be of interest as it caught the attention of many other analysts”. Patrol officers use the mobile version of the system and explicitly requested a reduced reliance on manual interactions. Eye tracking could complement voice in-teraction by helping to disambiguate references made in natural language commands. For example, based on an analyst’s current gaze activity, the question “When are such crimes happening in this area?” could be specified as “When are burglaries happening around the intersection of streetXandY?”. Overall, eye tracking could be used to identify and support low-level visual tasks. The system could infer that analysts are searching for blue dots and vi-sually emphasize them. It could also detect that analysts are trying to connect visual information across multiple views and highlight it in all views.
As shown in Figure 2 C), the system integrates multiple views each with relatively distinct functions. One may automatically de-tect which views analysts are looking, and aim to dede-tect from this an-alysts tasks, interests, and favorite ways of visualizing data. Within each view, we could detect specific visual elements that analysts fixate on, the accuracy would depend on the element’s size, shape, and proximity to other elements. The system displays much of the information as point-like glyphs and these should be easier to track compared to more complex shapes such as lines [Okoe et al. 2014]. It is also important to note that the system is not interaction-heavy, analysts could extract insights by just looking at the linked visu-alizations without interacting with them. In a system such as this, eye tracking could tell us a lot about analysts’ interests and inten-tions whereas tracking manual interacinten-tions alone would not. This differs from some interactive systems that rely heavily on details on demand and navigation and in which manual interactions are a sufficiently reliable proxy for analyst interest.
4.3
FiberClay — Visual Analytics in VR
FiberClay (cf. Figure 2 C) works with head-mounted displays and hand-held controllers [Hurter et al. 2019]. It was designed for the visualization of trajectories. Users navigate the virtual 3D space
by orienting the camera with their head posture and then use con-trollers to move and scale the view. Alternatively, they have a 2D plane for adjusting continuous view and layout parameters. The plane is filled with tiles that show thumbnails to guide analysts in possible adjustments, including the switch to 2D projections of the trajectories, allowing them to follow an airplane’s history of flight levels.
Once analysts have chosen their view on the data, they can select large data ranges or specific trajectories using virtual rays that represent physical hand-held controllers. They press buttons and select or deselect all intersecting trajectories, essentially sculpting a query in 2D or 3D. The system gives an intuitive representation of spatial data as it matches the display dimensions. Trajectories of air planes and neural cell connections can be shown and analyzed. Simultaneously, time series of single parameters can be visualized in 2D, matching regular and well-known techniques from outside the virtual environment. The system runs smoothly on current hardware and it is well adapted for intuitive interaction through head and hand movement. It can be operated while sitting on a chair and does not require free body movement.
Benefits and challenges of an eye tracking integration.
[Marianos 2018]. Eyes have a narrow field of view at full resolution, and blurring occurs outside the fovea region on the retina. Render-ing specific parts of objects or scenes that analysts are able to fully grasp (by using interpupilary distance and the position of the eye relative to the lenses) might have several advantages. The same technique can be used to automatically adapt dynamically gener-ated content (i.e., procedural generation of virtual scenes according to the deployment of attention and physical differences of analysts) to improve the overall user experience (e.g., story-line in a game).
At the same time, gaze reflects personal interest and could give the system an indication of what data items are most interesting to analysts [Just and Carpenter 1980]. The 2D parameter navigation described in Section 4.3 could highlight the interesting data points and help analysts manually find more suitable representations. Al-ternatively, the system could automatically select glyphs with less overdraw in the region of interest, or suggest completely different views and visualizations that make the target data more readable. Notifications are a possible way of making such suggestions and are often placed on a specific location in regular desktop environments. In an immersive environment, however, there might not be a single suitable static placing option. Notifications might require explicit input to become visible and could be coupled with sound alerts.
People with refraction errors need to wear glasses that might not fit inside head-mounted displays. Additional optics could correct such defects and might be automatically adjusted to the person when combined with eye tracking. To achieve this, the underlying software could show test patterns with increasingly finer shapes and check real-time gaze data for their visibility.
4.4
Situated Analytics — Analytical Tools in AR
ElSayed et al. [2016] presented Situated Analytics (SA), real-time interaction techniques (cf. Figure 2 D). Based on two domains, it pro-vides analytic reasoning in the physical space: VA and Augmented Reality (AR).The authors consider the question of how SA can be beneficial for data exploration and information comprehension. It is stated that SA can enhance decision making in three ways. First, clear informa-tion presentainforma-tion by directly associating informainforma-tion with relevant physical objects. Second, more natural interaction for information exploration by touching and manipulating physical objects. Third, more sophisticated information analysis providing both contextual and overall information.
SA is a novel combination of real-time interaction and visual-ization techniques to allow the exploration and analysis of infor-mation about objects in a specific physical environment. Analysts can visually interact with information and objects in AR and access attached information. They can also view and compare information associated with multiple physical objects.
Benefits and challenges of an eye tracking integration.
Aug-mentation by eye tracking support in the case of the SA system could consider multiple aspects. In highly sensitive jobs, eye track-ing based systems might be used for continuous security and iden-tification checks. Multiple analysts could share the same AR device and adjustment to the profile to analysts’ preferences could be done automatically.
While using this VA system, analysts focus their attention on both virtual and physical objects. Eye tracking enables interaction with objects using fewer steps (e.g., users look at objects and give commands using voice, and a mapping between gaze and object de-tection provides contextual information). In collaboration scenarios, information on gaze direction, emotion and interests may be used to support social interaction between analysts. For example, one analyst may be given hints about other analysts’ gazes, which may enable an interest-based connection between them. It also may also open new possibilities for remote support and learning scenarios (e.g., changes in one analyst’s focus could be synchronized to the camera views on other remote systems).
Head-pointing could be replaced by eye-pointing. It might be a more accurate representation of how humans interact with the real world (i.e., hand-eye coordination could be implemented by correlating gaze-aim with action-finger-pointing). Visible traces for areas focused on by analysts could be added (e.g., each analyst leaves a color or pattern trace to be followed by others when ex-ploring a dataset). If analysts focus on a wrong direction or follow an inefficient analysis sequence, navigational hints are activated (e.g., arrows, contours, blurs, color shifts, voice/binaural sounds, or messages).
Knowing if analysts are focusing on an object or not, allows to update information only when desired to minimize distractions and resources usage. This technique could infer if objects in the scene are attended and respective importance, allowing the guidance of analysts to unattended or hidden objects. Information changes could be enabled in a dynamic way to achieve adaptation of the overall story in a more engaging way. Using information about previous interests together with analysts’ interactions, a new simulation and inference model could be created (e.g., using reinforcement learn-ing) to learn how analysts behave in different situations. The VA system could then decide when and which information to display.
Eye Tracking Support for Visual Analytics Systems ETRA ’19, June 25–28, 2019, Denver, Colorado
Benefits and challenges of an eye tracking integration.
In-tegrating eye tracking support into V-Analytics could encompass diverse items. V-Analytics allows the visualization of maps, trajec-tories, diagrams, graphs. Using eye movements the system could detect that an analyst missed an important item and provide auto-matic highlighting.Visual attention is an important aspect in eye tracking. Boris et al. [2017] presented a generalized process for vi-sual attention analysis with eye movement data and Frutos-Pascual et al. [2015] assessed visual attention using eye gaze data as a way to identify children’s behavior in attention-enhancement therapies.
Analysts’ visual attention could be used to include interaction im-provements by automatically adapting the placement of legends and content in maps according to analysts’ gaze [Göbel et al. 2018]. Using a remote eye tracker within the desktop environment would ensure sufficiently high accuracy of the eye movement data to de-tect the region where analysts are looking at and relate analysts’ attention with the task. When solving a problem together as a team, such collaborative work could be facilitated if one analyst could always know where the other analysts are currently looking at (e.g., to which part of the trajectory the other analyst is interested in or already handling).
Eye tracking would enable support during various analytic tasks, for example, the system could actively recommend important data correlations and visual items. The system could create a graph of attended items and keep an historic track that analysts could use for posterior analysis (i.e., data provenance), reconstruction of ex-ploration strategy, or to be simply utilized by other less experienced analysts. A model could be created to decide when to automatically support analysts or not, based on their gaze behaviour. The model would need to be able to decide the right balance between analysts’ control and automatic support as well as adaptation.
5
OPPORTUNITIES AND CHALLENGES
We identified research opportunities associated with the creation of gaze enabled VA systems. We did so by aggregating, extrapolating, and organizing opportunities and challenges discussed in Section 4, by drawing from our own research experiences, and from existing literature [Alam and Jianu 2017; Okoe et al. 2014; Shao et al. 2017; Silva et al. 2018, 2015, 2016a,b]. We then clustered the opportunities and challenges into five critical research themes that we think align with interests and expertise in the eye tracking and visualization communities. The themes also correspond to different stages or envisioned prerequisites in the development of eye tracking sup-ported VA systems: (i) reliable and accurate collection of raw eye movement data; (ii) translation of raw eye movements into data and visualization semantics; (iii) modelling of higher-level intents; (iv) provision of adaptive support; (v) and ensuring privacy. Our work suggests research opportunities and motivates the eye tracking and visualization communities to materialize eye tracking supportive VA systems.
5.1
Theme 1: Reliable Eye Tracking
At their core, eye tracking supportive VA systems rely on the im-provement of unobstructed, affordable, and reliable eye tracking technologies, across different VA system platforms, including desk-top computers, mobile devices such as tablets, phones, watches,
public or wall-sized displays, and embedded into virtual and im-mersive environments (cf. Section 4).
Eye tracking in desktop settings has become affordable and rel-atively accurate. This is due to large screens, stable lighting, and analysts limited movement. Conversely, emerging VA usage con-texts such as the ones exemplified in Section 4 are significantly more problematic. A range of problems needs to be solved before eye tracking can be used in practical VA settings. Among these, and arranged by usage context, are:
• Varying light conditions and viewing angles (e.g., mobile usage like inMobile VA for Law Enforcement, see Section 4.2)
• Energy efficiency and remote communication capabilities to increase eye tracking autonomy (e.g., mobile usage like in theMobile VA for Law Enforcement, or virtual environments like inFiberClay, see Section 4.3, andSituated Analytics AR, see Section 4.4)
• Accuracy for collaboration (e.g., wall-sized displays or dash-boards like inTableau, see Section 4.1, orV-Analytics, see Section 4.5, and in virtual environments like inFiberClay, see Section 4.3 andSituated Analytics, see Section 4.4)
• Head-mounted accuracy and multiple infrared interference (e.g., CAVE VR systems or exterior applications like in Fiber-Clay, see Section 4.3, andSituated Analytics, see Section 4.4)
• Automatic, unobtrusive calibration and re-calibration (all VA systems examples)
• Standardized SDKs for gaze metrics and reporting (all VA systems examples)
5.2
Theme 2: Mapping Eye Movement Data to
Visualizations
Mapping fixations onto rectangular, non-overlapping, and relatively large AOIs has received considerable attention in the eye tracking community. However, VA systems build on visualizations that com-pose complex drawing primitives. Such primitives include not just shapes that are approximated by rectangular/circular outlines but also overlap as interleaved curves and shapes of different sizes.
Thus, considering that a visual primitive is viewed only if a fix-ation lands within its bounds, may not suffice. It is likely that for VA systems, each fixation translates into a set of probabilities that one or more visual primitives have been viewed. Such probabil-ities depend on the complexity and density of primitives in the visualization and resolution of the eye tracker [Jianu and Alam 2018]. Moreover, people do not view visualizations in a random order, they follow patterns determined by the structure of the vi-sualization, analysts’ visual tasks, and their manual interactions. This information can help determine viewed elements with an in-creased accuracy [Alam and Jianu 2017]. A thorough understanding of how gaze information translates into viewing likelihoods, how to increase the accuracy of detection, and how to work around the uncertainties associated with it, is currently lacking. Also, in virtual environments, new heuristics to determine the actual gazed object (i.e., gaze-to-object mapping) need to be developed.
of visualizations and data is still partially unknown. Libraries and SDKs that can integrate such knowledge and allow visualization de-signers to easily translate eye movement data into probabilities that their elements have been viewed, as well as maintaining histories of this during run-time would further the proposed vision.
5.3
Theme 3: Modelling of Higher-level Intents
Accurate raw eye movement data and attention maps on visualiza-tion elements needs to be converted into models of expertise(e.g., Section 4.2), understanding, goals, and tasks. New systems should be aware of past, current, and future intentions. This should be possible if a model maps the intentions and needs of analysts in a continuous way, by creating an online support model based on multiple features (e.g., eye movement data, interaction, feedback, sensors, mental model, reverse engineering during the exploration of large datasets, etc.). The investigation of how and when to best guide, recommend, or adapt is an important research topic. A re-liable inference of the action-intent would enable the support of analysts, for example, help select data faster, interactively load more data into a view, reduce interaction by providing auto-navigation, or provide step-by-step instructions to accomplish a task.Machine learning techniques may help. These range from train-ing offline models with eye movement data to improve collaborative recommendations, to continuous tracking systems that use real-time eye movement data to feed an online model. The model can adjust its weights according to the variations in the analysts’ visual interests. These models can combine multiple features that are di-rectly or indidi-rectly linked to the gaze of a person (i.e., combination of gaze duration on AOIs, a history of interesting data features through time, multiple sensors, plus several actions or decisions that analysts make using a keyboard, control pad, or voice). In Sec-tions 2 and 4 we refer and discuss multiple examples of potential solutions. This combination of features increases the capability of detecting the context(e.g., Section 4.4). It might be vital for the next stage during which we want to support the analysts.
5.4
Theme 4: Adaptive Support
Research on the themes described above would create the premise for generating a variety of support mechanisms.Interaction Support could help analysts perform low level interactions (e.g., navigating to some data of interest) and data-reading tasks (e.g., determining if two nodes are connected in a node-link diagram [Okoe et al. 2014]).Recommendationsabout unexplored but potentially useful data could be made to analysts based on historical or online models of their interests.Guidance(e.g., Section 4.1)would consist of higher level support in which systems help users trough novel method-ologies and techniques that fit the problems to be solved.Dynamic Adaptationwould allow systems to detect and match analysts’ cog-nitive and analytic particularities(e.g., Section 4.3), their workflows, preferences, interests and needs.
It is not obvious how to best communicate such support to ana-lysts in a way that is helpful yet not disruptive.In-situ highlight-ing and overlays(e.g., Section 4.5)could be used to show support directly in visualizations (e.g., marking suggested items). Recom-mendation panelscould show support in separate panels, perhaps along with more detailed suggestions that analysts could consult on
demand. Perhapsother modalitiessuch as speech or haptics could add dimensions to communication between analysts and systems.
5.5
Theme 5: Ensuring Privacy
Ensuring analysts’ privacy is paramount in allowing eye tracking based VA systems to be adopted. Investment from big players like Google, Facebook, Microsoft or Twitter will increase the awareness for protection of analysts. A careful debate around the potentials and misuses of the technology and specific guidelines for user identification(e.g., Section 4.4)and privacy protection are needed. Eye tracking adds elusive capabilities to marketing profiling. Sensitive information can be captured by measuring gaze duration or pupil dilation [Blog 2017] and, while clicking can be avoided, willfully not looking at content is difficult. Eye tracking technology is already available in MR as well as VR systems and could soon be widely used in TVs, smartphones, or cars. Commercials can be embedded into free VR games for profiling [Law 2017]. Eye track-ing can be integrated into surveillance systems to anticipate next actions and thus invade peoples’ privacy [Liebling and Preibusch 2014; Stanley 2013].Additionally, eye tracking can reveal disor-ders with high accuracy (up to 87%) [Lagun et al. 2011; Terao et al. 2017; Ting et al. 2014], for example,cognitive disorders (e.g., autism, attention deficit disorder, dyslexia); psychological disorders (e.g., Schizophrenia, Parkinson, Alzheimer’s, post-traumas, eating dis-orders); HIV (AIDS Dementia Complex); and behavioral disorders (e.g., lies, drug and alcohol use, fatigue and distraction).
Eye-tracking provides a potentially dangerous channel into peo-ples’ identity and into how they think, analyze, process, or interact with information. The long awaited arrival of affordable eye track-ing systems could also brtrack-ing a new generation of privacy invasion. Remedies and avenues to ensure the privacy of analysts using eye tracking supportive VA systems need to be researched. New eye tracking APIs could provide notice about the data being collected and analysts could be able to control which data is shared. Pol-icy changes to provide minimum privacy guarantees can be made. Liebling et al. [2014] point to both privacy challenges and eye tracking potentials for research, engineering, policy makers and businesses.
6
CONCLUSION
In this paper we discussed the vision and lay the foundation for research on eye tracking supported VA systems. We first introduced a general VA model, then we described and exemplified the range of possible VA systems. Based on these example VA systems, we identified promising extensions through integration of eye track-ing technology, and discussed potential research challenges that future research needs to tackle before the benefits of eye tracking supportive VA systems can materialize. Finally, we aggregated, ex-trapolated, and organized these challenges of such an eye tracking integration, extracted five research themes, and mapped the road for researchers to broaden the use of eye tracking and advance visual analytics.
REFERENCES
Sayeed Safayet Alam and Radu Jianu. 2017. Analyzing Eye-tracking Information in Visualization and Data Space: From Where On The Screen To What On The Screen.
Eye Tracking Support for Visual Analytics Systems ETRA ’19, June 25–28, 2019, Denver, Colorado
Robert Amar and John Stasko. 2004. A Knowledge Task-Based Framework for Design and Evaluation of Information Visualizations. InIEEE Symposium on Information Visualization. IEEE Computer Society Press, 143–150.
Gennady Andrienko, Natalia Andrienko, Peter Bak, Daniel Keim, and Stefan Wrobel. 2013.Visual Analytics of Movement. Springer.
Gennady Andrienko, Natalia Andrienko, Guido Budziak, Jason Dykes, Georg Fuchs, Tatiana von Landesberger, and Hendrik Weber. 2017. Visual Analysis of Pressure in Football.Data Mining and Knowledge Discovery31, 6 (2017), 1793–1839. Gennady Andrienko, Natalia Andrienko, Michael Burch, and Daniel Weiskopf. 2012.
Visual Analytics Methodology for Eye Movement Studies.IEEE Transactions on Visualization and Computer Graphics18, 12 (2012), 2889–2898.
Gennady Andrienko, Natalia Andrienko, Georg Fuchs, and Jose Manuel Cordero Garcia. 2018. Clustering Trajectories by Relevant Parts for Air Traffic Analysis.
IEEE Transactions on Visualization and Computer Graphics24, 1 (2018), 34–44. Natalia Andrienko and Gennady Andrienko. 2019. V-analytics. http://geoanalytics.
net/V-Analytics/. [Online; accessed 08-Jan-2019].
Natalia Andrienko, Gennady Andrienko, Jose Manuel Cordero Garcia, and David Scar-latti. 2019. Analysis of Flight Variability: A Systematic Approach.IEEE Transactions on Visualization and Computer Graphics25, 1 (2019), 54–64.
Roman Bednarik. 2005. Potentials of Eye-movement Tracking in Adaptive Systems. In
Proceedings of the 4th Workshop on Empirical Evaluation of Adaptive Systems. 1–8. Jacques Bertin. 1967.Sémiologie Graphique(1st ed.). Paris, Mouton/Gauthier-Villars. Tanja Blascheck, Markus John, Kuno Kurzhals, Steffen Koch, and Thomas Ertl. 2016.
VA2: A Visual Analytics Approach for Evaluating Visual Analytics Applications.
IEEE Transactions on Visualization and Computer Graphics22, 1 (2016), 61–70. Tanja Blascheck, Kuno Kurzhals, Michael Raschke, Michael Burch, Daniel Weiskopf,
and Thomas Ertl. 2017. Visualization of Eye Tracking Data: A Taxonomy and Survey.Computer Graphics Forum36, 8 (2017), 260–284.
Jonas Blattgerste, Patrick Renner, and Thies Pfeiffer. 2018. Advantages of eye-gaze over head-gaze-based selection in virtual and augmented reality under varying field of views. InProceedings of the Workshop on Communication by Gaze Interaction, COGAIN@ETRA 2018, Warsaw, Poland, June 15, 2018. 1:1–1:9. https://doi.org/10. 1145/3206343.3206349
SensorBis Blog. 2017. Eye tracking technology – User Pro-filing and Privacy Concerns. http://blog.sensorbis.com/ eye-tracking-technology-user-profiling-and-privacy-concerns/
Magdalena Borys and Małgorzata Plechawska-Wójcik. 2017. Eye-tracking metrics in perception and visual attention research. (2017), 13.
Matthew Brehmer and Tamara Munzner. 2013. A Multi-Level Typology of Abstract Visualization Tasks.IEEE TVCG19, 12 (2013), 2376–2385.
Sylvain Castagnos, Nicolas Jones, and Pearl Pu. 2010. Eye-tracking Product Recom-menders’ Usage. InProceedings of the ACM Conference on Recommender systems. ACM, 29–36.
Sylvain Castagnos and Pearl Pu. 2010. Consumer Decision Patterns Through Eye Gaze Analysis. InProceedings of the Workshop on Eye Gaze in Intelligent Human Machine Interaction. ACM, 78–85.
Davide Ceneda, Theresia Gschwandtner, Thorsten May, Silvia Miksch, Hans-Jörg Schulz, Marc Streit, and Christian Tominski. 2017. Characterizing Guidance in Visual Analytics.IEEE TVCG23, 1 (2017), 111–120.
Li Chen and Pearl Pu. 2011. Users’ Eye Gaze Pattern in Organization-based Recom-mender Interfaces. InProceedings of the 16th international conference on intelligent user interfaces. ACM, 311–314.
Christopher Collins, Natalia Andrienko, Tobias Schreck, Jing Yang, Jaegul Choo, Ulrich Engelke, Amit Jena, and Tim Dwyer. 2018. Guidance in the Human–machine Analytics Process.Visual Informatics2, 3 (2018), 166–180.
Neven A. ElSayed, Bruce H. Thomas, Kim Marriott, Julia Piantadosi, and Ross T. Smith. 2016. Situated Analytics: Demonstrating immersive Analytical Tools With Augmented Reality.Journal of Visual Languages & Computing36 (2016), 13–23. A. Endert, W. Ribarsky, Cagatay Turkay, B. L. William Wong, Ian T. Nabney,
Igna-cio Díaz Blanco, and Fabrice Rossi. 2017. The State of the Art in Integrating Ma-chine Learning into Visual Analytics.Comput. Graph. Forum36, 8 (2017), 458–486. https://doi.org/10.1111/cgf.13092
Paolo Federico, Markus Wagner, Alexander Rind, Albert Amor-Amorós, Silvia Miksch, and Wolfgang Aigner. 2017. The Role of Explicit Knowledge: A Conceptual Model of Knowledge-Assisted Visual Analytics. InProc. IEEE Conference on Visual Analytics Science and Technology (VAST).
Alexander Felfernig, Michael Jeran, Gerald Ninaus, Florian Reinfrank, and Stefan Reit-erer. 2013. Toward the Next Generation of Recommender Systems: Applications and Research Challenges. InMultimedia services in intelligent environments. Springer, 81–98.
Maite Frutos-Pascual and Begonya Garcia-Zapirain. 2015. Assessing Visual Attention Using Eye Tracking Sensors in Intelligent Cognitive Therapies Based on Serious Games.Sensors (Basel, Switzerland)15, 5 (May 2015), 11092–11117. https://doi.org/ 10.3390/s150511092
Fabian Göbel, Peter Kiefer, Ioannis Giannopoulos, Andrew Duchowski, and Martin Raubal. 2018. Improving Map Reading With Gaze-adaptive Legends. InProceedings of the ACM Symposium on Eye Tracking Research & Applications. ACM, 29:1–29:9.
Florian Haag, Tanja Blascheck, Bernhard Schmitz, and Michael Raschke. 2013. Berührpunkte Mit der Visualisierung. InMulti-Touch – Interaktion Durch Beruhrung, Thomas Schlegel (Ed.). Springer, 339–367.
Jiawei Han, Micheline Kamber, and Jian Pei. 2011.Data Mining: Concepts and Techniques
(3rd ed.). Morgan Kaufmann Publishers Inc., San Francisco, CA, USA.
Christophe Hurter, Nathalie Henry Riche, Steven M. Drucker, Maxime Cordeil, Richard Alligier, and Romain Vuillemot. 2019. FiberClay: Sculpting Three Dimensional Trajectories to Reveal Structural Insights.IEEE TVCG25, 1 (2019), 704–714. https: //doi.org/10.1109/TVCG.2018.2865191
Radu Jianu and Sayeed Safayet Alam. 2018. A Data Model and Task Space for Data of Interest (DOI) Eye-Tracking Analyses.IEEE transactions on visualization and computer graphics24, 3 (2018), 1232–1245.
Jehan Jung, Yuka Matsuba, Rammohan Mallipeddi, Hiroyuki Funaya, Kazushi Ikeda, and Minho Lee. 2013. Evolutionary Programming Based Recommendation Sys-tem for Online Shopping. InSignal and Information Processing Association Annual Summit and Conference (APSIPA), 2013 Asia-Pacific. IEEE, 1–4.
Marcel Just and Patricia Carpenter. 1980. A Theory of Reading: From Eye Fixations to Comprehension.Psychological Review87, 4 (1980), 329–354.
Daniel Keim, Florian Mansmann, Jörn Schneidewind, Jim Thomas, and Hartmut Ziegler. 2008. Visual Analytics: Scope and Challenges. InVisual Data Mining, Simeon Simoff, Michael Böhlen, and Arturas Mazeika (Eds.). Springer, 76–90.
Daniel A. Keim, Jörn Kohlhammer, Geoffrey Ellis, and Florian Mansmann. 2010. Mas-tering The Information Age - Solving Problems with Visual Analytics. Eurographics. Peter Kiefer, Ioannis Giannopoulos, and Martin Raubal. 2013. Using Eye Movements
to Recognize Activities on Cartographic Maps. InProceedings of the 21st ACM SIGSPATIAL 2013. ACM, 488–491.
Kuno Kurzhals, Brian Fisher, Michael Burch, and Daniel Weiskopf. 2014. Evaluating Visual Analytics with Eye Tracking. InProceedings of the BELIV Workshop: Beyond Time and Errors – Novel Evaluation Methods for Visualization. ACM, 61–69. Dmitry Lagun, Cecelia Manzanares, Stuart M. Zola, Elizabeth A. Buffalo, and Eugene
Agichtein. 2011. Detecting cognitive impairment by eye movement analysis using automatic classification algorithms.J Neurosci Methods201, 1 (30 Sep 2011), 196–203. https://doi.org/10.1016/j.jneumeth.2011.06.027 21801750[pmid].
Bloomberg Law. 2017. Privacy Issues in Virtual Reality: Eye Tracking Technology. https://www.alston.com/en/insights/publications/2017/07/ privacy-issues-in-virtual-reality
Daniel Liebling and Sören Preibusch. 2014. Privacy Considerations For A Pervasive Eye Tracking World. InProceedings of the ACM International Joint Conference on Pervasive and Ubiquitous Computing. ACM, 1169–1177.
N. Marianos. 2018.Foveated Rendering Algorithms using Eye-Tracking Technology in Virtual Reality. Bachelor.
Tamara Munzner. 2014.Visualization Analysis and Design(1st ed.). CRC Press Taylor and Fracis Group.
Mershack Okoe, Sayeed Safayet Alam, and Radu Jianu. 2014. A Gaze-enabled Graph Visualization to Improve Graph Reading Tasks.Computer Graphics Forum33 (2014). https://doi.org/10.1111/cgf.12381
David O’sullivan and David Unwin. 2014.Geographic Information Analysis. John Wiley & Sons, Ltd.
William Pike, John Stasko, Remco Chang, and Theresa O’Connell. 2009. The Science of Interaction.Information Visualization8, 4 (2009), 263–274.
Bernhard Preim and Raimund Dachselt. 2010.Interaktive Systeme: Band 1: Grundlagen, Graphical User Interfaces, Informationsvisualisierung(2nd ed.). Springer. Ahmad M. Razip, Abish Malik, Shehzad Afzal, Matthew Potrawski, Ross Maciejewski,
Yun Jang, Niklas Elmqvist, and David S. Ebert. 2014. A Mobile Visual Analytics Approach For Law Enforcement Situation Awareness. InProceedings of the IEEE Pacific Visualization Symposium. IEEE Computer Society Press, 169–176. Patrick Renner and Thies Pfeiffer. 2017. Attention guiding techniques using peripheral
vision and eye tracking for feedback in augmented-reality-based assistance systems. In2017 IEEE Symposium on 3D User Interfaces, 3DUI 2017, Los Angeles, CA, USA, March 18-19, 2017. 186–194. https://doi.org/10.1109/3DUI.2017.7893338 Dominik Sacha, Andreas Stoffel, Florian Stoffel, Bum Chul Kwon, Geoffrey Ellis, and
Daniel Keim. 2014. Knowledge Generation Model for Visual Analytics. IEEE Transactions on Visualization and Computer Graphics20, 12 (2014), 1604–1613. Lin Shao, Nelson Silva, Eva Eggeling, and Tobias Schreck. 2017. Visual Exploration of
Large Scatter Plot Matrices by Pattern Recommendation Based on Eye Tracking. In
Proceedings of the 2017 ACM Workshop on Exploratory Search and Interactive Data Analytics. ACM, 9–16.
Ben Shneiderman. 1996. The Eyes Have It: A Task by Data Type Taxonomy for Infor-mation Visualizations. InProceedings of the IEEE Symposium on Visual Languages. IEEE Computer Society Press, 336–343.
Nelson Silva, Tobias Schreck, Eduardo Veas, Vedran Sabol, Eva Eggeling, and Dieter W Fellner. 2018. Leveraging Eye-gaze and Time-series Features to Predict User Inter-ests And Build A Recommendation Model For Visual Analysis. InProceedings of the 2018 ACM Symposium on Eye Tracking Research & Applications. ACM, 13. Nelson Silva, Volker Settgast, Eva Eggeling, Torsten Ullrich, Tobias Schreck, and Dieter
Nelson Silva, Lin Shao, Tobias Schreck, Eva Eggeling, and Dieter W Fellner. 2016a. Sense.me - Open Source Framework for the Exploration and Visualization of Eye Tracking Data. InIEEE Conference on Information Visualization, Poster Paper. Nelson Silva, Lin Shao, Tobias Schreck, Eva Eggeling, and Dieter W Fellner. 2016b.
Visual Exploration of Hierarchical Data Using Degree-of-Interest Controlled by Eye-Tracking.Proceedings of the 9th Forum Media Technology(2016).
Heyjin Song and Nammee Moon. 2017. A Preference Based Recommendation Sys-tem Design Through Eye-Tracking and Social Behavior Analysis. InAdvances in Computer Science and Ubiquitous Computing. Springer, 1014–1019.
Jay Stanley. 2013. The Privacy-Invading Potential of Eye Tracking Technol-ogy. https://www.aclu.org/blog/national-security/privacy-and-surveillance/ privacy-invading-potential-eye-tracking-technology
Ben Steichen, Giuseppe Carenini, and Cristina Conati. 2013. User-adaptive Information Visualization: Using Eye Gaze Data to Infer Visualization Tasks and User Cognitive Abilities. InProceedings of the International Conference on IUIs. ACM, 317–328. Tableau. 2019. Tableau Software. https://www.tableau.com/. [Online; accessed
08-Jan-2019].
Yasuo Terao, Hideki Fukuda, and Okihide Hikosaka. 2017. What do eye movements tell us about patients with neurological disorders?: - An introduction to saccade recording in the clinical setting.Proc Jpn Acad Ser B Phys Biol Sci93, 10 (11 Dec 2017), 772–801. https://doi.org/10.2183/pjab.93.049 29225306[pmid].
James J. Thomas and Kristin A. Cook. 2005.Illuminating the Path: The Research and Development Agenda for Visual Analytics. IEEE Computer Society.
Windsor Kwan-Chun Ting, Jose Luis Perez Velazquez, and Michael D. Cusimano. 2014. Eye movement measurement in diagnostic assessment of disorders of consciousness.
Front Neurol5 (29 Jul 2014), 137–137. https://doi.org/10.3389/fneur.2014.00137 25120529[pmid].
Tatiana von Landesberger, Sebastian Fiebig, Sebastian Bremm, Arjan Kuijper, and Dieter Fellner. 2014. Interaction Taxonomy for Tracking of User Actions in Visual Analytics Applications. InHandbook of Human Centric Visualization, Weidong Huang (Ed.). Springer, 653–670.
Songhua Xu, Hao Jiang, and Francis Lau. 2008. Personalized Online Document, Image and Video Recommendation Via Commodity Eye-tracking. InProceedings of the 2008 ACM conference on Recommender systems. ACM, 83–90.
Ji Soo Yi, Younah Kang, John Stasko, and Julie Jacko. 2007. Toward a Deeper Under-standing of the Role of Interaction in Information Visualization.IEEE Transactions on Visualization and Computer Graphics13, 6 (2007), 1224–1231.