City, University of London Institutional Repository
Citation:
Ipser, A., Karlinski, M. and Freeman, E. D. (2018). Correlation of individual differences in audiovisual asynchrony across stimuli and tasks: new constraints on Temporal Renormalization theory. Journal of Experimental Psychology: Human Perception andPerformance, 44(8), pp. 1283-1293. doi: 10.1037/xhp0000535
This is the accepted version of the paper.
This version of the publication may differ from the final published
version.
Permanent repository link:
http://openaccess.city.ac.uk/18809/Link to published version:
http://dx.doi.org/10.1037/xhp0000535Copyright and reuse: City Research Online aims to make research
outputs of City, University of London available to a wider audience.
Copyright and Moral Rights remain with the author(s) and/or copyright
holders. URLs from City Research Online may be freely distributed and
linked to.
City Research Online: http://openaccess.city.ac.uk/ [email protected]
1
Correlation of individual differences in audiovisual
asynchrony across stimuli and tasks: new
constraints on Temporal Renormalization theory.
Alberta Ipser
1,2Maayan Karlinski
1Elliot D Freeman
11. City, University of London, UK
2. University of Sussex, UK
Corresponding author:
Dr Elliot Freeman City University
Northampton Square London EC1V 0HB
Telephone: +44 (0)20 7040 0102 Fax: +44 (0)20 7040 8580
email: [email protected]
2 Abstract
Sight and sound are out of synch in different people by different amounts for different tasks.
But surprisingly, different concurrent measures of perceptual asynchrony correlate negatively
(Freeman, Ipser et al, 2013. Cortex 49, 2875–2887): thus if vision subjectively leads audition
in one individual, the same individual might show a visual lag in other measures of
audiovisual integration (e.g. McGurk illusion, Stream-Bounce illusion).
This curious negative correlation was first observed between explicit temporal order
judgements and implicit phoneme identification tasks, performed concurrently as a dual task,
using incongruent McGurk stimuli. Here we used a new set of different of explicit and
implicit tasks and congruent stimuli, to test whether this negative correlation persists across
testing sessions, and whether it might be an artefact of using specific incongruent stimuli.
None of these manipulations eliminated the negative correlation between explicit and implicit
measures. This supports the generalisability and validity of the phenomenon, and offers new
theoretical insights into its explanation.
Our previously proposed ‘temporal renormalization’ theory assumes that the timings of
sensory events registered within the brain’s different multimodal sub-networks are each
perceived relative to a representation of the typical average timing of such events across the
wider network. Our new data suggest that this representation is stable and generic, rather than
dependent on specific stimuli or task contexts, and that it may be acquired through experience
with a variety of simultaneous stimuli. Our results also add further evidence that speech
comprehension may be improved in some individuals by artificially delaying voices relative
to lip-movements.
Keywords
3 Public Significance Statement
Sight and sound are out of synch, by different amounts for different people and for different
tasks. Yet curiously, we have found that the more an individual’s vision lags their audition in
the performance of one task (e.g. identifying speech sounds), the more their audition lags
vision in other tasks (e.g. deciding whether lips followed or preceded the speaker’s voice).
Here we test the generality of this antagonistic phenomenon using a variety of previously
untested implicit versus explicit subjective tasks involving audiovisual speech stimuli. Our
results support a new theory of perceptual timing that can explain our results, while
eliminating some competing accounts. Furthermore, our study suggests that speech
comprehension can be improved in some individuals by artificially delaying voices relative to
lip-movements, and provides automated tasks that might be used for on-line assessment of
4 Introduction
When we see and hear a person speak, sensory signals travel independently from our eyes and ears through the brain, and converge within different multimodal areas of the brain that are sensitive to both auditory and visual information (Ghazanfar & Schroeder, 2006). These signals travel at different speeds via different routes from primary sensory areas, so
information from each modality is likely to arrive at different multimodal areas at slightly different times (Efron, 1963; Halliday & Mingay, 1964; Keetels & Vroomen, 2012; Pöpple, 1988). Despite such temporal spreading of information in the brain, our ability to judge whether the original events were synchronous or not tends to be fairly veridical, at least on average across individuals (King, 2005). So how do we know when the original events occurred in relation to one another? This problem is a deep one, ultimately concerning the relationship between physical, neural and subjective timing (Dennett & Kinsbourne, 1995; Scharnowski, Rees, & Walsh, 2013; Zeki & Bartels, 1998). Researchers have often assumed that there are unifying mechanisms functioning to keep the brain’s internal signals in synch, or to compensate for their asynchronies (Keetels & Vroomen, 2012). Recent studies,
however, have begun to challenge this view with evidence that sight and sound are
persistently out of synch in different people by different amounts, and even for different tasks (Ipser et al., 2017). More surprisingly, we previously found that some measures
of audiovisual asynchrony can be anti-correlated (Freeman et al., 2013). For example, the more vision apparently leads audition for one given task in one individual, the more the same individual might show an opposite visual lag in other tasks. This phenomenon hints at a fundamental disunity of perceptual timing. However, this counterintuitive pattern has only been reported once to date. The aim of the present research was to test the replicability and generality of this phenomenon across a variety of tasks and stimuli, and to seek
empirical constraints on a theoretical explanation for it.
The first hints that vision and hearing might not always be fully in synch for some
5
perceptual timing that are positively correlated. However some measures of perceptual asynchrony based on different explicit tasks such as simultaneity judgements and temporal order judgements do not show this predicted pattern (Fujisaki, Shimojo, Kashino, & Nishida, 2004; Love et al., 2013; Maier, Di Luca, & Noppeney, 2011; Petrini, Holt, & Pollick, 2010; Van Eijk, Kohlrausch, Juola, & Van De Par, 2008; Vatakis, Navarra, Soto-Faraco, & Spence, 2008; Vroomen & Stekelenburg, 2011). This inconsistency has been attributed to the effects of uncontrolled variability of decision criteria on explicit timing judgements (Schneider & Bavelier, 2003; Van Eijk et al., 2008; Yarrow, Jahn, Durant, & Arnold, 2011). However, some of our own data using implicit tasks also shows that different measures do not always correlate positively, even while each shows trait-like test-retest replicability (Ipser et al., 2017). Our conclusion was that such independent variability measured by implicit tasks is unlikely to be fully explained away by decision biases, but that it might still be reasonably explained by the assumption that sensory signals acquire independent temporal noise as they traverse different neural networks dedicated to different tasks. However this does not fully explain our previous evidence of negative correlations between different explicit versus implicit measures (Freeman et al., 2013).
In Freeman et al. (2013), we presented videos of a person speaking single syllables, while participants performed two concurrent tasks. One implicit task measured the
audiovisual asynchrony that was optimal for maximising the McGurk illusion (McGurk & MacDonald, 1976), where mismatching phonemes and lip movements can alter the phoneme that is heard. In the second task participants performed an explicit temporal order judgements (TOJ), indicating whether they heard the voice onset before or after the lip-movements. From this we measured the Point of Subjective Simultaneity (PSS) which represents the asynchrony at which 'voice-first' and 'voice-second' judgements were equally split. Curiously, we found that the more a participant required an auditory lag to maximise the McGurk illusion, the more the same participant required a visual lag to achieve subjective simultaneity.
6
Yamamoto, Uchida, & Kitazawa, 2006; Sternberg & Knoll, 1973; Yamamoto, Miyazaki, Iwano, & Kitazawa, 2012). Such theories would predict that measures of perceptual timing should correlate positively across different tasks, if at all, but never negatively. A negative correlation seems to point to a different kind of higher-order mechanism governing
perceptual timing, which seem to preserve or even antagonise, rather than unify,
discrepancies between individual measures. To explain the pattern, we have proposed a renormalization process by which the timings of sensory events registered in different multimodal brain mechanisms are each perceived relative to the average of a distribution of such timings across the ensemble (Freeman et al., 2013). The more one multimodal
mechanism is subject to an auditory lag in a given individual, the more this will attract the average of this ‘reference’ distribution, relative to which other mechanisms may seem to have more of an opposite bias towards visual lags. The negative correlation then emerges given individual differences in the temporal discrepancies between mechanisms.
Before committing to this particular theoretical explanation, however, it is important to establish how replicable and generalizable this phenomenon is. Our previous study only used incongruent stimuli and a dual task, in which one implicit measure of audiovisual integration was tested concurrently with a explicit measure of perceived temporal order. This raises justifiable concerns that the pattern observed before is specific to those stimuli or tasks. The present study goes beyond our previous studies by using stimuli and task contexts never tested before in combination, to test several hypotheses that could explain away the negative
correlation, and hypotheses concerning the nature of the proposed reference distribution
construct, as follows.
7
uncertain whether the negative correlation is specific to task-contexts involving TOJ. This might have introduced competing processing demands. For example, the McGurk illusion is necessarily elicited when lip movements are integrated with potentially incongruent
phonemes, while TOJ might require more selective unimodal processing of lip movements versus phonemes in order to compare their relative timing. We therefore used a new task in which participants rated the comprehensibility of sentences composed of congruent
phonemes and lip movements, taken from the standardized IEEE collection of short ‘Harvard Sentences’. Like TOJ, this comprehensibility rating task still relies on explicit judgements, but it might more integrative rather than selective processing. We found the asynchrony for optimal comprehensibility of sentences, and correlated this against an implicit measure of optimal asynchrony based on a comprehension accuracy task, which also requires the integration of congruent auditory and visual streams, but for different stimuli composed of triplets of spoken numerals. This also provides a new test of whether the proposed reference distribution contains generic information about sensory timing rather than information unique to specific stimuli. If stimulus-specific, there should be no negative correlation between measures based on different stimuli. Altogether, the present study tested the following new stimulus/task combinations: Phoneme identification of syllables for the McGurk task and TOJ under single versus dual task conditions, and comprehension accuracy of Number Triplets versus comprehensibility rating of Harvard Sentences.
8 Methods
Participants
Participants were recruited from the undergraduate population and from the local community,
and received either course credits or payment as compensation. In the first experiment with
McGurk and TOJ tasks, there were 40 participants, 14 male, average age 24.4 years, SD 4.58.
In the second experiment with number triplets and Harvard sentences there was a separate
group of 34 participants (14 male, average age 30 years, SD 13). These sample sizes were
sufficient to measure Pearson’s r correlations of -.5 (approximating values found in Freeman
et al, 2013), with power of 0.8. We required that participants had normal, or
corrected-to-normal eyesight, and corrected-to-normal hearing. For the speech comprehension tasks, we also required
English language fluency. Procedures were approved by the local ethics committee at City,
University of London.
Materials and Apparatus
Visual stimuli were presented on a Sony Trinitron HMD-A420 cathode ray tube monitor.
Video mode was 1280 x 1024 pixels, with 85Hz refresh rate. Auditory stimuli were presented
via two PC loudspeakers positioned on either side of the monitor. Experimental software was
programmed using Psychtoolbox 3 (Brainard, 1997) for Matlab, running on a Mac Mini.
Manual responses were made via a standard PC keyboard. Viewing distance was
approximately 58cm, with head position constrained using a chin rest. Stimuli consisted of
audiovisual movies depicting the lower half of a face speaking syllables, words or sentences.
Sample images and dimensions are shown on Figure 1. An oscilloscope confirmed that
audiovisual timing of simultaneous beep and flash signals presented through the same
software and hardware had minimal bias.
Stimuli differed in their length and complexity, including from simple monosyllabic McGurk
stimuli, triplets of bisyllabic numbers (Number Triplets task), and full sentences (Sentence
Rating task). For an illustration of typical visual stimuli see Figure 1(a).
For the McGurk task, our choice of stimuli closely followed past studies which measured the
McGurk illusion as a function of audiovisual asynchrony (Freeman et al., 2013; Munhall,
Gribble, Sacco, & Ward, 1996; Soto-Faraco & Alsius, 2007). To rule out the possibility that
9
a new set of stimuli, in which a different female speaker uttered phonemes /ba/ and /da/,
which were paired with incongruent lip movements [ga] and [ba] respectively. To equalise
response contingencies we also included congruent lip movements, but as these typically
produce flat asynchrony functions they were not included in the final analysis. From pilot
sessions, we had established that /ba/+[ga] could readily evoke the percept “da”, as the
dominant McGurk fusion illusion, while for the /da/+[ba] pairing, the combination “bda” or
"ba" percepts were most dominant, as reported in the above studies. For further consistency
with those studies, white noise at 65dB sound pressure level was added to the voice stimulus,
with a signal-to-noise ratio of 14dB, which might serve to enhance audiovisual interactions
(Sumby & Pollack, 1954). A small white dot (0.2 deg) could appear with 50% probability on
the speaker's tongue for 24ms when it was visible, which was used in the context of a
secondary task to ensure subjects attended to the visual stimulus.
In the Number Triplets task, stimuli were composed of triplets of monosyllabic numbers
(zero, pronounced ‘oh’, through nine excluding seven), spoken by a female as a continuous
sequence. This restricted stimulus set was used for the convenience of inputting responses
and coding errors (Smits et al., 2004), and also to minimise learning effects that might be
found with less familiar stimuli (Vlaming, MacKinnon, Jansen, & Moore, 2014). The audio
stream was embedded in background noise composed of Fourier phase-scrambled original
speech (65dB sound pressure level), which contained the same frequencies and temporal
structure within each frequency band, but which was not recognisable as speech. The
signal-to-noise ratio (SNR) was set for each individual in a prior staircase sequence (see Procedure).
In the main task, average signal-to-noise ratio was -17dB (SD1.5).
The sentence comprehension task used the standard Harvard Sentences (sets 1 to 26)
developed for telecommunications research (IEEE, 1969), which balance the frequency of
occurrence of all common speech sounds. The speaker was male.
Design
One group of 40 participants completed the McGurk task (McGurk/TOJ Dual), concurrently
with TOJ, and also with each in separate runs of trials (McGurk/TOJ Single). The design
distinguished between congruent and incongruent audiovisual pairings. A second group of 34
participants performed the Number Triplets and Harvard Sentences Comprehension tasks. In
10
equally spaced levels from 500ms auditory lead to 500ms auditory lag, including
simultaneous (0ms, ±125ms, ±250ms, ±375ms, ±500ms).
Procedure
Order of tasks was counterbalanced. All conditions were run in one session, in
counterbalanced order. Each task began with at least 15 practice trials. No performance feedback was given in either task. In the McGurk task, each trial commenced with a fixation display. Following a key press and a blank interval (duration randomly selected from the range 1000ms ± 500ms), a movie was displayed for 3000ms. Each presentation began with a variable period during which the speaker was shown with mouth closed. The onset of the actual speech event (both visual and auditory) was timed to start on average at 1500ms from the start of the movie, with random jittering of ±500ms. Note that this variable was
independent of the asynchrony on each trial. On each trial the stimulus pairing was selected pseudo-randomly. In an attempt to control for cognitive load, attention and visual fixation in the ‘single-task’ conditions, we included a secondary task involved detecting a dot, which appeared with a probability of 50% on the speaker's tongue at 800ms following movie onset (taking into account the jitter described above). The visual probe was introduced to encourage participants to direct their gaze and attention towards the visual lip movements, in case they become disengaged when lip-movements were highly asynchronous. Participants were instructed to attend to the mouth of the speaker in order to detect the dot, and to listen to what the speaker said. At the end of the movie, in the dual-task context, participants were first visually prompted to decide if they had heard the voice before or after the lip-movements, and then prompted to indicate whether they had heard the phonemes /ba/, /bda/, or /da/. In the single task context, the second prompt was for the presence or absence of the central dot. Responses were made using the arrow keys on a keyboard. In common with previous studies of temporal functions for McGurk illusion (Munhall et al., 1996; van Wassenhove, Grant, & Poeppel, 2007) we presented this limited number of options, representing the percepts most typically reported for the present audiovisual combinations (Soto-Faraco & Alsius, 2007, 2009), to simplify coding of percepts that were visually-driven versus auditory-driven, and thus to construct a single temporal response function. After the McGurk response,
11
Participants completed a total of 288 trials, comprising 8 repetitions of each of the four lip/voice combinations for each of 9 asynchronies.
The Triplets and Harvard Sentences tasks were each administered on separate days. In the
Triplets task, the order of numerals was pseudo-randomised with the constraints that each
number was presented 18 times in each of the three possible positions, each sequence was
unique, and there were no repetitions of a number within each sequence. At the end of each
sequence, participants were prompted to identify the numbers that had been presented by
typing in three numbers using the computer keyboard. The full set of possible numbers (0 to
9, excluding 7) were displayed during the response period. The next sequence followed once
the response was submitted using the ‘return’ key. There were 162 trials in total. The
appropriate SNR for each observer was established in a calibration task performed just before
the main task. Here, participants were presented with triplets in the auditory modality only,
and the amplitude of the speech was adjusted relative to phase-scrambled background noise,
using a one-up one-down adaptive staircase procedure with step sizes of 1dB, over 24 trials.
The final threshold was calculated by averaging the speech amplitudes over the last 5 trials of
each set, and used to set the SNR for the main task.
In the Harvard Sentences task participants were prompted after each sentence presentation to
rate its comprehensibility, by typing in a single number from 1 to 5. The on-screen options
displayed after the stimulus presentation were as follows: ‘1: Totally incomprehensible, 2: Mostly incomprehensible, 3: Many words unclear and gist unclear, 4: Some words unclear but gist comprehensible, 5: Perfectly comprehensible’. An adaptive procedure was used in the main trial sequence (rather than in a prior sequence as for the Triplets task), where the
signal amplitude was increased by 1dB if the response rating was less than or equal to three,
or otherwise decreased by the same amount. Participants completed 200 trials.
Analysis
For the TOJ task, we obtained the proportion of ‘voice second’ responses for each
asynchrony. We estimated the PSS, from a logistic function fitted to the raw data for each
participant using a maximum likelihood algorithm.
For the McGurk task we obtained the percentage of incongruent trials in which the reported
12
coded trials as visually influenced when a ‘ba’ or ‘bda’ response was made to /da/ + [ba]
(12% and 46% of responses respectively) and a ‘da’ or ‘bda’ response was made to /ba/ +
[ga] (37% and 9% respectively). We combined responses to both stimulus types into an
averaged measure of visual bias. For the Number Triplets task, we computed the percentage
of correct word identifications for each asynchrony. In both tasks these performance variables
tended to rise to a peak and then fall as asynchronies varied from auditory lead to lag (Figure
1b). For the Harvard Sentences task, we used the threshold S/N ratio for each asynchrony,
which fell to a minimum at the optimal asynchrony for comprehensibility.
A function-fitting analysis aimed to interpolate the data points using a non-monotonic
asymmetric function, and to read off from this a precise estimate of the asynchrony at which
this function reached a peak, or minimum in the case of the Harvard Sentences data. We refer
to the asynchrony for maximum visual influence as ‘tMax’. For the McGurk task, we fitted
functions individually to data from the fusion and combination illusions, and to the average
of these, following Freeman et al. (2013), and then averaged tMax values estimated from
these fits. Goodness of fit was then estimated for the averaged fitted functions.
We adopted a previously used non-monotonic asymmetric function (Yarrow et al., 2011) to
model task performance 𝑦 depending on audiovisual asynchrony (𝑡) as follows:
𝑦(𝑡, 𝑀, 𝜎) = 𝛷1(𝑡, 𝑀1, 𝜎1) − 𝛷2(𝑡, 𝑀2, 𝜎2)
This equation is composed of two Gaussian cumulative density sub-functions 𝛷(𝑡), each with
its own mean 𝑀 and standard deviation 𝜎. The characteristic bell-shaped asymmetrical curve
is created by subtracting one of these sub-functions from the other. The four free parameters 𝑀1, 𝜎1, 𝑀2, and 𝜎2 in this equation control the width, height, asymmetry and horizontal shift
of the resultant bell-curve. To avoid confusion, it should be understood that we did not fit the two separate cumulative Gaussians sub-functions to the data, but the resulting asymmetrical
13 Results
Our statistical analyses excluded participants for whom tMax and PSS values exceeded a
plausible range (±400ms, based on our experience that values beyond this range are typically
due to poor fitting, plus past literature on the plausible range of audiovisual asynchronies) or
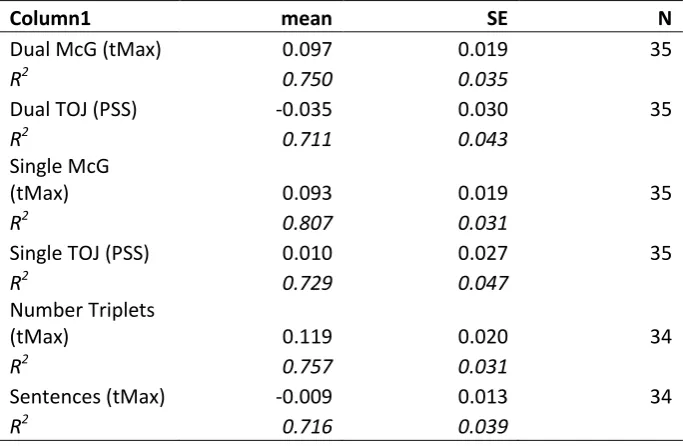
rare cases where the raw data were too noisy to fit reliably. There were 3 exclusions for each of the TOJ tasks, and 1 exclusion for each of the McGurk tasks, leaving 35 complete datasets across these conditions. R2 values were consistent across all tasks (Mean 0.74, SE 0.015, see
Table 1).
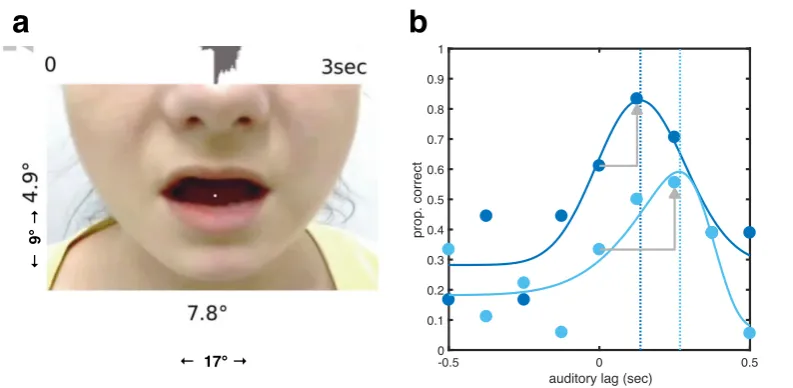
Descriptive statistics for tMax and PSS are shown in Figure 1
a) Still image from movie stimulus, with dimensions and timing information; b) Illustration
of typical data, plotting accuracy for number triplet identification as a function of auditory
lag; results from two example participants shown as blue dots; fitted functions shown as
continuous lines; vertical dotted lines show how tMax is derived from the fitted functions;
grey arrows illustrate how the benefit of desynchronising speech is derived from the
empirical data.
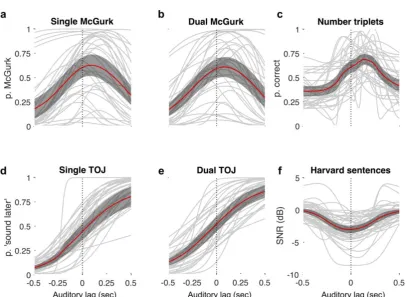
Figure 2
Individual participant fits of responses to different tasks and stimuli, all plotted against
auditory lag, in seconds. (a-b) proportion of McGurk responses in single and dual task
contexts; (c) proportion of correct identifications of number triplets; (d-e) proportion of
‘sound later’ responses in temporal order judgements, for single versus dual tasks; (f) signal
to noise ratio in decibels, for maximal comprehensibility ratings for Harvard sentences.
Average fit in red, with 95% confidence intervals shaded in grey.
Figure 3 for each condition and Table 1. On average, tMax from McGurk and Number
Triplets tasks were biased towards auditory lags by 103ms, SE 0.8ms, and were significantly
different from zero [mean McGurk: t(34) = 5.92, p<0.001, Cohen's D = 1.414; Triplets: t(33)
= 5.87, p<0.001, Cohen's D = 1.423]. However, tMax for the Harvard Sentences was
veridical on average [-1ms, SD 74ms; t(33) = -0.72, p=0.477, Cohen's D = -0.175] and the
14
Cohen's D = -0.115]. In the McGurk tasks, PSS and tMax values were significantly different
from each other [single: t(34) = 2.15, p=0.039, Cohen's D = 0.608; dual: t(34) = 3.19,
p=0.003, Cohen's D = 0.90]; tMax values for the Number Triplets versus Harvard Sentences
tasks were also significantly different [t(33) = 4.56, p<0.001, Cohen's D = 1.298]. There were
no significant differences between PSS values for dual and single TOJ tasks, nor between
tMax values for the McGurk tasks. Differences were also non-significant between average
tMax values for the McGurk tasks and Number Triplets tasks, and between average PSS
values for the TOJ tasks and Harvard Sentences.
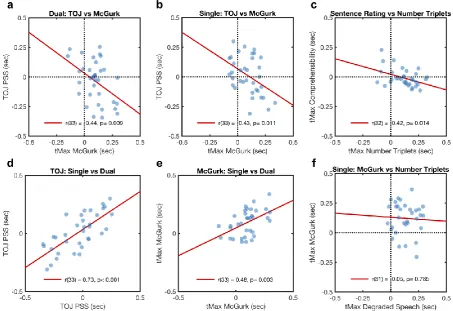
We analysed correlations between these tMax measures of optimal asynchrony (Figure 1
a) Still image from movie stimulus, with dimensions and timing information; b) Illustration
of typical data, plotting accuracy for number triplet identification as a function of auditory
lag; results from two example participants shown as blue dots; fitted functions shown as
continuous lines; vertical dotted lines show how tMax is derived from the fitted functions;
grey arrows illustrate how the benefit of desynchronising speech is derived from the
empirical data.
Figure 2
Individual participant fits of responses to different tasks and stimuli, all plotted against
auditory lag, in seconds. (a-b) proportion of McGurk responses in single and dual task
contexts; (c) proportion of correct identifications of number triplets; (d-e) proportion of
‘sound later’ responses in temporal order judgements, for single versus dual tasks; (f) signal
to noise ratio in decibels, for maximal comprehensibility ratings for Harvard sentences.
Average fit in red, with 95% confidence intervals shaded in grey.
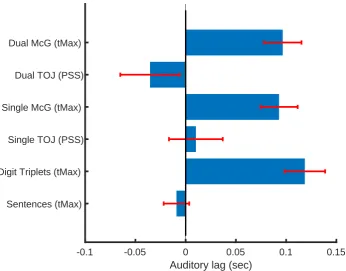
Figure 3
tMax (asynchrony for maximal visual influence over auditory responses) and PSS (point of
subjective simultaneity), averaged across participants for each task, with error bars indicating
15
Figure 4a-d). A negative correlation was found between tMax for McGurk versus TOJ, in the
dual task [r(33) = -0.44, p= 0.009, 95% CI -0.66, -0.09], replicating our previous study. This
effect generalised to the single task context [r(33) = -0.43, p= 0.011, 95% CI -0.66, -.11]. The
correlation between tMax for Triplets versus Sentences tasks was also significantly negative
[r(32) = -0.42, p= 0.014, 95% CI -0.66, -0.09]. Correlations across single and dual contexts
were significantly positive for the TOJ task [r(33) = 0.73, p< 0.001, 95% CI 0.52, 0.85] and
for the McGurk task [r(33) = 0.48, p = 0.003, 95% CI 0.18,0.70]. These positive correlations
indicate that the tMax and PSS estimates could be measured reliably, such that similar values
could be obtained for each individual on different replications of the same task. As a more
conservative analysis, we replicated the above pattern of significant correlations (p<.05) after
filtering out participants with poor function fits (i.e. R2<0.5). As a comparison, we have
replotted data from Ipser et al (2017) plotting tMax for a McGurk task against tMax for the
Number Triplet task, for which there was no significant correlation (Figure 4f, see Discussion
for commentary).
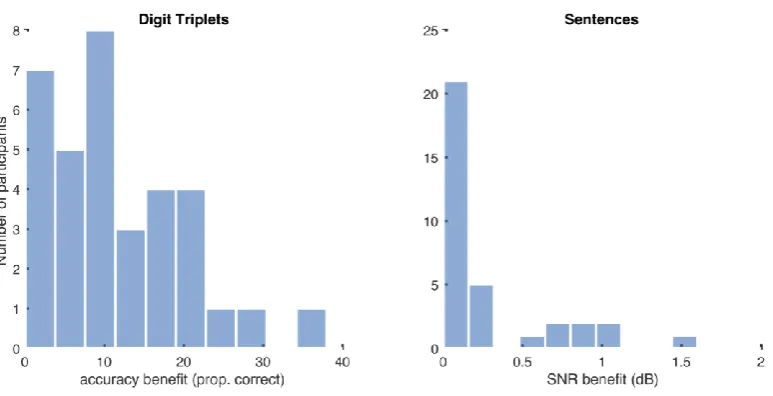
A further analysis assessed how much comprehension might benefit from desynchronising
audio and video. For the Number Triplets task, we found each individual’s empirical peak
accuracy for number identification, and subtracted accuracy measured with veridically
synchronous stimuli (see Figure 1b for an illustration). Mean benefit was 11.6% (SD 8.9). For
the Harvard Sentences task, at each individual’s optimal asynchrony there was only a modest
average improvement in comprehensibility, quantified as a mean decrement in the
signal-to-noise ratio required for a threshold level of subjective comprehensibility of 0.26dB (SD
0.42dB). Nine percent of participants had a decrement of at least 1dB. Such small effects are
likely to be due to the tight clustering of tMax values around veridical for this measure.
Histograms for the distribution of benefits are shown in Table and figure legends
Table 1
Descriptive statistics for average auditory lag (sec) for optimal influence of visual stimulation
on audition (tMax) and for the point of subjective simultaneity (PSS), with average R2 values
16 Figure 1
a) Still image from movie stimulus, with dimensions and timing information; b) Illustration
of typical data, plotting accuracy for number triplet identification as a function of auditory
lag; results from two example participants shown as blue dots; fitted functions shown as
continuous lines; vertical dotted lines show how tMax is derived from the fitted functions;
grey arrows illustrate how the benefit of desynchronising speech is derived from the
empirical data.
Figure 2
Individual participant fits of responses to different tasks and stimuli, all plotted against
auditory lag, in seconds. (a-b) proportion of McGurk responses in single and dual task
contexts; (c) proportion of correct identifications of number triplets; (d-e) proportion of
‘sound later’ responses in temporal order judgements, for single versus dual tasks; (f) signal
to noise ratio in decibels, for maximal comprehensibility ratings for Harvard sentences.
Average fit in red, with 95% confidence intervals shaded in grey.
Figure 3
tMax (asynchrony for maximal visual influence over auditory responses) and PSS (point of
subjective simultaneity), averaged across participants for each task, with error bars indicating
one unit of standard error of the means.
Figure 4
Scatterplots of different measures of audiovisual timing, for three different task contexts. a)
Point of subjective simultaneity (PSS) in a temporal order judgement task (TOJ, vertical axis)
against an implicit measure of asynchrony for maximal visual influence in the McGurk effect
(tMax, horizontal axis), both measured concurrently in a dual task; b) same variables but
measured in separate tasks; c) asynchrony for minimum threshold signal/noise ratio for
17
maximum accuracy in Number Triplet identification, for a separate participant group; d) TOJ
results for single versus dual tasks; e) McGurk results for single vs dual tasks; f) Data
replotted from Ipser et al (2017) showing a null correlation between two implicit measures of
optimal timing for McGurk illusion and degraded-speech word identification.
18 Discussion
The present experiments examined a newly discovered phenomenon whereby different
measures of perceptual asynchrony correlate with each other negatively (Freeman et al.,
2013). We have established the generality and validity of this phenomenon across a variety of
task contexts and stimuli never previously tested in combination, and gained new insights
into the underlying mechanisms, while helping to discount the role of response biases,
stimulus incongruities, or attentional demands. While current theories of perceptual timing
would predict a positive or null correlation, our results provide fresh support for higher-order
mechanisms which may function to renormalize, rather than minimise discrepancies in
sensory event timing across the brain.
In our previous study we used a dual-task paradigm (Freeman et al., 2013) to measure the
audiovisual asynchrony required to elicit maximum McGurk illusion (tMax) and the
asynchrony necessary for perception of simultaneity (PSS). We found that the greater the
auditory delay an individual required to maximise the illusion, the more that same individual
tended to require an opposite visual lag to explicitly perceive the auditory and visual streams
as being simultaneous. This counterintuitive negative-correlation phenomenon might be
highly informative about the mechanisms underlying our perception of event timing, but first,
a number of alternative explanations remained to be excluded. One possibility is that
responses to one task might have been biased by previously responding to another task in the
same trial, or that individual differences in selective attention to one concurrent task versus
the other might have led to apparently antagonistic measures of perceptual timing. To exclude
this possibility, here we tested McGurk task and Temporal Order Judgement task (TOJ) as
separate single tasks, in which no such potential biases were present. Because we found
similar negative correlations between McGurk-tMax and TOJ-PSS under both single and
dual-task conditions, biases from performance of concurrent tasks cannot explain away the
negative correlation. The stability of our measures across testing episodes also helps to reject
the possibility that our measures are dependent on the participant’s current state or on the
specific combination of tasks that they are concurrently performing: we found negative
correlations between explicit (e.g. PSS) and implicit measures (e.g. tMax) obtained from
single tasks, administered separately within an experimental session, and positive correlations
between the same measures obtained from separate single-task and dual-task contexts (e.g.
19
a) Still image from movie stimulus, with dimensions and timing information; b) Illustration
of typical data, plotting accuracy for number triplet identification as a function of auditory
lag; results from two example participants shown as blue dots; fitted functions shown as
continuous lines; vertical dotted lines show how tMax is derived from the fitted functions;
grey arrows illustrate how the benefit of desynchronising speech is derived from the
empirical data.
Figure 2
Individual participant fits of responses to different tasks and stimuli, all plotted against
auditory lag, in seconds. (a-b) proportion of McGurk responses in single and dual task
contexts; (c) proportion of correct identifications of number triplets; (d-e) proportion of
‘sound later’ responses in temporal order judgements, for single versus dual tasks; (f) signal
to noise ratio in decibels, for maximal comprehensibility ratings for Harvard sentences.
Average fit in red, with 95% confidence intervals shaded in grey.
Figure 3
tMax (asynchrony for maximal visual influence over auditory responses) and PSS (point of
subjective simultaneity), averaged across participants for each task, with error bars indicating
one unit of standard error of the means.
Figure 4d-e). This provides further evidence that each individual’s preference for different
lags for different tasks may constitute a relatively stable trait-like characteristic of their
perception (Grabot & van Wassenhove, 2017; Ipser et al., 2017).
20
to error, as there is no veridical match between auditory and visual features. Furthermore, in contrast with the integrative McGurk task, the TOJ task might also specifically require comparing the features of distinct auditory and visual events to judge their respective onsets. Discrepancies between the asynchronies that are optimal for each task might therefore arise due to differences in weighting of different features in the two tasks. It is also arguable that the McGurk paradigm, which depends on an illusory deviation from veridical, also lacks validity as an assay of the physical asynchrony that is actually best for audiovisual
integration. These concerns were all addressed here by using congruent stimuli, and implicit measures of audiovisual integration based on accuracy of speech identification such as that provided by our Triplets task. We again found evidence of negative correlations between the asynchrony for optimal Triplets identification versus optimal subjective comprehensibility of Harvard Sentences, which supports the generality and validity of our measures of this
phenomenon.
21
present a variable combination of influences that might correlate both negatively and positively with TOJ, resulting in an overall null correlation.
As outlined in the Introduction, leading theoretical accounts have often assumed that discrepancies in sensory event timing across different brain areas are either statistically independent, or that they may be minimised, compensated for or unified (Freeman & Driver, 2008; Fujisaki et al., 2004; Hanson et al., 2008; Harris et al., 2008; Ivry & Spencer, 2004; Keetels & Vroomen, 2012; Miyazaki et al., 2006; Morein-Zamir et al., 2003; Sternberg & Knoll, 1973; Treisman, 1963; Vroomen & de Gelder, 2004; Yamamoto et al., 2012). These accounts would predict either a positive or null correlation of different measures of
perceptual asynchrony. The counterintuitive negative correlation between our implicit and explicit measures of perceptual timing points to a different kind of higher-order mechanism governing perceptual timing whereby such discrepancies are instead normalized relative to each other. Although such a mechanism might appear to antagonise rather than minimise disparities in perceptual timing between tasks, we have previously proposed that this actually reveals a strategy by which the brain maximises certainty about the timing of multisensory events in the world (Freeman et al., 2013).
A useful analogy for our proposed mechanism is to consider estimating the correct time in a roomful of clocks: we might not know whether each clock is correct, or randomly slow or fast, but these errors can be minimised if we take an average across clocks. However if one clock is particularly slow, it will attract the average so that other unaffected clocks actually appear fast. To translate the analogy to perceptual timing, it may be assumed that different measures of timing (e.g. tMax and PSS) probe different sub-networks in the brain, each subject to different neural delays, which may vary between individuals for functional and anatomical reasons. Each sub-network therefore suffers the ambiguity of not knowing how much the timing of its incoming neural signals reflects the actual timing of external events and how much it reflects internal delays (Scharnowski et al., 2013). This uncertainty might be reduced by normalising each local asynchrony relative to the distribution of all such
22
auditory lag (for example), it will attract the average so that the events registered in other sub-networks will be perceived as tending to have an auditory lead. Thus, the more the local timing estimates for one task deviate from the central tendency in a given individual, the more other local estimates relevant to other tasks will seem to be biased in the opposite direction. Renormalization therefore explains why individual differences in the lags measured for one task may anti-correlate with lags measured for other tasks. To summarize the general idea of this theory of Temporal Renormalization: the event timing within one sub-network is perceived relative to the distribution of event timings across the ensemble.
It is notable that some participants show biases towards auditory lags in both measures, however such a distribution is predicted by this theory given that each of our two timing estimates is renormalized not only relative to the other, but also relative to other implicit sources of temporal variability which are not currently measured. In our first paper (Freeman et al., 2013, supplementary materials) we simulated this phenomenon assuming two measured ‘clocks’ and one hidden one, and a similar distribution of datapoints was generated with some showing biases with the same sign.
23
An additional constraint is suggested by a comparison of implicit versus explicit tasks. All the tasks considered so far here have combined an implicit measure of integration efficiency (based on syllable or word identification), with an explicit measure of subjective perceptual timing (TOJ) or comprehensibility (Harvard Sentences). It is therefore unclear from the present data alone whether it is critical to have the contrast between explicit versus implicit tasks in order to obtain the negative correlation effect. However, we have previously compared two implicit measures of optimal asynchrony (tMax) for McGurk with tMax for verbal identification of degraded speech of single bisyllabic words (Ipser et al., 2017). In this case, there was no significant correlation between these measures (see Figure 1
a) Still image from movie stimulus, with dimensions and timing information; b) Illustration
of typical data, plotting accuracy for number triplet identification as a function of auditory
lag; results from two example participants shown as blue dots; fitted functions shown as
continuous lines; vertical dotted lines show how tMax is derived from the fitted functions;
grey arrows illustrate how the benefit of desynchronising speech is derived from the
empirical data.
Figure 2
Individual participant fits of responses to different tasks and stimuli, all plotted against
auditory lag, in seconds. (a-b) proportion of McGurk responses in single and dual task
contexts; (c) proportion of correct identifications of number triplets; (d-e) proportion of
‘sound later’ responses in temporal order judgements, for single versus dual tasks; (f) signal
to noise ratio in decibels, for maximal comprehensibility ratings for Harvard sentences.
Average fit in red, with 95% confidence intervals shaded in grey.
Figure 3
tMax (asynchrony for maximal visual influence over auditory responses) and PSS (point of
subjective simultaneity), averaged across participants for each task, with error bars indicating
24
Figure 4f, replotting data from the previous study), even though there were reliable
within-task positive correlations across testing sessions. We had initially speculated that the negative correlation had been abolished because the two tasks were based on physically rather
different stimuli, i.e. single syllables versus words. However this seems less likely given that here we have obtained a negative correlation between triplets of words versus whole
sentences, which were also rather different in length and content. An alternative constraint might therefore be that the negative correlation effect manifests specifically when explicit subjective measures are included in the analysis, such as TOJ and comprehensibility ratings. Paradoxically, the consequence of this phenomenon might be that an asynchrony that is optimal for accurate word identification in the Triplets task may seem subjectively asynchronous, leading to reduced ratings of sentence comprehensibility.
The difference between implicit and explicit tasks receives further support from our finding of marked average preferences for auditory lags in our implicit measures, but no such bias on average for our subjective measures of temporal order and the speech comprehensibility ratings. As a further constraint to our explanatory account, we therefore propose that renormalization may be most effective for adjusting the subjective perception of timing, providing one mechanism for maintaining simultaneity constancy (Harris et al., 2008; Kopinska & Harris, 2004) and subjective unity of multisensory events (Vatakis & Spence, 2007) despite variable neural latencies in signal processing. In contrast, implicit measures may reflect more literally the relative latencies for physically propagating and processing signals from audition and vision as they converge on a relevant integration site. Such latencies may be intrinsically hard to adjust or minimise, while the translation from such latencies to the subjective perception of event timing might be more labile, and dependent on renormalization. In other words, explicit measures might be renormalized relative to implicit measures which themselves remain fixed. This might explain why a negative correlation was only found between pairings of explicit versus implicit tasks, but not between the two
implicit tasks measured in our previous study (Ipser et al., 2017, Figure 5 here). However the apparent robustness of our implicit measures to renormalization contrasts with evidence from the literature on temporal ‘recalibration’, from which there is some evidence to suggest that both explicit measures and implicit measures of the point of perceptual simultaneity (e.g. based on stream-bounce illusion or McGurk effect) can shift following adaptation to a
25
that implicit measures are susceptible to temporal recalibration but not renormalization suggests that these may be distinct mechanisms.
A secondary aim of this research was to test a novel automated method for measuring speech
integration as a function of audiovisual asynchrony, which could be administered over the
internet or via an ‘app’, without supervision. Such a method could have several benefits. For
example, previous studies have suggested that abnormalities in the window of integration
might be associated with schizotypal personality traits, autism spectrum traits, and dyslexia
(Foss-Feig et al., 2010; Hairston, Burdette, Flowers, Wood, & Wallace, 2005; Martin,
Giersch, Huron, & van Wassenhove, 2013), but it is not yet clear whether there are also
associations with the actual asynchrony of audiovisual integration. An automated on-line test
could potentially be used to extend research into such associations, and ultimately as a
diagnostic tool to detect shifts of the optimal audiovisual asynchrony for integration, or
differences in the width of the windows of integration. Our results with the Triplets task
shows that this automated method generates data that are reliable enough to correlate
significantly (albeit negatively) with other measures, such as the Harvard Sentences task.
Our results also suggest that word identification accuracy is typically suboptimal in the
Triplets task when presented at natural synchrony, and that it can improve by 12 triplets in
every 100 on average (SD 7.5%), when the stimuli are presented at each individuals’ optimal
asynchrony. If performance is suboptimal for some individuals with synchronous stimuli, this
suggests that once an individual’s personal audiovisual asynchrony has been measured (e.g.
using our automated procedure), their comprehension of speech while watching multimedia
presentations (e.g. in streaming video, or language learning software) might be improved
boosted by individually delaying the auditory or visual stream. An automated test of the kind
we have constructed might be used to estimate the lag that can optimise an individual’s
comprehension. Such an auditory lag could then be incorporated into multimedia streaming
software, personal hearing aids and cockpit communication systems (to take just a few
examples), to optimise comprehension. However it is notable that benefits were much greater
for the implicit task than the explicit speech comprehensibility task. Optimal asynchronies in
the subjective task were centred tightly around zero (veridical), so there was typically little
difference between the dependent measure sampled at the peak of the asynchrony function
relative to at zero asynchrony. Thus there appears to be less quantitative benefit of
desynchronising the stimuli for the subjective quality of speech comprehensibility, than for
26
whole sentences can be similarly improved when measured using an implicit task rather than
the subjective comprehensibility rating task used here. Given the apparent dissociation
between implicit measures of comprehension accuracy and explicit comprehensibility ratings
or simultaneity, a further new implication is that for some individuals with large perceptual
asynchronies, an auditory or visual delay that fully optimises their comprehension accuracy
might actually feel uncomfortably asynchronous if this delay is outside their window for
27 Conclusion
In this study we have successfully generalised a curious finding from our previous study to a
variety of different tasks with more complex speech stimuli. In each case, we found that
subjective measures of audiovisual synchronisation correlated negatively with measures of
the optimal asynchrony for integration, even when these were tested at different times. Our
results support and provide new constraints for our proposed theory of Temporal
Renormalization, which explains the negative correlation: we propose that audiovisual
stimuli evoke a generic signature distribution of asynchronous activity around the brain, and
that the subjective timing of these stimuli is perceived in relation to this distribution. Our
results are also encouraging for future research and development of technologies that might
28 Acknowledgements
We thank Leima Gheran and Mayara de Paula for assistance with data collection. This
29 References
Brainard, D. H. (1997). The Psychophysics Toolbox. Spat.Vis., 10, 433–436. http://doi.org/10.1017/CBO9781107415324.004
Dennett, D., & Kinsbourne, M. (1995). Time and the observer: The where and when of consciousness in the brain. Behavioral and Brain Sciences, 15(1992), 1–35. http://doi.org/10.1017/S0140525X02330061
Efron, R. (1963). The effect of handedness on the perception of simultaneity and temporal order. Brain, 86(2), 261. http://doi.org/10.1093/brain/86.2.261
Foss-Feig, J. H., Kwakye, L. D., Cascio, C. J., Burnette, C. P., Kadivar, H., Stone, W. L., & Wallace, M. T. (2010). An extended multisensory temporal binding window in autism spectrum disorders. Experimental Brain Research, 203(2), 381–9.
http://doi.org/10.1007/s00221-010-2240-4
Freeman, E. D., & Driver, J. (2008). Direction of visual apparent motion driven solely by timing of a static sound. Current Biology, 18(16), 1262–1266.
http://doi.org/10.1016/j.cub.2008.07.066
Freeman, E. D., Ipser, A., Palmbaha, A., Paunoiu, D., Brown, P., Lambert, C., … Driver, J. (2013). Sight and sound out of synch: Fragmentation and renormalization of audiovisual integration and subjective timing. Cortex, 49(10), 2875–2887.
http://doi.org/http://dx.doi.org/10.1016/j.cortex.2013.03.006
Fujisaki, W., Shimojo, S., Kashino, M., & Nishida, S. (2004). Recalibration of audiovisual simultaneity. Nature Neuroscience, 7(7), 773–8. http://doi.org/10.1038/nn1268
Ghazanfar, A. A., & Schroeder, C. E. (2006). Is neocortex essentially multisensory? Trends in Cognitive Sciences, 10(6), 278–285. http://doi.org/10.1016/j.tics.2006.04.008 Grabot, L., & van Wassenhove, V. (2017). Time order as psychological bias. Psychological
Science, 956797616689369.
Hairston, W. D., Burdette, J. J. H., Flowers, D. L., Wood, F. B., & Wallace, M. T. (2005). Altered temporal profile of visual-auditory multisensory interactions in dyslexia. Experimental Brain Research, 166(3–4), 474–80. http://doi.org/10.1007/s00221-005-2387-6
Halliday, A., & Mingay, R. (1964). On the resolution of small time intervals and the effect of conduction delays on the judgement of simultaneity. Quarterly Journal of Experimental Psychology, 16(1), 37–41.
Hanson, J. V. M., Heron, J., & Whitaker, D. (2008). Recalibration of perceived time across sensory modalities. Experimental Brain Research, 185(2), 347–352.
http://doi.org/10.1007/s00221-008-1282-3
Harris, L. R., Harrar, V., Jaekl, P., & Kopinska, A. (2008). Mechanisms of simultaneity constancy. In R. Nijhawan (Ed.), Issues of Space and Time in Perception and Action (pp. 232–253). Cambridge University Press.
IEEE. (1969). IEEE Recommended Practice for Speech Quality Measurements. IEEE Transactions on Audio and Electroacoustics, 17(3), 225–246.
30
Ipser, A., Agolli, V., Bajraktari, A., Al-Alawi, F., Djaafara, N., & Freeman, E. D. (2017). Sight and sound persistently out of synch: stable individual differences in audiovisual synchronisation revealed by implicit measures of lip-voice integration. Scientific Reports, 7(October 2016), 46413. http://doi.org/10.1038/srep46413
Ivry, R. B., & Spencer, R. M. C. (2004). The neural representation of time. Current Opinion in Neurobiology, 14(2), 225–232. http://doi.org/10.1016/j.conb.2004.03.013
Keetels, M., & Vroomen, J. (2012). Perception of Synchrony between the Senses. In M. M. Murray & M. T. Wallace (Eds.), The Neural Bases of Multisensory Processes (pp. 1– 27). Boca Raton (FL): CRC Press.
King, A. J. (2005). Multisensory integration: strategies for synchronization. Current Biology, 15(9), R336-339. http://doi.org/10.1016/j.cub.2005.04.025
Kopinska, A., & Harris, L. R. (2004). Simultaneity constancy. Perception, 33(9), 1049–1060. Love, S. A., Petrini, K., Cheng, A., & Pollick, F. E. (2013). A Psychophysical Investigation
of Differences between Synchrony and Temporal Order Judgments. PLoS ONE, 8(1). http://doi.org/10.1371/journal.pone.0054798
Machulla, T., Di Luca, M., & Ernst, M. O. (2016). The Consistency of Crossmodal Synchrony Perception across the Visual, Auditory, and Tactile Senses. Journal of Experimental Psychology. Human Perception and Performance, (1), 1–13. http://doi.org/10.1007/s13398-014-0173-7.2
Maier, J. X., Di Luca, M., & Noppeney, U. (2011). Audiovisual Asynchrony Detection in Human Speech. Journal of Experimental Psychology: Human Perception and Performance, 37(1), 245–256. http://doi.org/10.1037/a0019952
Martin, B., Giersch, A., Huron, C., & van Wassenhove, V. (2013). Temporal event structure and timing in schizophrenia: Preserved binding in a longer “now”. Neuropsychologia, 51(2), 358–71. http://doi.org/10.1016/j.neuropsychologia.2012.07.002
Mauk, M. D., & Buonomano, D. V. (2004). The neural basis of temporal processing. Annual Review of Neuroscience, 27, 307–40.
http://doi.org/10.1146/annurev.neuro.27.070203.144247
McGurk, H., & MacDonald, J. (1976). Hearing lips and seeing voices. Nature, 264(5588), 746–748. http://doi.org/10.1038/264746a0
Miyazaki, M., Yamamoto, S., Uchida, S., & Kitazawa, S. (2006). Bayesian calibration of simultaneity in tactile temporal order judgment. Nature Neuroscience, 9(7), 875–877. http://doi.org/10.1038/nn1712
Mollon, J., & Perkins, A. (1996). Errors of judgement at Greenwich in 1796. Nature, 380(Mar 14), 101–102.
Morein-Zamir, S., Soto-Faraco, S., & Kingstone, A. (2003). Auditory capture of vision: examining temporal ventriloquism. Cognitive Brain Research, 17(1), 154–163. Munhall, K. G., Gribble, P., Sacco, L., & Ward, M. (1996). Temporal constraints on the
McGurk effect. Perception & Psychophysics, 58(3), 351–362.
31 Vision, 10(5), 2. http://doi.org/10.1167/10.5.2
Pöpple, E. (1988). Mindworks. Time and Conscious Experience. San Diego: Harcourt Brace Jovanovich.
Scharnowski, F., Rees, G., & Walsh, V. (2013). Time and the brain: neurorelativity. Trends in Cognitive Sciences, 17(2), 51–2. http://doi.org/10.1016/j.tics.2012.12.005
Schneider, K. A., & Bavelier, D. (2003). Components of visual prior entry. Cognitive Psychology, 47(4), 333–366. http://doi.org/10.1016/S0010-0285(03)00035-5
Sekuler, R., Sekuler, A., & Lau, R. (1997). Sound alters visual motion perception. Nature, 385(23rd January), 308.
Smits, C., Kapteyn, T. S., & Houtgast, T. (2004). Development and validation of an automatic speech-in-noise screening test by telephone. International Journal of Audiology, 43(1), 15–28.
Soto-Faraco, S., & Alsius, A. (2007). Conscious access to the unisensory components of a cross-modal illusion. Neuroreport, 18(4), 347–350.
http://doi.org/10.1097/WNR.0b013e32801776f9
Soto-Faraco, S., & Alsius, A. (2009). Deconstructing the McGurk-MacDonald illusion. Journal of Experimental Psychology: Human Perception and Performance, 35(2), 580– 587. http://doi.org/10.1037/a0013483
Sternberg, S., & Knoll, R. L. (1973). The perception of temporal order: Fundamental issues and a general model. Attention and Performance IV, 80(3), 629–685.
http://doi.org/10.1016/j.biosystems.2004.12.002
Stone, J. V, Hunkin, N. M., Porrill, J., Wood, R., Keeler, V., Beanland, M., … Porter, N. R. (2001). When is now? Perception of simultaneity. Proceedings of the Royal Society B: Biological Sciences, 268(1462), 31–38. http://doi.org/10.1098/rspb.2000.1326
Sumby, W. H., & Pollack, I. (1954). Visual Contribution to Speech Intelligibility in Noise. Journal of the Acoustical Society of America, 26(2), 212–215.
http://doi.org/10.1121/1.1907309
Treisman, M. (1963). Temporal discrimination and the indifference interval. Implications for a model of the “internal clock”. Psychological Monographs, 77(13), 1–31.
Van Eijk, R. L. J., Kohlrausch, A., Juola, J. F., & Van De Par, S. (2008). Audiovisual synchrony and temporal order judgments: effects of experimental method and stimulus type. Perception & Psychophysics, 70(6), 955–968.
van Wassenhove, V., Grant, K. W., & Poeppel, D. (2007). Temporal window of integration in auditory-visual speech perception. Neuropsychologia, 45(3), 598–607.
http://doi.org/10.1016/j.neuropsychologia.2006.01.001
Vatakis, A., Navarra, J., Soto-Faraco, S., & Spence, C. (2008). Audiovisual temporal
adaptation of speech: temporal order versus simultaneity judgments. Experimental Brain Research, 185(3), 521–9. http://doi.org/10.1007/s00221-007-1168-9
32
screening for high-frequency hearing loss. Ear and Hearing, 35(6), 667–79. http://doi.org/10.1097/AUD.0000000000000073
Vroomen, J., & de Gelder, B. (2004). Temporal ventriloquism: sound modulates the flash-lag effect. Journal of Experimental Psychology: Human Perception and Performance, 30(3), 513–518. http://doi.org/10.1037/0096-1523.30.3.513
Vroomen, J., & Stekelenburg, J. J. (2011). Perception of intersensory synchrony in audiovisual speech: not that special. Cognition, 118(1), 75–83.
http://doi.org/10.1016/j.cognition.2010.10.002
Yamamoto, S., Miyazaki, M., Iwano, T., & Kitazawa, S. (2012). Bayesian calibration of simultaneity in audiovisual temporal order judgments. PloS ONE, 7(7), e40379. http://doi.org/10.1371/journal.pone.0040379
Yarrow, K., Jahn, N., Durant, S., & Arnold, D. H. (2011). Shifts of criteria or neural timing? The assumptions underlying timing perception studies. Consciousness and Cognition, 20(4), 1518–31. http://doi.org/10.1016/j.concog.2011.07.003
Yuan, X., Bi, C., Yin, H., Li, B., & Huang, X. (2014). The recalibration patterns of perceptual synchrony and multisensory integration after exposure to asynchronous speech. Neuroscience Letters, 569, 148–52. http://doi.org/10.1016/j.neulet.2014.03.057 Zeki, S., & Bartels, A. (1998). The asynchrony of consciousness. Proceedings of the Royal
33 Table and figure legends
Table 1
Descriptive statistics for average auditory lag (sec) for optimal influence of visual stimulation
on audition (tMax) and for the point of subjective simultaneity (PSS), with average R2 values
for the goodness of function fits.
Figure 1
a) Still image from movie stimulus, with dimensions and timing information; b) Illustration
of typical data, plotting accuracy for number triplet identification as a function of auditory
lag; results from two example participants shown as blue dots; fitted functions shown as
continuous lines; vertical dotted lines show how tMax is derived from the fitted functions;
grey arrows illustrate how the benefit of desynchronising speech is derived from the
empirical data.
Figure 2
Individual participant fits of responses to different tasks and stimuli, all plotted against
auditory lag, in seconds. (a-b) proportion of McGurk responses in single and dual task
contexts; (c) proportion of correct identifications of number triplets; (d-e) proportion of
‘sound later’ responses in temporal order judgements, for single versus dual tasks; (f) signal
to noise ratio in decibels, for maximal comprehensibility ratings for Harvard sentences.
Average fit in red, with 95% confidence intervals shaded in grey.
Figure 3
tMax (asynchrony for maximal visual influence over auditory responses) and PSS (point of
subjective simultaneity), averaged across participants for each task, with error bars indicating
34 Figure 4
Scatterplots of different measures of audiovisual timing, for three different task contexts. a)
Point of subjective simultaneity (PSS) in a temporal order judgement task (TOJ, vertical axis)
against an implicit measure of asynchrony for maximal visual influence in the McGurk effect
(tMax, horizontal axis), both measured concurrently in a dual task; b) same variables but
measured in separate tasks; c) asynchrony for minimum threshold signal/noise ratio for
explicit Harvard Sentence comprehensibility ratings, against implicit asynchrony for
maximum accuracy in Number Triplet identification, for a separate participant group; d) TOJ
results for single versus dual tasks; e) McGurk results for single vs dual tasks; f) Data
replotted from Ipser et al (2017) showing a null correlation between two implicit measures of
optimal timing for McGurk illusion and degraded-speech word identification.
Figure 5
Distribution of benefits from individually desynchronising audio and video. SNR: Signal to
35 Table 1
Column1 mean SE N
Dual McG (tMax) 0.097 0.019 35
R2 0.750 0.035
Dual TOJ (PSS) -0.035 0.030 35
R2 0.711 0.043
Single McG
(tMax) 0.093 0.019 35
R2 0.807 0.031
Single TOJ (PSS) 0.010 0.027 35
R2 0.729 0.047
Number Triplets
(tMax) 0.119 0.020 34
R2 0.757 0.031
Sentences (tMax) -0.009 0.013 34
38 Figure 3
-0.1 -0.05 0 0.05 0.1 0.15
Auditory lag (sec) Sentences (tMax)
Digit Triplets (tMax) Single TOJ (PSS) Single McG (tMax)