This work was supported by the National Natural Science Foundation of China (61771027; 61071139; 61471019; 61671035; 61071071). Dr E. Yang is supported in part under the RSE-NNSFCJoint Project (2017-2019) (6161101383) with China University of Petroleum (Huadong). Professor A. Hussain is supported by the UK Engineering and Physical Sciences Research Council (EPSRC) grant no. EP/M026981/1.
1. School of Electronic and Information Engineering, Beihang University, Beijing 100191, China.
2. Space Mechatronic Systems Technology Laboratory, Department of Design, Manufacture and Engineering Management, University of Strathclyde, Glasgow G1 1XJ, UK.
3. Cognitive Signal-Image and Control Processing Research Laboratory, School of Natural Sciences, University of Stirling, Stirling FK9 4LA, UK.
A Novel Semi-Supervised Classification Method Based on Class
Certainty of Samples
Fei Gao1, Zhenyu Yue1,*, Qingxv Xiong1, Jun Wang1, Erfu Yang2, Amir Hussain3
[email protected]; [email protected]
Abstract.—The traditional classification method based on supervised learning classifies remote sensing (RS) images by using sufficient labeled samples. However, the number of labeled samples is limited due to the expensive and time-consuming collection. To effectively utilize the information of unlabeled samples in the learning process, this paper proposes a novel semi-supervised classification method based on class certainty of samples (CCS). First, the class certainty of unlabeled samples obtained based on multi-class SVM is smoothed for robustness. Then, a new semi-supervised linear discriminant analysis (LDA) is presented based on class certainty, which improves the separability of samples in the projection subspace. Ultimately, we extend the semi-supervised LDA to nonlinear dimensional reduction by combining class certainty and kernel methods. Furthermore, to assess the effectiveness of proposed method, the nearest neighbor classifier is adopted to classify actual SAR images. The results demonstrate that the proposed method can effectively exploit the information of unlabeled samples and greatly improve the classification effect compared with other state-of-the-art approaches.
Keywords: remote sensing images; semi-supervised classification; class certainty; semi-supervised LDA; kernel method
1
Introduction
With the rapid development of the remote sensing (RS) technology, the higher-resolution and more informative RS images are acquired. Due to the classification ability under certain conditions, RS images has been widely applied to areas such as target surveillance, disaster relief, environmental protection and
etc[1,2]. However, it’s difficult to achieve accurate classification of RS images, which has become one of research hotspots[3].
The traditional RS images classification technologies are mainly based on unsupervised learning [4]and supervised learning [5]. Unsupervised methods cluster the similar samples together by exploiting the characteristic distribution of samples. Since prior knowledge is not required, unsupervised learning methods are easy to implement. However, since such methods only consider the characteristic difference among samples and lack the effective guidance of label information, the classification performance is not idea normally. To overcome the aforementioned disadvantage, the supervised methods are adopted to quickly capture the label information by learning the mapping function between the features and labels of training data[6]. The classification performance of supervised methods are significantly improved with sufficient labeled samples. Nevertheless, the sample labeling for RS images is time-consuming, and the robustness of the classifier is worse when the labelled samples are insufficient [7]. But unlabeled samples can be generated in a relatively easier way and their rich characteristic information is helpful for improving the classification performance[8]. Semi-supervised learning can automatically exploits unlabeled samples to improve the learning performance based on labeled samples.
generative mode, semi-supervised SVM [10], graph-based model [11], self-training model and co-learning model [12]. For the semi-supervised algorithms, unlabeled samples are used to enlarge initial labeled samples set and make the classification surface pass through the space with sparse samples. In [13], the transductive support vector machine(TSVM) is developed to search the optimal classification surface based on margin maximization by iteratively assigning the sample positive label or negative one. Persello and Bruzzone present a progressive semi-supervised SVM with diversity (PS3VM-D) to make candidate samples within and closer to the margin band [14]. Then, samples are incrementally selected among the candidates considering the kernel cosine-angular similarity. Based on co-training model, Zhou designed a tri-training algorithm by training three classifiers. Then, reliable unlabeled samples are selected by one classifier and added to the labeled samples set of the other two classifiers in an iterative way [15]. Although the aforementioned algorithms are proved to be effective experimentally, semi-supervised learning methods are not always helpful because of the strict requirements of data distribution, selection method and labeling method for unlabeled samples.
To effectively improve RS images classification performance, this paper proposes a novel semi-supervised classification method by utilizing unlabeled samples based on class certainty of samples (CCS). Different from other semi-supervised algorithms, CCS initially assigns the class certainty to unlabeled samples and integrates it to the scatter matrixes of linear discriminant analysis (LDA). The new scatter matrixes can effectively describe the true characteristic distribution, which makes samples more separable in the projection subspace. Since the class certainty is used to measure the class reliability of samples, the unlabeled samples with high reliability play a more important role than those with low reliability in CCS. To ensure the sufficient class reliability of unlabeled samples in the subsequent semi-supervised process, the class certainty is smoothed through normalization and threshold considering the complicated distribution of samples. As a result, the performance of CCS is greatly improved.
The rest of this paper is organized as follows. Section 2 describes the proposed method in detail. The experiments for the SAR targets classification are provided in Section 3 and the conclusions are drawn in Section 4.
2
Proposed Method
In this part, we first present the related definition. The training samples
X
[ , ]
L U
R
d N are divided into two parts according to the label of samples. LetL
[ ,
x x
1 2,
,
x
l] R
d l be the feature matrix of labeled samples with label vector[ ,
y y
1 2,
,
y
l]
,y
i
{1, 2
, }
k
and1 2
[
l,
l,
,
l u] R
d u
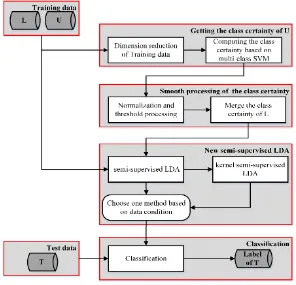
Fig 1. Flowchart of the proposed method CCS.
2.1 Getting the class certainty of unlabeled samples
Dimension reduction of Training data
In Fig 1, the inputs of CCS are the original RS training data L and U in high-dimension. To get the class certainty information quickly, the computational complexity and the dimension of training data should be reduced. Thus, based on KLDA algorithm, the projection characteristics
L
1andU
1are obtained.Computing the class certainty based on multi-class SVM
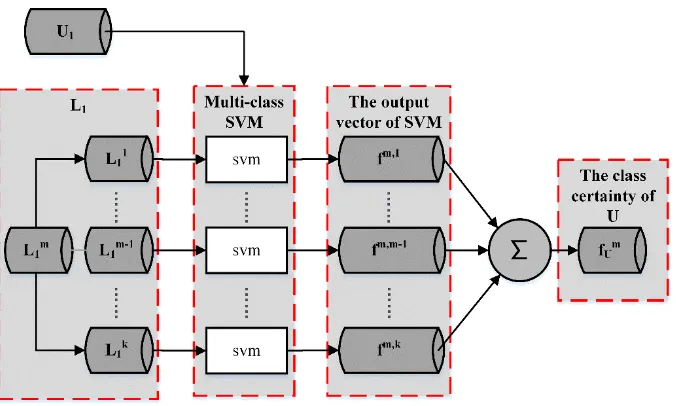
The output of SVM can effectively measure the class certainty of samples. After the dimension reduction, SVM can be trained based on the labeled samples
L
1. Because the samples are generallyFig 2. Constructing the multi-class SVM and getting the class m certainty of unlabeled samples.
1
m
L
denotes labeled samples of class m with reduced dimension.Let
L
1m and samples of the other classes be positive labels and negative labels, respectively. Then, after training k-1 binary SVM betweenL
1mand other classes of samples, the corresponding output vector is derived by passingU
1 to every binary SVM. For example: m m, -1
(
T
(
1)
)
Tf
w
U
b
denotes theoutput vector of the SVM trained by
L
1mandL
1m1. Obviously, different output vectors can be obtained in this way. To get the class m certaintyf
Um, the output vectors are added based on the idea of voting method. Similarly, other class certainty i,
i
1, 2
, ,
k i
m
f
can be obtained according to thecorresponding implementation.
2.2 Smooth processing of the class certainty
Normalization and threshold processing
Since the class i certainty
f
Ui(
i
{1, 2
, })
k
contains elements ranged from less than 0 to larger than 1, they should be normalized and threshold processed before utilizing. Accordingly, min-max standard method is applied for analysis, which can be written asmin
{1, 2 , } max min
i
i U
U i k
f
p , (1)
where
p
Ui represents the class i certainty of Uafter normalization processing. Then, we choose threshold[0,1]
t . If the element of
p
Ui is less than t, we set it to 0., ,
,
0,
,
{1, 2
, },
{1, 2
}
, others
i U j i
U j i U j
i
k
j
u
p
t
p
p
(2)where pU ji, denotes the j-th element of vector
p
Ui . The greater threshold t means higher reliability requirement for the utilized unlabeled samples.Merge the class certainty of labeled samples
Assuming that
L
i,
i
{1, 2
, }
k
is the original labeled sample set of class i. It’s obvious that thecorresponding class i certainty is 1 and the other class certainty is 0. Thus, the class i certainty vector
p
Li,
1,
, {1, 2 , }, {1, 2 }
0, j i L j j y i
i k j l
y i
p (3)
where pL ji, and
y
j denote the j-th element of vector i Lp
and the label of samplex
j, respectively. Bycombining
p
iLandp
Ui , the class i certainty vector of training dataX [ , ]L U is obtained:[
,
],
{1, 2
, }
i i i
L U
i
k
p
p
p
(4)2.3 New semi-supervised LDA
Semi-supervised LDA
In this section, we propose a novel semi-supervised LDA method by integrating class certainty into the scatter matrixes so that the samples are more separable in the projection subspace. To derive the new scatter matrixes, the within-class mean vector
u
iand the total mean vectoru
are defined as:1
1 1
1 1
1 1 1
1 1
/
/
N i
j j N
j i i i
i N j j
i j
j j k N
i
j j k k N
i j i i
j k N
i i i j
j i j
p xu X p p Xp
p
p x
u X p p Xp
p
(5)
Wherepijis the element of vector
p
i.Next, to obtain the “generalized Rayleigh quotient” of semi-supervised LDA, the new between-class scatter matrix
S
b, within-class scatter matrixS
wand total-class scatter matrix matrixesS
t aredefined as 1 1 ( )( ) [ ( )( ) ] T
b i i i
i i T T
i T n n
k i k i bS u u u u
X p p p p X
XS X (6) where 1 N i j j n
i p .
1 1 1 1 ( )( ) [ ( )( ) ] k N i T
j j j
i j k N
i i i T T
j j j
i j T
w wS p x u x u
X p h p h p X
XS X i i (7) 1 1 1 1 ( - )( - ) [ ( - )( - ) ] k N i T
j j j
i j k N
i T T
j j j
i j T
t tS p x u x u
X P h p h p X
XS X
(8)
, 1, 0, j i i j else
h (9)
where i denotes the element subscript of vector
h
j.According to Eq.(6),(7) and (8) , the main difference between our method and supervised LDA is
that the definition of
n
i forS
bis changed and the weight pij is added toS
wandS
t.The higherclass i certainty of sample
x
j means larger pij and greater impact on the scatter matrixes. On thecontrary, a smaller pij means less impact on the scatter matrixes. This method effectively exploits the characteristic information of unlabeled samples and significantly reduces the impact of wrong classified samples. Thus, the scatter matrixes shows more accurate distribution of samples.
Since the new scatter matrixes have been proven to satisfy
S
t
S
b
S
w, any two scatter matrixes can be utilized to construct the “generalized Rayleigh quotient”. Generally, it is expressed in the following criterion asmax T b T w w
w S w
w S w (10)
WherewRd (k 1)is the projection matrix. Then,
w
can be calculated byb
wS w
S w
(11)The closed-form solution of
w
related to k-1 characteristic vectors ofS S
w-1 b.Kernel semi-supervised LDA
The above proposed semi-supervised LDA is a linear dimensional reduction method. In this part, it is extended to the nonlinear range by taking advantage of the kernel method. Firstly, the samples are mapped to the higher space: X ( )X F. By combining Eq. (6), (7) and (10), the new kernel objection function is derived as:
( ) ( ) max ( ) ( ) T T T T b w w
w X S X w
w X S X w (12) According to the relevant theory of the reproducing kernel Hilbert space, any solution
w
of (12) exists in the subspace expanded by all training samples. But when the labeled samples is insufficient, some unlabeled samples around the classification surface of SVM have small classcertainty. To reduce the influence of these unlabeled samples,w
is denoted by:1
( ) ( ) ( )
N
j j j
j
diag
s sw a p X X p a (13)
where 1 k s i i
p
P
comprehensively measures the reliability of training samples anda
is a vector.When the sample
x
j,
j
{1, 2
, }
N
is near the surface of SVM,s j
p is relatively small. That is, the
impact of
x
jin kernel process can be ignored, which ensures the stability of the kernel semi-supervisedLDA method.
Then the new kernel object function based on (12), (13) can be obtained as follows:
( ) ( ) ( ) ( ) ( ) ( )
( ) ( ) ( ) ( ) ( ) ( )
( ) ( )
( ) ( )
T s T T s
T s T T s
T s s
T s s
diag diag J diag diag diag diag diag diag
b w b wa p X X S X X p a
a p X X S X X p a
a p KS K p a
a p KS K p a
(14)
2.4 Classification
When reducing the dimension of test data, we can select supervised LDA or kernel semi-supervised LDA based on whether the data condition is linear. After the dimension reduction, the test data will be classified. There are several classifiers to be selected, such as SVM, random forest, nearest neighbor classifier (NNC) and so on. We adopts the NNC in this part because the training samples of the same class in the projection subspace are very close, which makes the mean vectors fully represent the characteristic information of every class. The mean vectors
u
iafter dimension reduction can be expressed asi
,
{1, 2
, }
T
i
i
k
u
w u
(15)Then the class of test sample is determined by the nearest
u
i. Clearly, because of its simplicity and strong feasibility, NNC is exactly suitable for the specialty of data in the projection subspace.3
Experiment
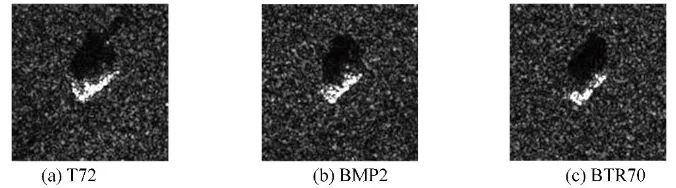
[image:7.595.134.472.356.450.2]In this section, the performance of the proposed method is investigated on the Moving and Stationary Target Acquisition and Recognition (MSTAR) database. The discussion of CCS is performed initially to demonstrate the feasibility of CCS-related steps. Subsequently, the effectiveness of the proposed method is verified by comparing CCS with other semi-supervised algorithms. As shown in Fig 3, we choose BMP2 (sn-c21), T72 (sn-132) and BTR70 (sn-c21) as the training data in the following experiments. Meanwhile, we select BMP2 (sn-c9566), T72 (sn-s7) and BTR70 (sn-c70) as the testing data. Table 1 lists the number of vehicles in the aforementioned data sets.
Fig 3. The SAR images of three classes of vehicles. (a) T72, (b) BMP2, and(c) BTR70
Table 1. Types and quantities of training data and testing data.
Training data Testing data
Type T72 BMP2 BTR70 T72 BMP2 BTR70
(model) sn_132 sn_c21 sn_c71 sn_s7 sn_9566 sn_c70
Quantity 232 232 232 191 191 191
3.1 Discussion of CCS
Fig 4. Classification performance of CCS with different dimension reduction method. KLDA-CCS and KPCA-KLDA-CCS represent the KLDA-CCS using KLDA and KPCA respectively.
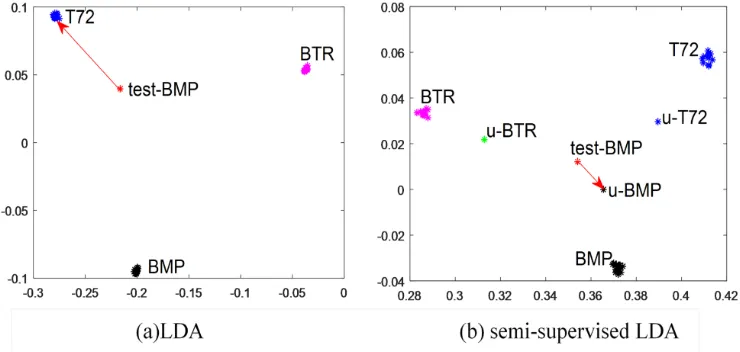
To demonstrate the effectiveness of semi-supervised LDA, we compare it with LDA which just utilizes labeled samples. As shown in Fig 5 (a), since test-BMP is closest to the mean vector of T72 samples, the classification result is mistaken. Different from LDA, semi-supervised LDA can represent the truer feature distribution of samples by absorbing the characteristic information of unlabeled samples. Meanwhile, different classes of samples are more separable and the test sample is closer to the right mean vector. As presented in Fig 5 (b), the test-BMP is obviously closest to the u-BMP and is correctly classified into BMP.
Fig 5. The dimension feature of three classes of labeled vehicles samples in LDA and
semi-supervised LDA. test-BMP represents a testing sample selected from the BMP vehicles, and
u-BMP,u-BTR,u-T72 denote the class mean vector and the direction of arrow represents the class judgment result of the test-BMP.
3.2 Comparison with other semi-supervised algorithms
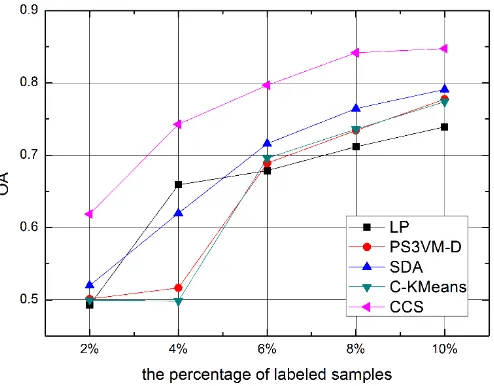
[image:8.595.122.492.419.595.2]Fig 6. Classification performance of CCS and the other four semi-supervised algorithms. Obviously, CCS outperforms the other four semi-supervised algorithms by at least 8% accuracy when the labelled samples are insufficient. Generally, LP and PS3VM-D assign pseudo labels to unlabeled samples. However, the wrong pseudo labels will cause a bad influence on subsequent classifier training process. In terms of the C-KMeans, it can’t make full use the spectrum information by adding constraints, which leads to little performance improvement. As for SDA, it focuses on maintaining the neighborhood relationship between samples, but has a high requirement of data distribution. Compared with the aforementioned four methods, CCS not only utilizes the class information of labeled samples, but also reliably absorbs the characteristic information of unlabeled samples through integrating the class certainty of samples into LDA, which makes the classification performance more stable and accurate.
4
Conclusion
To effectively solve the problem of RS images classification when labeled samples are insufficient, this paper proposes a novel semi-supervised classification method (CCS). There are three major findings: (a) Based on the dimensional reduction of training samples and multi-class SVM based learning, the class certainty information is obtained and assigned to unlabeled samples for further processing.
(b) For the unlabeled samples, the pre-processed class certainty respectively reassigns the weight for reliable data and unreliable ones by normalizing and threshold processing.
(c) By combining class certainty and kernel method, the semi-supervised LDA is extended to nonlinear dimensional reduction. The proposed LDA can make full use of class information of labeled samples while characterizing reliably unlabeled samples.
From the experiment results, we observe that the CCS significantly improves the classification accuracy of RS images especially when the labeled samples are insufficient.
5
REFERENCES
1. Zabalza J, Ren J, Zheng J, Han J. Novel Two-Dimensional Singular Spectrum Analysis for Effective Feature Extraction and Data Classification in Hyperspectral Imaging. Geoscience & Remote Sensing IEEE Transactions on. 2015;53(8):4418-33.
2. Zhao C, Li X, Ren J, Marshall S. Improved sparse representation using adaptive spatial support for effective target detection in hyperspectral imagery. International Journal of Remote Sensing. 2013;34(24):8669-84. 3. Bian X, Zhang T, Zhang X, et al. Clustering-Based Extraction of Near Border Data Samples for Remote Sensing
Image Classification[J]. Cognitive Computation, 2013, 5(1):19-31.
5. Cavallaro G, Mura MD, Benediktsson JA, Plaza A. Remote Sensing Image Classification Using Attribute Filters Defined Over the Tree of Shapes. IEEE Transactions on Geoscience and Remote Sensing. 2016;54(7):3899-911.
6. Zhong G, Yan S, Huang K, et al. Reducing and Stretching Deep Convolutional Activation Features for Accurate Image Classification[J]. Cognitive Computation, 2017(10):1-8.
7. Bovolo F, Bruzzone L, Carlin L. A Novel Technique for Subpixel Image Classification Based on Support Vector Machine. IEEE Transactions on Image Processing. 2010;19(11):2983-99.
8. Zhang S, Huang K, Zhang R, et al. Learning from Few Samples with Memory Network[J]. Cognitive Computation, 2017(4):1-8.
9. Shahshahani BM, Landgrebe DA. The effect of unlabeled samples in reducing the small sample size problem and mitigating the Hughes phenomenon. IEEE Transactions on Geoscience and Remote Sensing. 1994;32(5):1087-95.
10. Pasolli E, Melgani F, Tuia D, Pacifici F, Emery WJ. SVM Active Learning Approach for Image Classification Using Spatial Information. IEEE Transactions on Geoscience and Remote Sensing. 2014;52(4):2217-33. 11. Blum A, Chawla S, editors. Learning from Labeled and Unlabeled Data using Graph Mincuts. Eighteenth
International Conference on Machine Learning; 2001.
12. Blum A, editor Combining labeled and unlabeled data with co-training. Proceedings of the eleventh annual conference on Computational learning theory; 2000.
13. Joachims T. Transductive Inference for Text classification using Support Vector Machines. Bratko I, Dzeroski S, editors1999. 200-9 p.
14. Persello C, Bruzzone L. Active and Semisupervised Learning for the Classification of Remote Sensing Images. IEEE Transactions on Geoscience and Remote Sensing. 2014;52(11):6937-56.
15. Zhi-Hua Z, Ming L. Tri-training: exploiting unlabeled data using three classifiers. IEEE Transactions on Knowledge and Data Engineering. 2005;17(11):1529-41.
16. Zabalza J, Ren J, Yang M, Zhang Y, Wang J, Marshall S, et al. Novel Folded-PCA for improved feature extraction and data reduction with hyperspectral imaging and SAR in remote sensing. Isprs Journal of Photogrammetry & Remote Sensing. 2014;93(7):112-22.
17. Wang F, Zhang C, editors. Label propagation through linear neighborhoods2006.
18. Wagstaff K, Cardie C, Rogers S, Schr, Dl S, editors. Constrained K-means Clustering with Background Knowledge. Eighteenth International Conference on Machine Learning; 2001.