IAC-19-B4.3.10
Small Satellite Operations Planning for Agile Disaster Response using Graph Theoretical Techniques
Ciara N. McGratha*, Ruaridh A. Clarkb, Astrid Werkmeisterc, Malcolm Macdonaldd
a
Department of Mechanical and Aerospace Engineering, University of Strathclyde, 75 Montrose Street, Glasgow, G1 1XJ, United Kingdom, ciara.mcgrath@strath.ac.uk
bDepartment of Mechanical and Aerospace Engineering, University of Strathclyde, 75 Montrose Street, Glasgow,
G1 1XJ, United Kingdom, ruaridh.clark@strath.ac.uk
c
Department of Mechanical and Aerospace Engineering, University of Strathclyde, 75 Montrose Street, Glasgow, G1 1XJ, United Kingdom, astrid.werkmeister@strath.ac.uk
dDepartment of Mechanical and Aerospace Engineering, University of Strathclyde, 75 Montrose Street, Glasgow,
G1 1XJ, United Kingdom, malcolm.macdonald.102@strath.ac.uk
* Corresponding Author
Abstract
Agile, manoeuvrable, satellite constellations have the potential to fundamentally change space mission design by moving away from traditional missions, designed to address predicted demand, and instead providing responsive systems that can react to real-time events, such as natural disasters. The unique advantages of responsive constellations are enhanced by the use of small satellites, whose short development times and low cost can offset the increased risk and shorter mission life inherent in the use of manoeuvrable spacecraft. In addition, newly developed, highly efficient propulsion systems can provide small satellites with agile manoeuvrability. This could enable agile satellite systems where efficient, low-thrust, responsive manoeuvres can be used to ensure rapid flyover of targets on Earth. The authors have previously developed a fully analytical method of designing such manoeuvres, which allows consideration of multiple targeting options, each with different flyover times, view angles, and propellant requirements. However, a long-term, holistic understanding of the concept of operations is required to effectively implement an agile satellite system. To facilitate this, the existing analytical methodology has been combined with graph theoretical techniques to allow the complex trade-space to be perceived as a graph. The connections in the graph represent possible manoeuvres and are rapidly traversed to identify favourable routes to achieve the desired goal. The effect of changes in mission priorities can be assessed by reweighting the graph, avoiding the need to recalculate the manoeuvre options. This work demonstrates that the proposed method can be successfully used to plan sequential flyovers of a moving target; in this case, a tropical storm. For the small spacecraft and low-thrust propulsion system considered, the possible changes in flyover time for each target are small, however, these small adjustments can be used to significantly improve the quality of the obtained data compared to a non-manoeuvring spacecraft.
Keywords: Small satellites, CubeSats, graph theory, responsive space, Earth observation, disaster response.
1. Introduction
Tropical cyclones are large and powerful weather systems that cause billions of dollars of damage each year, not only in the coastal areas of the Atlantic but also in the Pacific. One of the most recent storms to cause devastating damage was Hurricane Dorian that arrived at the Bahamas in the beginning of September 2019. According to the National Emergency Management Agency (NEMA) [1], 50 people died in the Bahamas due to Hurricane Dorian and over 1300 people were still missing in mid-September 2019. Building and structural damages were estimated to be over $5 Billion [2]. These storms are devastating, but surprisingly they are still poorly understood. Scientists
can result in poor-quality, inconsistent, or even no data at critical times.
Manoeuvrable, agile, spacecraft could be used to provide responsive, on-demand coverage of time-critical events such as tropical storms. Small satellites, and in particular CubeSats, offer a unique advantage for such applications due to their low mass providing increased manoeuvrability. This manoeuvrability will be realised in the very near future due to the development of highly efficient propulsion systems for CubeSats [3]. By making use of efficient, low-thrust, manoeuvre strategies [4, 5], the time of flyover of a given target by a small satellite can be altered using small amounts of propellant. Such manoeuvres could be used in sequence to coordinate flyovers of a moving target, such as a tropical storm, that would improve the quality and quantity of the data available. However, such a scenario poses an operational challenge as manoeuvres selected early in the mission will impact the options that are available subsequently. As such, a method of operational planning is required that can consider a large number of possible manoeuvre sequences. To address this challenge, this work uses a fast, analytical method of manoeuvre calculation [6] to populate a graph with all possible manoeuvre options that complete the proposed mission. Searching through this graph, the optimal solution can be found and insights into the challenge of such operational planning can be gained. The result is a fast, efficient methodology that can be used to investigate and design effective concepts of operations for responsive missions.
2. Method
2.1 Problem Statement
The goal of the presented work is to establish an efficient method of planning sequential flyovers of a series of targets by a manoeuvrable, responsive, small spacecraft. It has been identified that considering and selecting each manoeuvre in isolation can lead to a sub-optimal overall mission [21]. As an illustrative example, consider Figure 1, in which the square represents a satellite that must flyover targets A and B (represented as ovals) in order. Let the arrows in Figure 1 represent possible manoeuvre options and the numbers represent the change in velocity, ΔV, required for each manoeuvre. For the purposes of this example assume that the operational goal is to flyover both targets while minimising the ΔV required. It is clear in this case that minimising the ΔV at each stage of manoeuvring in isolation will result in a sub-optimal overall solution, or even an inability to complete the mission. Indeed, in this example, choosing the highest ΔV manoeuvre for the first stage to flyover target A will minimise the ΔV required for the full scenario.
Figure 1: Scenario for sequential flyover of targets A then B from an initial system state, with each possible manoeuvre option represented by a single arrow. Numbers represent the ΔV required for each manoeuvre. The minimum ΔV path is shown in green [21].
2.2 Creating the Graph
In order to consider the full operational scenario for a spacecraft manoeuvring to provide coverage of a series of targets, it is helpful to represent the scenario as a graph with nodes representing possible target flyovers and edges representing the manoeuvres performed to obtain these flyovers. Each edge can be weighted according to the relevant manoeuvre parameters, such as ΔV, manoeuvre time, or a utility function containing numerous parameters. The nodes will capture the coverage parameters, such as view angle to target, and the satellite position. Using this method, the first node (node 0) will represent the location of the satellite at epoch.
Using the manoeuvre calculation method presented in Ref. [6], all possible manoeuvres to flyover the first target are calculated using the conditions at node 0 as the initial conditions. For the cases considered herein, the additional ΔV required for drag compensation is not calculated and included; this is because due to the short mission time considered in the case study, the overall contribution to the total ΔV cost will be very small. Once all possible manoeuvres are calculated they are added to graph as nodes and edges. These new nodes are then used as the starting conditions for calculating subsequent target flyover manoeuvres. This method is repeated for all targets, creating an expanding decision tree of manoeuvre options that is represented as a graph. Note that any method of manoeuvre calculation could be implemented here, however the speed of the general perturbation method presented in Ref. [6] makes it ideal for analysing problems with large numbers of manoeuvre options.
A
B A
A 1
3 5
B
B 10
[image:2.612.325.526.85.190.2]2.2 Analysing the Graph
Once the graph has been created, following the previously described methodology, it can be analysed to find the optimal combination of manoeuvres to fulfil the mission criteria. To aid the analysis, the graph can be reduced by removing any nodes and edges that fall outside a selection of operational criteria. For example, if there is a minimum required distance from the target to the edge of the field of view, then any nodes that do not meet this criterion and the paths that extend from these nodes can be removed from the search space. Similarly, if there is a maximum time that each manoeuvre must be completed in, then any edges that exceed this time can be removed.
Once the graph has been reduced, analysis on the scenario can be performed, for example, by applying Dijkstra’s algorithm [7] to find the shortest path through the graph. Weighting the edges of the graph according to the required manoeuvre ΔV will mean that Dijkstra identifies the combination of manoeuvres that will require the minimum total ΔV across all spacecraft manoeuvres.
3. Calculations
A case study is analysed to assess the ability of the presented method to provide an effective concept of operations for a responsive satellite system. The study focuses on providing repeated coverage of Typhoon Megi, a tropical cyclone that made landfall in the Philippines in 2010.
3.1 Tropical Cyclone Description
Typhoon Megi is one of the most intense tropical cyclones on record and occurred in the Pacific in 2010. This cyclone started developing on October 10, 2010 east-southeast of Guam (12.7°N 143.9°E). Moving west-north-westward, the tropical depression intensified into a tropical storm on the evening of October 13. The Joint Typhoon Warning Centre (JTWC) categorized Megi as a category 1 typhoon on October 15. Over the following two days, Megi intensified into a super typhoon and started moving west-southwest-wards. In the early morning of October 18 Megi made landfall over Luzon Island and immediately decreased to a category 2 typhoon. Shortly after, Megi turned northwards [8]. After intensifying again to a category 4 typhoon on October 21, Megi weakened again and made landfall in China on October 23 where it was downgraded to a tropical storm before completely dissipating on October 24.
The actual path of Typhoon Megi across the Pacific Ocean in 2010 is available from [9] and shown in Figure 3 for an 11 day period as the storm transitions from a tropical depression (TD), to a tropical storm (TS),
through to a typhoon of categories 1–5. The actual typhoon path is used to plan the manoeuvres to be undertaken by the spacecraft; it should be noted that in reality, only predictions of the storm’s path would be available to the mission planners, and the accuracy of these predictions would impact the system planning.
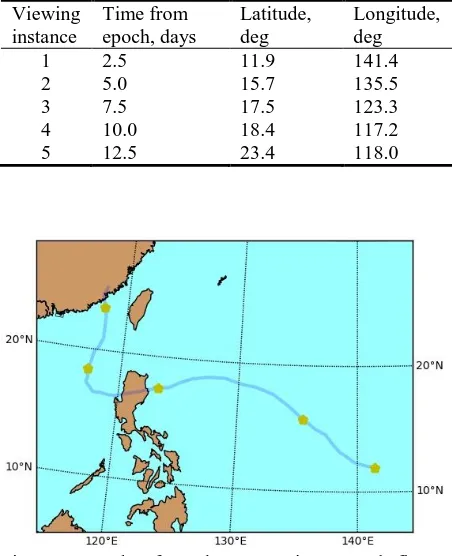
[image:3.612.314.540.244.522.2]In order to plan the manoeuvres, it was deemed desirable to have a flyover of the storm approximately every 2.5 days. The location of the tropical cyclone in 2.5 day intervals is shown in Table 1 and Figure 2, with the first viewing instance located at, and timed to coincide with, the instance of tropical storm formation.
Table 1. Typhoon Megi’s location at 2.5 day intervals Viewing
instance
Time from epoch, days
Latitude, deg
Longitude, deg
1 2.5 11.9 141.4
2 5.0 15.7 135.5
3 7.5 17.5 123.3
4 10.0 18.4 117.2
5 12.5 23.4 118.0
Figure 2: Path of Typhoon Megi; targeted flyover locations are marked with a yellow star.
3.2 Spacecraft Description
The spacecraft chosen for the case study is a 3U CubeSat equipped with an electrospray propulsion system, such as that developed by the Massachusetts Institute of Technology [10, 11]. The field of view (FOV) of the satellite is assumed to be conical, with the diameter of the FOV arbitrarily selected as 200 km. These spacecraft parameters are given in Table 2.
Table 2. Spacecraft physical parameters
Parameter Value Unit
Mass 4 kg
Thrust 0.35 mN
[image:4.612.72.297.166.240.2]FOV diameter 200 km
Table 3. Spacecraft orbit parameters
Parameter Value Unit
Altitude 703 km
Inclination 40 deg
Right ascension of the ascending node at epoch
0 deg
Argument of latitude at epoch 0 deg
Table 4. Simulation constants
Parameter Value Unit
Mean Earth radius 6371 km
Earth rotation rate 7.29212 × 10⁻⁵ rad/sec Coefficient of the
Earth’s gravitational zonal harmonic of the second degree
0.0010827 -
Earth’s standard gravitational parameter
3.986× 10¹⁴ m3/s2
Flattening factor of Earth
0.00335281 -
3.2 Manoeuvre Calculations
In order to provide regular coverage of typhoon Megi, the desired flyover interval is 2.5 days. For each proposed flyover time, a +/- 20 hour viewing window is imposed. The analysis ensures that the manoeuvre finishes over the target within this viewing window, and that the spacecraft will not begin its next manoeuvre until the end of this window; this allows for the fact that, in reality, the exact location of the storm will not be known but that it can be predicted with some error bound. All manoeuvres are calculated using the method outlined in Ref. [6] for ΔV values ranging from 0 to 15 m/s at 0.5 m/s intervals.
A graph of all possible manoeuvre options, for reaching the targets, is created as described in Section 2. In the case that no flyovers of a target are possible, that target is skipped and instead manoeuvres to fly over the next target are calculated. In this case, an assumption is made that the manoeuvres would start immediately following the last successful viewing; this allows for increased manoeuvre efficiency due to the increased length of time available for the manoeuvre. Weighting the graph by ΔV cost and using Dijkstra’s algorithm, the minimum path through the graph can be identified, which corresponds to the minimum ΔV solution that can
fulfil the mission criteria. If multiple options exist with the same minimum ΔV cost, they can be further assessed using additional criteria. In this case, the option with the minimum average distance to the target across all views is selected.
Once the operational manoeuvre sequence has been selected, it is then propagated from epoch to mission end using a fixed step integrator with a 1 second time step to calculate the full spacecraft path throughout the mission. This is done using general perturbation methods based on the Gauss equations and including perturbations due to the Earth’s oblateness to the second order (J2) only. This propagation is used to identify all
flyovers of the tropical storm; those that have been planned as part of the manoeuvre sequence, as well as those incidental flyovers that occur during and between manoeuvres.
3.3 Image Assessment
Once the predicted flyovers have been calculated, the quality of the possible coverage of the storm must be assessed. For the purposes of analysing tropical storms, the eye of the storm is the most crucial feature, as an image in which the eye is visible in its entirety is required for wind field retrieval with SAR. The eye serves as a reference point to determine wind directions, which are estimated from the wind’s imprint on the ocean surface [13, 14]. As such, for this work, only flyovers in which the eye would fall entirely within the satellite FOV are considered to be usable. In the case of
Typhoon Megi, the eye had a diameter of approximately 15 nautical miles (28 km) [8]; as such, for an image to be usable the centre of the eye must be located at least 14 km from the edge of the image. As the diameter of the eye can vary over time, a minimum distance of 20 km from the edge of the image will be used in this case.
4. Results and Discussion
4.1 Actual satellite coverage of Megi in 2010
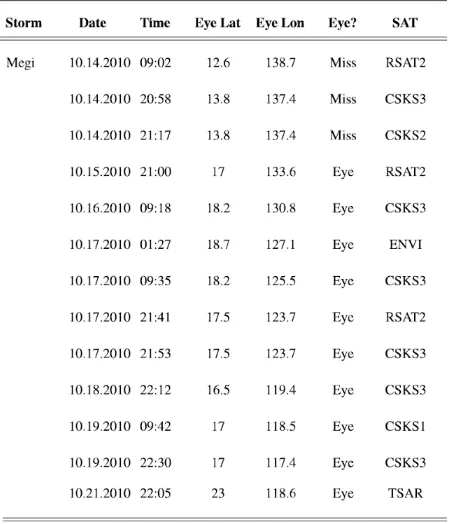
[image:4.612.71.300.275.404.2]Table 5 details the time of each image taken, the location of the storm eye at that time, and indicates whether the eye was visible (“Eye”) in the image, or not (“Miss”). Also indicated in Table 5 are the satellites that provided each image. It can be seen that five satellites (RADARSAT-2 {RSAT2} [16], COSMO SkyMed 1 and 3 {CSKS} [17], ENVISAT {ENVI} [18], and TerraSAR-X {TSAR} [19]) contributed to the collection of ten usable images (i.e. storm eye in view) over the duration of the storm. Figure 3 shows these ten images overlaid on the path of Typhoon Megi. It is of note that although the images provide comprehensive coverage of the area traversed by the storm, each of the images is only a snapshot in time providing a single image of the eye at a single location. Also of note is that the images are not evenly distributed in time; no images were available on the 20th of October, whereas four images were taken on the 17th, two of which are within 15 minutes of each other.
4.2 Coverage from non-manoeuvring spacecraft
Before considering active manoeuvring, an analysis is performed to assess the coverage that would naturally be provided by the spacecraft in the case that it did not manoeuvre. For this analysis, a spacecraft with the parameters given in Tables 2 and 3 is propagated for 13.5 days from epoch using the fixed step integrator described in Section 3.2.
The natural flyovers that would occur in this case are shown in Figure 4. The details for each of these flyovers are given in Table 6. In this case there are five natural flyovers but, assuming a 200 km diameter field of view, only one of these would have the eye of the storm fully in view.
[image:5.612.312.544.66.569.2]Figure 3: Path of Typhoon Megi showing actual imagery collected from 6 static spacecraft [20].
Table 5. Images obtained of Typhoon Megi
[image:5.612.319.544.98.360.2] [image:5.612.314.543.409.569.2] [image:5.612.70.296.495.634.2]Table 6. Flyovers by non-manoeuvring spacecraft
Date Time Eye latitude,
deg
Eye longitude, deg
Distance of eye from centre of FOV, km
Eye in view?
12/10/2010 13:20 11.9 141.4 73 Yes
14/10/2010 12:58 13.2 138.5 90 No
17/10/2010 22:01 17.5 123.6 95 No
19/10/2010 21:38 17.1 117.4 92 No
23/10/2010 19:10 25.0 118.0 83 No
4.3 Coverage from manoeuvring spacecraft: 200 km
FOV
A manoeuvring spacecraft with up to 15 km ΔV available for each manoeuvre and a 200 km diameter field of view is analysed using the method described in Sections 2 and 3. This results in a graph with almost individual 5000 manoeuvre options. For these constraints, there are no possible manoeuvre sequences that can overfly all five targets as listed in Table 1 and Figure 2; in all cases the second target at 5 days from epoch is missed. This highlights the limitations of such techniques when using a single spacecraft with low-thrust propulsion, and indicates a need for increased thrust, to increase manoeuvrability, or the use of additional, cooperative spacecraft working towards the same goal.
Using Dijkstra’s algorithm [7], two manoeuvre sequences are identified as minimum ΔV paths that provide flyovers of four out of the five targets; these sequences each require 13.5 m/s ΔV. From these, the manoeuvre sequence with the minimum average distance to the target at flyover is selected and propagated from epoch to mission end to assess the actual number of flyovers and their quality.
[image:6.612.314.540.181.357.2]The flyovers that would occur in this case are shown in Figure 5, where red markers indicate targeted flyovers at the desired times and locations as listed in Table 1, while blue markers indicate incidental flyovers that occur during or between manoeuvres. The details for each of these flyovers are given in Table 7. In this case there are five flyovers and, assuming a 200 km diameter field of view, four of these five flyovers would have the eye of the storm fully in view. It is of note that the change in the times of viewing when compared with the non-manoeuvring case are relatively small (0 to 6 minutes in all cases), however this can give a significant change in the distance of the target from the centre of the image (up to 93 km difference in the case of the flyover on the 17/10/2019).
Figure 5: Path of Typhoon Megi showing flyovers available from manoeuvring spacecraft with 200 km field of view.
4.4 Coverage from manoeuvring spacecraft: 200 km
FOV with reduced graph based on distance
Figure 6: Path of Typhoon Megi showing flyovers from manoeuvring spacecraft with target within 80 km of centre of image and 200 km field of view.
5. Conclusions
General perturbation methods can be used to define manoeuvres for a spacecraft to flyover a moving target. Analysing a variety of possible sequential manoeuvres using a graph can allow for efficient manoeuvre sequences to be identified that will fulfil the required objective. Reducing the graph based on node parameters or edge weightings can allow for changes in mission requirements or parameters to be rapidly assessed without the need to recalculate individual manoeuvres.
For a small spacecraft equipped with a low-thrust propulsion system, significant improvements in the quality of flyovers, and hence the data collected, could be achieved through the use of targeting manoeuvres. However, these results also indicated that using multiple spacecraft, or higher thrust systems, may be required to significantly increase the number of target flyovers.
Acknowledgements
[image:7.612.70.550.400.507.2]This research was supported by the Air Force Office of Scientific Research (AFOSR) [grant number FA9550-18-1-0147], and the presentation at this conference was supported by the the Institution of Engineering Technology (IET) Travel Awards.
Table 7. Flyovers by manoeuvring spacecraft with 200 km diameter field of view Date Time ΔTime from
non-manoeuvring, mins
ΔV for manoeuvre, m/s
Eye latitude, deg
Eye longitude, deg
Distance of eye from centre of FOV, km
Eye in view?
12/10/2010 13:20 0 1.0 11.9 141.4 83 No
14/10/2010 12:57 -1 - 13.2 138.5 67 Yes
17/10/2010 21:55 -6 5.0 17.5 123.6 2 Yes
19/10/2010 21:32 -6 0.5 17.1 117.4 5 Yes
23/10/2010 19:08 -2 7.0 25.0 118.0 58 Yes
Table 8. Planned flyovers by manoeuvring spacecraft with 200 km diameter field of view and target within 80 km of image centre.
Date Time ΔTime from
non-manoeuvring, mins
ΔV for manoeuvre, m/s
Eye latitude, deg
Eye longitude, deg
Distance of eye from centre of FOV, km
Eye in view?
12/10/2010 13:21 +1 0.5 11.9 141.4 68 Yes
14/10/2010 12:57 -1 - 13.2 138.5 78 Yes
17/10/2010 21:54 -7 7.0 17.5 123.6 19 Yes
19/10/2010 21:31 -7 1.0 17.1 117.4 19 Yes
[image:7.612.70.548.554.662.2]References
[1] Bahamas National Emergency Management
Agency (NEMA), 2019,
http://www.bahamas.gov.bs/nema, (accessed 09/09/2019).
[2] “Hurricane Dorian Flash Estimate”, https://www.karenclarkandco.com/news/publications/ year/2019/Hurricane-Dorian-Flash-Estimate.html, (accessed: 19/09/2019).
[3] Tummala, A., and Dutta, A. “An overview of cube-satellite propulsion technologies and trends,” Aerospace Vol. 4, No. 4 (2017) pp.58.
doi: 10.3390/aerospace4040058
[4] Co, T. C., Zagaris, C., and Black, J. T. “Responsive Satellites Through Ground Track Manipulation Using Existing Technology,” Journal of Spacecraft and Rockets Vol. 50, No. 1 (2013) pp. 206-216.
doi: 10.2514/1.A32263
[5] Cerf, M. “Low-thrust transfer between circular orbits using natural precession,” Journal of Guidance, Control, and Dynamics Vol. 39, No. 10 (2015) pp. 2232-2239.
doi: 10.2514/1.G001331
[6] McGrath, C. N., and Macdonald, M. “General Perturbation Method for Satellite Constellation Reconfiguration Using Low-Thrust Maneuvers,” Journal of Guidance, Control, and Dynamics Vol. 42, No. 8 (2019) pp. 1676-1692.
doi: 10.2514/1.G003739
[7] Dijkstra, E. W. “A note on two problems in connexion with graphs,” Numerische mathematik Vol. 1, No. 1 (1959) pp. 269-271.
[8] “Typhoon 15W (Megi) Warning NR028,” National Oceanic and Atmospheric Administration
(NOAA), 2013,
http://www.webcitation.org/5tbqF6Ntz. (accessed: 26/12/2013).
[9] “Best Track Data,” Regional Specialized
Meteorological Centre,
http://www.rsmcnewdelhi.imd.gov.in, (accessed: 01/02/2019).
[10] Krejci, D., Mier-Hicks, F., Thomas, R., Haag, T., and Lozano, P. “Emission Characteristics of Passively Fed Electrospray Microthrusters with Propellant Reservoirs,” Journal of Spacecraft and Rockets, Vol. 54, No. 2 (2017) pp. 447-458.
doi: 10.2514/1.A33531
[11] Krejci, D., Mier-Hicks, F., Fucetola, C., and Lozano, P. “High efficiency ionic liquid electrospray propulsion for Nanosatellites,” 67th International Astronautical Congress, Guadalajara, Mexico, 2016.
[12] “Historical Hurricane Tracks,” National Oceanic and Atmospheric Administration (NOAA), https://coast.noaa.gov/hurricanes, (accessed: 01/02/2019).
[13] Horstmann, J., Wackerman, C., Falchetti, S., and Maresca, S. “Tropical cyclone winds retrieved from synthetic aperture radar,” Oceanography Vol. 26, No. 2 (2013) pp. 46-57.
doi: www.jstor.org/stable/24862035
[14] Werkmeister, A., Graber, H., Foster, R., and Romeiser, R. “Tropical cyclone boundary layer rolls derived from SAR,” IEEE International Geoscience and Remote Sensing Symposium (IGARSS), 2015, pp. 2526-2528.
doi: 10.1109/IGARSS.2015.7326325
[15] “RADARSAT-2 Price list,” MDA Corporation,
https://mdacorporation.com/docs/default- source/product-spec-sheets/geospatial-services/pricelist.pdf?sfvrsn=12&sfvrsn=12, (accessed: 19/09/2019).
[16] Morena, L., James, K., and Beck, J. “An introduction to the RADARSAT-2 mission,” Canadian Journal of Remote Sensing Vol. 30, No. 3 (2004) pp. 221-234.
doi: 10.5589/m04-004
[17] Covello, F., Battazza, F., Coletta, A., Lopinto, E., Fiorentino, C., Pietranera, L., Valentini, G., and Zoffoli, S. “COSMO-SkyMed an existing opportunity for observing the Earth,” Journal of Geodynamics Vol. 49, No. 3-4 (2010) pp. 171-180.
doi: 10.1016/j.jog.2010.01.001
[18] Louet, J., and Bruzzi, S. “ENVISAT mission and system,” IEEE International Geoscience and Remote Sensing Symposium (IGARSS), 1999, pp. 1680-1682.
doi: 10.1109/IGARSS.1999.772059
[19] Pitz, W., and Miller, D. “The TerraSAR-X satellite,” IEEE Transactions on Geoscience and Remote Sensing Vol. 48, No. 2 (2010) pp. 615-622. doi: 10.1109/TGRS.2009.2037432
[20] Werkmeister, A., Romeiser, R., and Graber, H. “Significant waveheight retrieval from SAR imagery in Typhoon Megi.” IEEE International Geoscience and Remote Sensing Symposium (IGARSS), 2017, pp. 1542-1545.