Current blockage and extreme forces on a jacket model in focussed
wave groups with current
H. Santoa,1,∗, P. H. Taylorb, A. H. Dayc, E. Nixonc, Y. S. Chooa
a
Centre for Offshore Research & Engineering, Department of Civil and Environmental Engineering, National University of Singapore, Singapore 117576, Singapore
b
Department of Engineering Science, University of Oxford, Oxford OX1 3PJ, United Kingdom
cDepartment of Naval Architecture, Ocean and Marine Engineering, University of Strathclyde, Glasgow G4 0LZ, United Kingdom
Abstract
This paper documents large laboratory-scale measurements of hydrodynamic force time histories
on a realistic 1:80 scale space-frame jacket structure exposed to combined waves and in-line current.
The aim is to investigate the fluid flow (and the associated hydrodynamic force) reduction relative
to ambient fluid flow due to the presence of the jacket structure as an obstacle array, interpreted
as wave-current blockage. Transient focussed wave groups, and embedded wave groups in a smaller
regular wave background are generated in a towing tank, and the jacket is towed under
differ-ent speeds opposite to the wave direction to simulate wave loading with differdiffer-ent in-line uniform
currents. The measurements are compared with numerical predictions using Computational Fluid
Dynamics (CFD), with the actual jacket represented in a three-dimensional numerical wave tank
as a porous tower modelled as a uniformly distributed Morison stress field. Good agreement is
achieved, both in terms of incident surface elevation as well as total force time histories, all using a
single set of Morison drag (Cd) and inertia (Cm) coefficients. Substantial force reduction is observed
under transient large crest relative to prediction from the present industry design guideline with
the same Morison coefficients. We demonstrate the generality of our findings: without influence of
Keulegen-Carpenter (KC) number effect, a single invariant set ofCd andCmis all that is required
to numerically explain and reproduce the measured total force time histories on a realistic jacket
model for a large range of wave heights and non-zero current speeds.
∗Corresponding author. Tel: +65 6516 6853. Fax: +65 6779 1635 Email address: [email protected] (H. Santo)
1Present address: Office of the Deputy President (Research and Technology), National University of Singapore,
Keywords: Morison fluid loading, wave-current blockage, porous block simulation
1. Introduction 1
The hydrodynamic forces on a single cylinder and arrays of cylinders have been studied
exten-2
sively in the past. Many studies have considered periodic waves only without current (or periodic
3
oscillation without steady flow), whilst some examined the effect of waves and steady current
simul-4
taneously, see e.g. Sarpkaya and Isaacson (1981), Sarpkaya et al. (1984), Heideman and Sarpkaya
5
(1985), Rodenbusch and K¨allstr¨om (1986), Allender and Petrauskas (1987), Reed et al. (1990), and
6
Chaplin et al. (1992). Large scatter in the Morison drag and inertia coefficients (Cd and Cm) is
7
observed, and no general conclusions have been drawn, because of the complexity of the problem
8
due to the presence of a current interacting with waves and the structure. In this paper, we propose
9
that a solution to the problem can be obtained by looking at realistic flow around a geometrically
10
complicated space-frame jacket model; at least in terms of the overall loads on the entire structure.
11
This model is a realistic representation of a typical oil and gas production platform for intermediate
12
water depth and harsh ocean environment. It is made of multiple cylinders arranged in different
13
orientations, and it is subjected to transient wave groups and regular waves, all with steady uniform
14
current present.
15
It should be noted that the estimation of loads on space-frame structures as a topic has not
16
been an active area of research over the last few decades. Allender and Petrauskas (1987) measured
17
the peak forces on a complete 3 m high model of a Gulf of Mexico platform in regular waves
18
and current in a very large wave tank. They observed what we interpret as significant
wave-19
current blockage for a wide range of regular wave heights and steady tow speeds. In terms of the
20
standard design methodology (see API 2000), they reported the necessity to use a lower value for
21
the Morison drag coefficientCd of 0.7−0.8 to fit the measured peak forces for waves with in-line
22
current. In contrast, a Cd of 1.3−1.6 was required for regular waves with no current. These
23
important but apparently little known observations prompted us to re-visit the whole problem of
24
the hydrodynamics of flow through space-frame structures. Whilst framed in terms of fixed jackets,
25
this flow-structure interaction problem is obviously relevant to deepwater compliant towers, jack-up
26
rigs and, most recently of practical importance, the lightweight space-frames being used to support
27
large offshore wind turbines.
This paper extends our research of current blockage on statically-responding (fixed
bottom-29
founded) offshore structures. The presence of such structures can be treated as obstacle arrays,
30
which provide resistance to the incident wave and current flow on the structures. Hence, reduction
31
in the flow and the associated hydrodynamic force is observed. This phenomenon has been reported
32
as current blockage. The first provision to the standard offshore industry design codes, such as API
33
(American Petroleum Institute, 2000), was due to the work by Taylor (1991), which improves the
34
Morison equation (Morison et al., 1950). This accounts only for flow reduction due to steady
35
current flow. Recent studies by Taylor et al. (2013) analytically demonstrated the additional flow
36
reduction from regular waves on top of steady current, and this has been validated extensively in
37
both experiments as well as numerical simulations using Computational Fluid Dynamics (CFD),
38
see Santo et al. (2014a,b, 2015, 2017).
39
Moving on from an idealised regular wave which is simply periodic in form, we consider in this
40
paper the effect of transient and non-periodic waves which are more representative of large waves
41
on the open sea. To model the transient effect, we consider focussed wave groups, and to account
42
for the presence of large waves in an on-average smaller sea-state, we embed these focussed wave
43
groups within a smaller regular wave background. We then examine the total force time histories on
44
a realistic jacket model obtained from laboratory-scale measurements conducted in a large towing
45
tank. We also assess and compare the force time histories from CFD results, with the actual
46
jacket represented in a three-dimensional numerical wave tank as a porous tower modelled as a
47
uniformly distributed Morison stress field. We also compare the predictions using the present API
48
recommended practice and our novel porous tower modelling approach which accounts for
wave-49
current blockage effects, all with the measurements taken as the reference. For force prediction,
50
the industry approach in the past required calibrating the MorisonCd andCmusing the open sea
51
fluid kinematics without otherwise taking into account the presence of the structure. The present
52
industry approach (such as API) has started to account for the presence of the structure due to
53
steady flow (current blockage effects), but not the complete wave-current blockage effects. We will
54
show that this present approach is incapable of producing the experimentally measured force time
55
histories, and in general will result in a scatter in Cd. On the other hand, using our proposed
56
approach, the complete measured force time histories for almost all cases with current can be
57
reproduced using a single and consistent set ofCd andCm.
Carriage
Beach Wavemakers
76 m
4.6 m
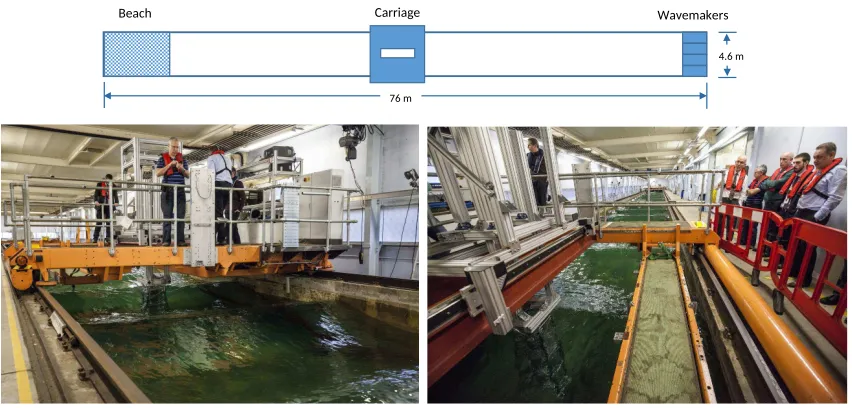
Figure 1: Top panel shows the plan view of the towing tank facility (not to scale). Bottom panel shows two
photographs of the tank. Left photograph depicts the carriage with the jacket model underneath when viewed in a
downstream direction along the tank where a regular wave train is incident onto the jacket model. Right photograph
shows a closer look at the carriage and the jacket model when viewed in an upstream direction along the tank.
Photographs courtesy of Y. S. Choo.
2. Experimental and numerical setup 59
These experiments were conducted in the towing tank of the Kelvin Hydrodynamics Laboratory,
60
University of Strathclyde, Glasgow. This is 76 m long, 4.6 m wide and 2.5 m deep. The tank is
61
equipped with four paddles of Edinburgh Design Limited (EDL) ‘flap-type’ wavemakers with
force-62
feedback at one end, and a sloping beach acting as a passive absorber at the other end. In the
63
experiments, linear wave generation was used. A self-propelled carriage runs along the longitudinal
64
direction of the tank. Figure 1 shows a plan view as well as two photographs of the towing tank
65
facility.
66
A 1:80 jacket model was hung below the carriage, which was moved at constant speed along the
67
tank to simulate uniform current, and the model was exposed to a range of focussed wave groups.
68
Figure 2 shows a photograph of the jacket model with three of the authors (left), and a 3D CAD
69
model of the jacket with relevant geometric information (right). Being made of stainless steel, the
70
jacket model resembles a typical second generation North Sea 4-legged jacket structure. It stands
71
at 1.74 m tall and weighs around 50 kg in the air. The cross-section of the jacket at the top is 0.39
[image:4.595.94.520.142.346.2]Figure 2: Left photograph shows the jacket model with three of the authors. Right picture shows a 3D CAD model
of the jacket with relevant geometric information.
m×0.34 m, and at the bottom is 0.60 m×0.34 m. The jacket is tapered when viewed end-on and
73
rectangular broadside. Four large cylindrical hollow members (or pipes) with a diameter of 38.2 mm
74
(1.5”) form the jacket legs. Additional smaller pipes with a diameter of 16 mm form the diagonal
75
bracings and the vertical conductor pipes, with 24 conductors in total. These run the full height
76
of the jacket. Square hollow members with cross section of 20 mm×20 mm are used as conductor
77
support frames at each horizontal level. These are supported on horizontal bracings at each end-on
78
face of the jacket instead of extending from the jacket legs within the jacket (as commonly found
79
in actual offshore jackets) to ease the model fabrication process. In these experiments, only the
80
end-on configuration was tested, as this will provide more blockage and a more severe test of the
81
modelling.
82
The jacket was suspended from the carriage such that the still water level is at 0.12 m below
83
the centre of the top X-brace, or a distance of 1.33 m up from the jacket base. This is necessary to
84
ensure the largest crest do not hit the top support frame. The water depth in the tank was 1.8 m, so
85
there was a gap of 0.47 m between the base of the jacket model and the floor of the tank. The jacket
model was suspended so that the total horizontal hydrodynamic load could be measured directly by
87
a force transducer, eliminating any ambiguity in the horizontal forces since any bending moments
88
are taken directly by the vertical elements of the support frame. This high quality measurement
89
is made possible by having a parallel pendulum arrangement (or inverted table) for the mounting
90
frame connected to the jacket model, and this was hung below the rigid frame attached on the
91
towing carriage. The force transducer was rated at 50 kg (490 N) and sampled at 7143 Hz. A
92
resistance-based wave probe, sampled at the same rate as the force transducer, was mounted from
93
the towing carriage midway between the jacket model and the side of the tank to provide phase
94
information of the incident waves.
95
A set of 43 Fourier wave components was generated at the paddles according to a
JONSWAP-96
shaped amplitude spectrum truncated at 1 Hz, with the frequency of the peak spectral energy
97
at 0.52 Hz and a linear crest amplitude of 0.22 m at focus. The water depth was set at 1.8 m.
98
Downstream in the tank, the wave group was arranged to focus when the crests of the Fourier
99
components all came into phase at a single position in space and time (constructive interference).
100
As well as an isolated focussed wave group, an embedded focussed wave within a smaller regular
101
wave background was also considered, see for instance Figure 6 (bottom left). This is intended to
102
model an extreme wave packet within an irregular wave sea-state, since the largest wave in a random
103
sea is likely to be a member of a group of large waves. Regular waves were used as the background in
104
this experiment since wave-current blockage in regular waves has been examined previously, see e.g.
105
Santo et al. (2015, 2017). Three sets of regular wave with wave heights of 0.1 m, 0.13 m and 0.15 m
106
were used for the embedding process, all with wave frequency at 0.52 Hz. The same focussed wave
107
components were used, but with reduced linear amplitude depending on the height of the regular
108
wave background such that the amplitude of the embedded wave group matches that of the focussed
109
wave group (0.22 m), at least on the basis of linear superposition. In the tank, the embedded wave
110
groups interacted with the background wave and the actual focus location was shifted downstream,
111
as consistent with Figure 7. Hence, with the background present, the embedded wave groups were
112
not perfectly focussed (defined as having a horizontal symmetry between the adjacent troughs either
113
side of the largest crest in time). This does not present significant difficulties for the comparison
114
between the physical experimental forces and the CFD predictions, as iteration was used to ensure
115
a good match between the measured and predicted incident waves at the model.
116
Measurements were conducted for three different towing speeds: 0, 0.14 and 0.28 m/s.
−5 0 5 −0.2
−0.1 0 0.1 0.2 0.3
Time (sec)
η
(m)
Mean Mean + 2SD Mean − 2SD
−5 0 5
−50 0 50 100 150 200 250
Time (sec)
Total Force (N)
[image:7.595.96.518.144.264.2]Mean Mean + 2SD Mean − 2SD
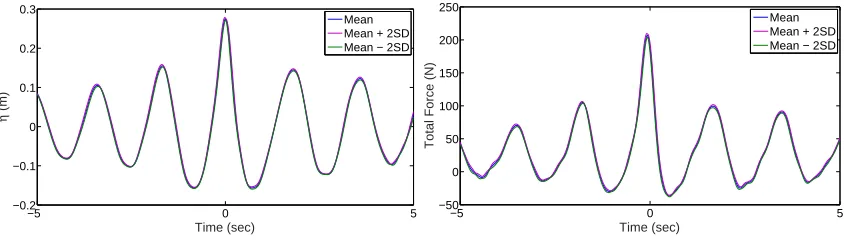
Figure 3: Comparison of repeatability in the measurement of surface elevation (left) and total force (right) time
histories, all plotted in terms of mean and mean±2 standard deviations.
nisation between the wave paddle and the carriage motion was carefully accounted for to ensure that
118
the jacket model towed under different speeds meets the same wave group at the right place and at
119
the right time. Five repeated tests were conducted for selected cases to quantify the repeatability of
120
the system. Figure 3 presents an example of the case of 180◦phase-shifted embedded focussed wave
121
in 0.15 m regular wave background with 0.28 m/s current. The measurements of surface elevation
122
are plotted on the left and total force on the right. Analysis on repeatability reveals that the root
123
mean square error for surface elevation is 0.2 cm (with a peak value of 27 cm), and that for total
124
force is 1.6 N (with a peak of 207 N), suggesting that the measurements are repeatable.
125
The numerical setup is similar to that reported by Santo et al. (2015) and Santo et al. (2017),
126
using the same porous tower modelling approach with uniformly distributed embedded Morison
127
stresses. In essence, the stresses are distributed over the tower but expressed using the local
128
(disturbed) flow kinematics, thus accounting for the global presence of the structure. Similar work
129
has been conducted on characterising resistance based on drag and Morison equations in related
130
fields, see e.g. Kristiansen and Faltinsen (2012), Zhao et al. (2013), and Chen and Christensen
131
(2016).
132
The simulations were performed with the open source CFD code OpenFOAMR
(http://www.openfoam.com)
133
and the numerical wave tank formulation ‘waves2Foam’ developed by Jacobsen et al. (2012). All
134
the simulations are performed in two-phase flow (air and water) by solving the Reynolds-averaged
135
Navier-Stokes equations coupled with the continuity equation for incompressible flows, and with
136
an additional momentum sink term to account for the effect of the porous tower in the numerical
simulation. The governing equations are written as:
138
∇ ·u= 0 (1)
139
∂ρu
∂t +∇ ·[ρuu
T] =−∇p∗+∇ ·[µ∇u+ρτ]−S+ [−(g·x)∇ρ+σTκγ∇γ] (2)
whereρis the fluid density, gis the acceleration due to gravity,u= (u, v, w) is the fluid velocity
140
field in Cartesian coordinates,p∗ is the pressure in excess of hydrostatic pressure, defined asp∗ =
141
p−(g·x)ρ,µis the dynamic viscosity,x= (x, y, z) is the local Cartesian coordinates, andτ is the 142
specific Reynolds stress tensor. The free surface (interface between air and water) is tracked using
143
Volume-of-Fluid (VOF) method, with an interface value ranging from 0 to 1 (0 for pure air, 1 for
144
pure water, and a mixture in between). In the numerical simulation, the interface value of 0.5 and
145
greater is treated as the water phase. For more details of the interface treatment, see Berberovi´c
146
et al. (2009).
147
A sink term is used to account for momentum lost from the flow, which in the case of a simple
148
homogeneous porous tower can be written as:
149
S= 1
2ρFu|u|+C ′
m ∂ρu
∂t (3)
where F is the Forchheimer resistance parameter and C′
m is the equivalent of the local Morison
150
inertia coefficient,Cm, but here defined in the porous tower context.
151
A porous tower having the same physical dimensions, the amount of resistance and the added
152
mass of the actual jacket is modelled. Following Santo et al. (2014a, 2015), the following relationship
153
holds for the calibration ofF andC′
m: CdA/Af =F L, and Cm′ =CmV /VP, whereA andAf are
154
the solid drag area and the frontal area of the actual jacket model, respectively,Lis the downstream
155
length of the jacket model as well as the porous tower,V is the displaced volume of the elements in
156
the jacket model, andVP =Af ×Lis the volume of the porous tower. Cmis the Morison inertia
157
coefficient, and Cd is the drag coefficient. The actual total values of A, Af and V compatible
158
for use in the standard Morison formulation are 1.17 m2, 0.57 m2, and 0.024 m3, respectively, all 159
measured from the bottom of the model up to 0.25 m above still water level. Hence, both Land
160
Vp of the porous tower are based on the actual geometry of the jacket model. The entire resistance
161
of the jacket is vertically split into two blocks of uniformly distributed resistance in the numerical
162
porous tower (with a smaller block around the free-surface spanning from the largest crest to the
deepest trough, and a larger block stacked underneath). The sensitivity of the resulting forces to
164
such an arrangement was checked by comparing the results to those for three blocks of resistance.
165
The integrated total force on the tower is very similar, suggesting that the arrangement is robust.
166
One-way information transfer (coupling) was developed to enable the full 3D simulations of
167
focussed wave interacting with the porous tower to run using a reasonable amount of computing
168
resource, otherwise simulating the entire 3D domain would be much more computationally
expen-169
sive. The flow kinematics upstream of the focus location was sampled at small time intervals from
170
a 2D simulation of undisturbed kinematics (2D in a vertical plane, so without the presence of the
171
porous tower), and this was subsequently fed into a truncated 3D domain simulation of disturbed
172
kinematics (with the porous tower in place). Linear interpolation was used for the flow kinematics
173
between each sampled time interval. The truncated domain has the same width and depth as the
174
physical towing tank, but the length is limited to 4λp, inclusive of 1λp for the outlet relaxation
175
zone to minimise wave reflection, whereλp is the wavelength at peak wavenumber (∼5.5 m). The
176
sensitivity of the results to this distance was investigated by a comparison with those from a domain
177
with length of 5λp inclusive of 2 λp for outlet relaxation, and the same surface elevation profiles
178
around the location of the tower are obtained. A mesh resolution of 0.025 m×0.025 m
(longitu-179
dinal×vertical) is maintained around still water level which contains most of the wave action, in
180
a similar setup as outlined in Santo et al. (2015). On average, each 3D simulation comprising 5.2
181
million cells took∼10 days for a 30 sec run on 12 processors. All simulations were run on the High
182
Performance Computing (HPC) facilities of the National University of Singapore.
183
2.1. Discussion on the two modelling approaches
184
In this subsection, we emphasise on the key similarities and differences between the physical
185
experiments and the numerical simulations. Using the assumption of separation of length scales, we
186
assume that the global large-scale wake structure (which scales as the frontal width of the actual
187
jacket) is more dominant and hence more important than the local small-scale details of the wakes
188
for each cylinder (which scale as the diameter of the individual cylinders). Hence, we can effectively
189
represent the actual complicated jacket model as a porous block in the numerical simulation, and
190
calibrate the numerical model to have comparable amount of resistance and added mass as the
191
actual model. Thus, the bulk and large-scale flow parameters are maintained going from physical
192
to numerical model, but inevitably there are some important differences.
The wave and current conditions in the physical experiments were reproduced as accurately as
194
possible in the numerical wave tank. Linear wave theory was used at the numerical inlet boundary,
195
consistent with the linear wave generation used in the physical experiments. However, instead of
196
moving the porous tower to numerically mimic the towing of the jacket in the physical experiments,
197
a uniform current profile was fluxed at the inlet boundary instead, mainly to avoid the additional
198
numerical complexity of a moving (dynamic) mesh. Hence, for cases of waves with in-line current,
199
the apparent wave encounter frequency is slightly modified in the numerical simulation to account
200
for the Doppler shift effect introduced by the current in the physical experiments. The key difference
201
between the two modelling approaches is thus our numerical approach has a slight effect of modifying
202
the shape of the transient focussed wave group with uniform current relative to the same group
203
without current. This is a result of wave-current interaction which was otherwise not present in
204
the physical experiments, whereby the waves generated from the wave paddles at one end of the
205
tank did not feel the effect of current. However, the aim in each of the simulations was to match
206
both the uniform current and the wave time history at the model as accurately as possible for each
207
physical experiment.
208
The possible importance of global large-scale wake interaction for total hydrodynamic load
209
can be examined via a Keulegan-Carpenter number defined for the entire structure: KCstruct =
210
2π(η/D), where η is the surface wave crest elevation and D is the frontal width of the structure
211
which is comparable to the downstream length. We base this discussion on the unsteady flow
212
properties close to the free-surface where the wave kinematics are the largest and much of the total
213
hydrodynamic load is exerted. For the largest waves at the centre of each wave groupη ∼ 0.25
214
m, D ∼0.35 m, so KCstruct ∼4.5. For a solid body, this value of KC would be small enough
215
to exhibit very substantialKC number effects. However, the volume of the space-frame model is
216
highly porous and so the wake must be somewhat equivalent globally to that from a solid body
217
with very considerable ‘base-bleed’ (Bearman, 1967) with fluid injected from the rear of the body
218
downstream into the flow. This injected flow greatly weakens the strength of the wake, and in
219
particular the vorticity either side of the wake. This weakened vorticity would have a smaller effect
220
on the local flow at the porous body when swept back towards the body by the next half cycle of
221
the wave oscillation.
222
For cases with both wave and inline current, we measured the force from regular waves and
223
also a large wave group, both with a substantial current, either 0.14 or 0.28 m/s. Over the time
required for the maximum excursion of a fluid particle to occur horizontally, here half a wave period
225
∼1 s, the current will permanently advect global-scale vorticity downstream a distance which is
226
a significant fraction of the whole platform width (length). Accounting for current blockage, the
227
distances would be ∼ D/3 and 2D/3 for the different magnitudes of the current. Hence, it is
228
unlikely that finite KCstruct effects would play any role, with much of the global vorticity being
229
swept beyond the downstream edge of the structure and not returning. This would yield the same
230
value for the drag coefficient Cd ∼1.3 as appropriate for steady current with no waves present.
231
The global large-scale wake interactions should be reproduced well in the numerical simulations.
232
The same steady flow value of Cd = 1.3 can also be applied for an isolated large wave group
233
without current and for all cases of focussed wave groups embedded into a regular wave background
234
without current. Although a train of relatively small regular waves before an embedded large wave
235
group would give rise to some vorticity in the flow as the large wave passes, this background wake
236
vorticity is rather weak compared to that from the large wave itself.
237
Interestingly, one exception is for an incident regular wavetrain without current whereby
sim-238
ulation of the measured force time history requires a drag coefficientCd ∼ 1.3×1.6, larger than
239
the value of 1.3 required for the same regular waves with current or current alone. This rise from
240
the steady-flow value of drag coefficient from 1.3 to 1.3×1.6 must be associated with KCnumber
241
effects, interpreted as the influence of coherently shed vortices. When a steady train of regular wave
242
incident onto the jacket model, a group of vortices is shed forward (downstream) in one half of a
243
regular wave cycle. The same group is subsequently swept backward (upstream) during the second
244
half of the wave cycle. If the circulation of the previously shed vortices survives throughout the
245
second half of the wave cycle, the flow through the gaps of the jacket model is enhanced. This would
246
increase the hydrodynamic drag force on the structure, reflected by the requirement to increaseCd
247
beyond the steady flow value if the small-scale wake structure is ignored. This enhancedCdvalue in
248
regular waves alone is of course entirely consistent with the observations of Allender and Petrauskas
249
(1987), whose original paper provided the motivation for our blockage work.
250
There are no small-scale wake eddies resolved in the numerical simulations since the individual
251
structural elements in the physical space-frame model are not represented. Instead, their global
ef-252
fects are being represented by a distributed stress on the fluid. This absence is clearly demonstrated
253
in Figure 4 (left plot), where both the power spectra of the total applied force measured in the
254
tank and force predicted by the CFD simulation are shown. The drag term in the Morison
0 2 4 6 Frequency (Hz)
10-4 10-2 100 102
Power Spectrum (N
2 /Hz)
-50 0 50 100 150
Force (N)
Measurement CFD
35 40 45 50 55 60
Time (sec) -50
0 50 100 150
[image:12.595.94.519.146.326.2]Force (N)
Figure 4: Comparison of measured force time histories (top right plot) for focussed wave with 0.14 m/s current
and the power spectra (left plot) between measurements (grey) and numerical predictions (red). On the bottom
right plot, the total force time histories of both measurement and numerical results are split into time histories for
components ≤2 Hz which reveals the dominant force components (with vertical axis shifted for clarity), and for
components>2 Hz which contains small high frequency components.
tion is nonlinear, producing significant 2nd (∼1 Hz) and 3rd harmonics (∼1.5 Hz) for combined
256
oscillatory wave velocity and steady current. These harmonics are seen in the experiments and well
257
reproduced in the simulations. However, there is little frequency content in the CFD force spectrum
258
beyond 2 Hz here, consistent with theu|u|Morison form. In contrast, the experimentally measured
259
force shows spectral contributions well above this. This is further demonstrated in Figure 4 (right
260
plot).
261
The individual physical structural members are of several sizes and orientations (see Figure 2).
262
The largest members, the main legs, have a diameter of 38.2 mm. Hence, for the crest of the
263
largest wave, the appropriateKCleg∼40 is sufficiently large that the steady flow value of the drag
264
coefficient should be appropriate. The smaller structural elements have higherKC values, so the
265
steady flow drag coefficient should apply to these as well. However, at local scale, every individual
266
structural element will have a wake. With unsteady vortex shedding, these wakes will interact and
267
combine within and downstream of the structure in a complex manner, leading to small loading
268
components with a broadbanded high frequency spectral tail, exactly as seen in the tank. In fact, a
269
considerable vortex-induced-motion (VIM) of the jacket is observed during steady tow of the jacket
model in the tank, see Figure 4, both well before and well after the passage of the wave group
271
with a frequency centred at ∼4 Hz. As soon as a finite height of wave passes through, the high
272
frequency force components are completely swamped by the main fluid loading event.
273
The associated smaller-scale eddies with diameters at or larger than the individual member
274
diameters will provide a mechanism to drive high frequency force components, as well as local
tur-275
bulent flow mixing inside the porous tower (Santo et al., 2014a). The clear separation of frequency
276
bands, here at 2 Hz, provides strong support for our separation of length scale argument for forces.
277
Force components below 2 Hz are consistent with global Morison-type loading, those above with
278
individual structural element vortex shedding and the subsequent interactions of the small-scale
279
eddies.
280
3. Results and discussions 281
In the physical tests, three towing speeds (currents) were considered: 0.14 m/s and 0.28 m/s
282
(which correspond to 1.25 m/s and 2.5 m/s, respectively, at full scale), as well as waves with no
283
current. Using the simple blockage factor equation proposed by Taylor (1991) and subsequently
284
adopted by American Petroleum Institute (2000), the drag coefficient for the entire jacket model,
285
Cd, was first calibrated from the measured drag of the steady tow tests. The optimum Cd which
286
gives the best fit to the measured drag is found to be 1.3; high but reasonable since we do not
287
account for local velocity amplification due to the presence of other members, in particular due
288
to the closely-spaced conductors. This is consistent with our numerical representation of a porous
289
tower, where there is no account for the physical volume of the structural elements within the
290
numerical cells (no ‘pore velocity representation’). This is different to the numerical representation
291
commonly applied in modelling flow over porous coastal structures such as by Jensen et al. (2014).
292
The overall Morison inertia coefficient,Cm, is set as 2.0, which is the potential flow-based value for
293
cylinders in cross flow. It is worth noting that some early studies for periodic waves and current
294
separately have demonstrated thatCd can be larger for cylinder array than an isolated cylinder,
295
see Cheng and Nguyen (2010); Wang et al. (2015).
296
These values of the Morison coefficients are used within the numerical simulation of the porous
297
tower. As a first approximation, the density of the drag (area) and inertia (volume) of the actual
298
jacket components is assumed to be uniformly distributed over two blocks stacked vertically and
299
encompassing the whole volume of the porous tower.
3.1. Regular wave
301
We first present a comparison of forces due to regular waves with and without steady current.
302
We extract the simple periodic (steady-state) forces due to regular waves, and then decompose the
303
total forces into drag and inertia components using the same decomposition method outlined in
304
Santo et al. (2014b). This assumes that the drag force is in-phase with the wave crest alongside
305
the model and that the inertia force is skew in time around this point. We subsequently
phase-306
average the forces cycle-by-cycle, in a same manner as described in Santo et al. (2017). Two cases
307
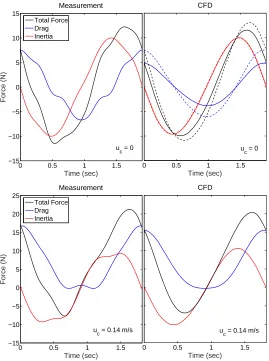
of comparison are shown in Figure 5 for regular wave of height 0.1 m without (top) and with 0.14
308
m/s current (bottom). At field scale, these parameters become a regular wave of height 8 m and a
309
current of 1.25 m/s using Froude scaling (of 1:80 in length scales).
310
For each case, measurements are shown on the left, and numerical predictions on the right.
311
The total force and the inferred drag and inertia components are plotted as solid black, blue and
312
red lines, respectively. For the numerical predictions, solid lines are obtained usingCd = 1.3 and
313
Cm = 2.0 (our default values), while the dashed lines in Figure 5 (top) are for Cd = 1.3×1.6
314
keeping the sameCm. We associate the increase inCdas due to Keulegen-Carpenter (KC) number
315
effects, as previously discussed in Section 2.1. What we observe is that for all regular wave cases
316
with both non-zero values for the in-line current, as well as for all steady tow tests with no waves,
317
the numerical predictions using Cd = 1.3 and Cm = 2.0 are appropriate for reproducing all the
318
measured force time histories. The relatively good agreement between the measurements and the
319
numerical predictions, both in terms of the peak and trough force values but also in terms of the
320
temporal variation of the force, provides significant support for our modelling approach.
321
3.2. Focussed wave group
322
We proceed with focussed wave groups with and without current, and compare our numerical
323
prediction (accounting for wave-current blockage) with measurements taken as the reference. We
324
also present numerical predictions according to the API recommended practice. Following the
325
API approach, a simple blockage factor is applied to reduce the magnitude of the uniform current
326
to account for blockage due to steady flow. The presence of the structure is assumed not to
327
modify the undisturbed wave kinematics. The force prediction due to API is obtained numerically
328
by integrating the undisturbed wave field and the reduced current profile over the tower volume
329
(without the presence of the porous tower), hence it is denoted as Fund in the captions of the
0 0.5 1 1.5 Time (sec)
CFD
0 0.5 1 1.5
−15 −10 −5 0 5 10 15
Time (sec)
Force (N)
Measurement
Total Force Drag Inertia
uc = 0 uc = 0
0 0.5 1 1.5
−15 −10 −5 0 5 10 15 20 25
Time (sec)
Force (N)
Measurement
0 0.5 1 1.5
Time (sec)
CFD
Total Force Drag Inertia
u
[image:15.595.172.441.208.569.2]c = 0.14 m/s uc = 0.14 m/s
Figure 5: Comparison of force time histories for regular wave of height 0.1 m without current (top) and with uniform
0.14 m/s current (bottom). The measurements are shown on the left of each subfigure, the numerical predictions on
the right of each subfigure. Note the difference in vertical axis scaling between the two figures. Dashed line in top
following figures. On the other hand, since our numerical prediction is obtained by integrating
331
over the tower volume by using thedisturbed kinematics within the flow due to the presence of the
332
structure as an array of obstacles, our numerical prediction is denoted asFdist.
333
Figure 6 shows composite figures for comparison of surface elevation (left) and total force (right)
334
time histories between measurements (black) and numerical predictions (grey) for focussed wave
335
groups without current (top panel) and with a uniform 0.28 m/s current (middle panel). The surface
336
elevation was measured at midway between the porous tower and the side wall of the numerical
337
wave tank. For the numerical prediction of the forces, the same values ofCd = 1.3 andCm= 2.0
338
are used in all cases. There is no evidence of KC number effects for the focussed wave group without
339
current, as previously discussed in Section 2.1. In general, reasonably good agreement in terms of
340
surface elevation and force time histories are obtained. It is worth noting that the shape of the
341
focussed wave group with in-line current is more compact because of the Doppler shift effect, as
342
the modification to the wave encounter frequency was accounted for in the numerical simulation.
343
There is a slight change in the shape of the numerical wave group due to wave-current interaction.
344
It is also important to stress that the magnitude of the peak force is now about ten times larger
345
than the regular wave case discussed previously. Hence, we are modelling an extreme condition,
346
with an incoming field-scale crest elevation of 18.4 m (which coincidently matches the height of the
347
infamous Draupner wave (Adcock et al., 2011) though not its likely kinematics). For a real jacket
348
structure in the central North Sea, this would correspond to an extreme design event.
349
On the right middle corner of the same figure, the dashed red line represents the numerical
350
prediction according to the API guideline, an industry design standard. Using the sameCd = 1.3
351
andCm= 2.0, the API prediction agrees well with the measurement during the steady tow (before
352
t=−5 sec) just as the recipe is designed for. However, as the transient wave group passes by, the
353
API recipe over-predicts the largest force when compared with the measurement (238 N reduced
354
to 172 N). In contrast, the numerical prediction using the porous tower reproduces the largest
355
force within the correct range. The over-prediction from the API recipe is interpreted as additional
356
blockage (by keeping the sameCd andCm) occurring within the transient waves in addition to the
357
existing blockage due to the steady current.
-6 -4 -2 0 2 4 6 Time (sec) -0.15 -0.1 -0.05 0 0.05 0.1 0.15 0.2 0.25 η (m) Measurement CFD
-6 -4 -2 0 2 4 6
Time (sec) -60 -40 -20 0 20 40 60 80 100 120
Total Force (N)
Measurement F
dist with Cd = 1.3
-6 -4 -2 0 2 4 6
Time (sec) -0.15 -0.1 -0.05 0 0.05 0.1 0.15 0.2 0.25 η (m) Measurement CFD
-6 -4 -2 0 2 4 6
Time (sec) -50 0 50 100 150 200 250
Total Force (N)
Measurement F
dist with Cd = 1.3
F
und with Cd = 1.3
-15 -10 -5 0 5 10 15
Time (sec) -0.2 -0.1 0 0.1 0.2 0.3 η (m) Measurement CFD
-6 -4 -2 0 2 4 6
Time (sec) -100 -50 0 50 100 150
Total Force (N)
Measurement
F
[image:17.595.157.680.90.472.2]dist with Cd = 1.3
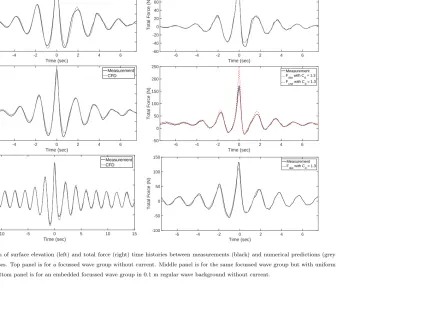
Figure 6: Comparison of surface elevation (left) and total force (right) time histories between measurements (black) and numerical predictions (grey
1
3.3. Embedded focussed wave in smaller regular wave background
359
We proceed with the comparison of the forces arising from embedded focussed wave groups in a
360
smaller regular wave background, with and without current. The bottom panel of Figure 6 presents
361
the comparisons of surface elevation (left) and total force (right) time histories between
measure-362
ments (black) and numerical predictions (grey and red) for the case of the embedded focussed wave
363
group in 0.1 m regular wave background without current. The surface elevation is reproduced
364
relatively well in the numerical simulation, while the total force is reasonably reproduced using
365
Cd= 1.3. It is worth remarking that comparison in terms of force components (drag and inertia) is
366
not attempted because the resultant focussed wave group is asymmetric in time around the largest
367
crest. This is presumably due to nonlinear wave-wave interactions occurring as the waves move
368
down the tank to the jacket model. Hence the embedding process is noticeably distorted. Our
369
simple force decomposition method into drag and inertia, outlined in Santo et al. (2014b), relies on
370
symmetry around the wave crest.
371
Figure 7 presents comparison of embedded focussed waves in two different regular wave
back-372
ground heights with two different non-zero currents. Since the embedded wave group moves relative
373
to the regular waves, the resultant wave group for the case with a 0.1 m regular wave background
374
(top panel) is not perfectly focussed. Meanwhile, the wave group for the case with 0.15 m regular
375
wave (middle panel) has a near-perfectly focussed deep trough. A 180◦ phase shift to the entire
376
input signal to the paddle for the case with a 0.15 m regular wave produces a wave group with
377
a near-perfectly focussed large crest (bottom panel). Overall, the comparison in terms of surface
378
elevation between the physical wave tank and the CFD results (left panels) is reasonable, with
379
some slight mismatch at the adjacent crests and troughs to the largest crest/trough, due to
wave-380
current interaction occurring along the numerical wave tank. The agreement around the largest
381
crest/trough is relatively good. For the comparison in terms of force time histories (right panel),
382
the numerical predictions with the porous tower present (grey lines) agree remarkably well with the
383
measurements (black lines) for all cases, again using only a single set ofCd= 1.3 andCm= 2.0.
384
The industry standard API predictions using the sameCdandCmwill substantially over-predict
385
the largest force for all cases, demonstrating additional force reduction to be gained by accounting
386
for the contribution arising from the waves. Arguably, the Morison coefficients, in particular Cd,
387
can be tuned (i.e. in this case reduced) such that the prediction from the API recipe matches the
388
largest peak force for each case. This is shown on the same figure as dashed red lines. For all
−10 −5 0 5 10 −0.2
−0.1 0 0.1 0.2 0.3
Time (sec)
η
(m)
Measurement CFD
−5 0 5
−50 0 50 100 150
Time (sec)
Total Force (N)
Measurement F
dist with Cd = 1.3
F
und with Cd = 0.7
−10 −5 0 5 10
−0.2 −0.1 0 0.1 0.2 0.3
Time (sec)
η
(m)
Measurement CFD
−5 0 5
−50 0 50 100 150
Time (sec)
Total Force (N)
Measurement F
dist with Cd = 1.3
F
und with Cd = 0.8
−10 −5 0 5 10
−0.2 −0.1 0 0.1 0.2 0.3
Time (sec)
η
(m)
Measurement CFD
−5 0 5
−50 0 50 100 150 200 250
Time (sec)
Total Force (N)
Measurement F
dist with Cd = 1.3
F
[image:19.595.192.649.86.455.2]und with Cd = 0.65
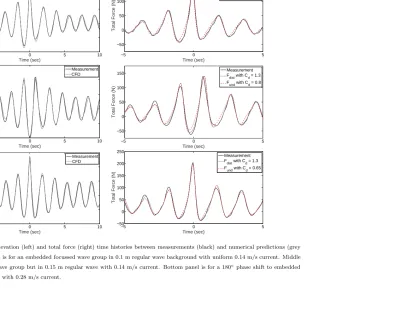
Figure 7: Comparison of surface elevation (left) and total force (right) time histories between measurements (black) and numerical predictions (grey
and red) for three cases. Top panel is for an embedded focussed wave group in 0.1 m regular wave background with uniform 0.14 m/s current. Middle
1
presented cases, differentCd values (ranging from 0.65−0.8) are required to match the measured
390
largest peak forces. However, elsewhere away from the peak forces, the fit to the measured force
391
time histories according to the API predictions are less good. Essentially, in order for the API
392
recipe to fit the largest peak forces, one needs to use a largerCd for steady tow (current) only, and
393
a set of smaller values ofCd for waves with different heights and different in-line current speeds.
394
Although the force comparison using the standard Morison form (which do not account for blockage
395
effects) is not presented here, a similar trend is expected. For the Morison form to fit the largest
396
peak forces, one needs a largerCdfor waves only, and a set of smaller values ofCd for current only,
397
and waves with various in-line currents, consistent with previous observations from Allender and
398
Petrauskas (1987) and Reed et al. (1990). Moreover, to fit the entire force time histories, one needs
399
to use a time variantCd.
400
What this paper demonstrates, is that, without the influence of KC number effect onCd (which
401
is only present when there is regular wave field in the absence of steady current), a generality of
402
the results can be obtained after accounting for wave-current blockage effects. A single invariant
403
set of Cd and Cm is all that is required to numerically reproduce the complete measured total
404
force time histories on a large and realistic laboratory-scale space-frame model, for a large range of
405
combinations of various wave heights and different non-zero current speeds. This is in contrast to the
406
results and observations of previous researchers such as Sarpkaya and Isaacson (1981), Sarpkaya
407
et al. (1984), Heideman and Sarpkaya (1985), Rodenbusch and K¨allstr¨om (1986), and Chaplin
408
et al. (1992). Many of these past studies have shown large scatter in Cd and Cm in particular
409
when current is present, and none of these values bear any resemblance to those obtained under
410
no-current condition (waves only), or steady tow condition (uniform flow at constant velocity). The
411
observed general trend in the past is thatCd decreases with increasing relative current velocity for
412
a given Reynolds number and KC number. With our numerical approach using a porous tower with
413
an embedded Morison stress field coupled with the underlying assumption of separation of length
414
scale, no such effect is observed.
415
In terms of practicality, one only needs to measure the steady drag force due to steady current
416
on a scaled or an actual space-frame offshore structure. Using the simple current blockage factor
417
and with the information on the geometric area of the structure, the underlyingCd can then be
418
estimated, andCm= 2.0 appears to be a reasonable assumption for the inertia contributions. With
419
the proposed approach, one can then obtain estimates within reasonably good accuracy of the peak
forces as well as complete force time histories on the structure, under a wide range of extreme
421
wave and in-line current conditions. This is particularly important when the survivability of the
422
structure might start to come into question.
423
4. Conclusions 424
This paper documents laboratory-scale experimental measurements of surface elevation and total
425
force time histories on a scaled jacket model in a large towing tank, subjected to a range of regular
426
waves, focussed waves, and embedded focussed wave in smaller regular wave background, all with
427
steady current present (by towing the jacket using a carriage). The quality of the measurements
428
is demonstrated by the method of mounting the jacket, as well as the high repeatability. Accurate
429
synchronisation between the carriage and the wave paddles allows the jacket model to meet the
430
same focussed wave at the right location and at the right time, but with different towing speeds.
431
Numerical simulations using CFD are conducted using a porous tower model with a uniformly
432
distributed embedded Morison stresses representing both drag and inertia contributions to the
433
loads on the entire jacket structure. Good agreement both in terms of surface elevation and in
434
particular total force time histories at the model are obtained, all using a single invariant set of
435
MorisonCd = 1.3 andCm= 2.0 for large range of flow structures with non-zero different current
436
speeds. This demonstrates the generality of the results in the absence of KC number wake-related
437
effects.
438
In contrast, numerical predictions applying the present industry guidelines such as the API
439
guidance substantially over-predict the largest peak forces using the same Morison coefficients.
440
This is interpreted as an additional force reduction (or blockage) due to contribution from waves
441
that is not being accounted for in the present guidelines. For the API recipe to match the peak
442
forces,Cd needs to be reduced to 0.65−0.8 for large waves with steady current, and a time variant
443
Cd is required to match the entire total force time histories. Overall, this paper demonstrates
444
the applicability of the porous tower modelling approach in representing a space-frame offshore
445
structure subjected to extreme wave and current environments. Although the methodology has
446
been tested specifically only on a particular configuration of our jacket model, we think that the
447
general conclusions apply to other space-frame offshore structures that fall in similar Morison
force-448
type flow regimes. The only uncertainty is on the effects of Reynolds number on bothCd andCm
449
for turbulent flow regimes at field (prototype) scale.
Important as these conclusions are for engineering applications, these results are equally
sig-451
nificant from a fundamental fluid mechanics viewpoint. With the assumption of a separation of
452
scales between the overall (global) wake of complete offshore jacket structures (several 10s of
me-453
tres across at full-scale) and the wakes of individual structural members (∼1−3 m in diameter),
454
strong wave-current-structure interaction is observed at large scale. However, there is no significant
455
influence from small scale beyond an effectively constant value for the drag coefficient of individual
456
structural elements. The presence of the (significant) in-line current is key for this. At physically
457
appropriate values of the inline current used for platform design, the steady flow value forCd is all
458
that is required.
459
These results also suggest the following hydrodynamic paradox. Consider starting with a jacket
460
structure in significant regular waves but with no current and then increasing the current from
461
zero. Because of the KC number effects, we speculate that the peak force on a jacket structure
462
initially does not increase at all. The drag coefficient Cd is initially affected by the coherent
463
vortices shed from the regular waves, hence the need to amplify the value of theCd relative to the
464
steady flow value. ThatCd value will subsequently drop and approach the steady flow value as the
465
current increases over time, since the presence of current effectively washes the coherent structures
466
downstream of the jacket model. It is thus plausible that the drop in theCdvalue in some way will
467
balance out the increase in the force due to the same waves but with an additional current.
468
Acknowledgements 469
We thank Dr. Richard Gibson now at Offshore Consulting Group for technical advice on typical
470
platform geometries. We are grateful for helpful discussions with Dr. Bai Wei, now of Manchester
471
Metropolitan University, and Prof. Rodney Eatock Taylor of the University of Oxford. The
tech-472
nicians at Kelvin Hydrodynamics Laboratory provided a high quality facility and technical service.
473
We would also like to acknowledge the use of the NUS High Performance Computing (HPC) facility
474
in carrying out this work. Last but not least, we acknowledge the support from Singapore
Mar-475
itime Institute (SMI) through grant number SMI-2015-AIMP-030, and the support given by Lloyds
476
Register (LR) Foundation to the Centre for Offshore Research & Engineering, National University
477
of Singapore, where most of this work was carried out. LR Foundation supports the advancement
478
of engineering-related education, and funds research and development that enhances safety of life
479
at sea, on land and in the air.
References 481
Adcock, T. A. A., Taylor, P. H., Yan, S., Ma, Q. W., Janssen, P. A. E. M., 2011. Did the Draupner
482
wave occur in a crossing sea? Proceedings of the Royal Society A: Mathematical, Physical and
483
Engineering Sciences 467 (2134), 3004–3021.
484
Allender, J., Petrauskas, C., 1987. Measured and predicted wave plus current loading on a
485
laboratory-scale, space frame structure. In: Offshore Technology Conference, OTC 5371.
486
American Petroleum Institute, 2000. Recommended practice for planning, designing, and
con-487
structing fixed offshore platforms–working stress design. API RP2A-WSD 21st Edition with
488
Erratas and Supplements 1, 130–132.
489
Bearman, P. W., 1967. The effect of base bleed on the flow behind a two-dimensional model with
490
a blunt trailing edge. Aeronautical Quarterly 18, 207–224.
491
Berberovi´c, E., van Hinsberg, N. P., Jakirli´c, S., Roisman, I. V., Tropea, C., 2009. Drop impact
492
onto a liquid layer of finite thickness: dynamics of the cavity evolution. Physical Review E –
493
Statistical, Nonlinear, and Soft Matter Physics 79 (3), 036306.
494
Chaplin, J. R., Subbiah, K., Irani, M., 1992. Local forces on a vertical cylinder in regular and
irregu-495
lar waves. In: The Second International Offshore and Polar Engineering Conference. International
496
Society of Offshore and Polar Engineers.
497
Chen, H., Christensen, E. D., 2016. Investigations on the porous resistance coefficients for fishing
498
net structures. Journal of Fluids and Structures 65, 76–107.
499
Cheng, N.-S., Nguyen, H. T., 2010. Hydraulic radius for evaluating resistance induced by simulated
500
emergent vegetation in open-channel flows. Journal of Hydraulic Engineering 137 (9), 995–1004.
501
Heideman, J. C., Sarpkaya, T., 1985. Hydrodynamic forces on dense arrays of cylinders. In: Offshore
502
Technology Conference, OTC 5008. Offshore Technology Conference.
503
Jacobsen, N. G., Fuhrman, D. R., Fredsøe, J., 2012. A wave generation toolbox for the open-source
504
CFD library: OpenFOAMR
. International Journal for Numerical Methods in Fluids 70 (9),
505
1073–1088.
Jensen, B., Jacobsen, N. G., Christensen, E. D., 2014. Investigations on the porous media equations
507
and resistance coefficients for coastal structures. Coastal Engineering 84, 56–72.
508
Kristiansen, T., Faltinsen, O. M., 2012. Modelling of current loads on aquaculture net cages. Journal
509
of Fluids and Structures 34, 218–235.
510
Morison, J. R., O’Brien, M. P., Johnson, J. W., Schaaf, S. A., 1950. The force exerted by surface
511
waves on piles. Journal of Petroleum Technology 2 (5), 149–154.
512
Reed, K., Aarsnes, J. V., Beltrand, O., Andersen, E., 1990. Wave and current forces on conductor
513
pipe groups. In: Environmental Forces on Offshore Structures and Their Predictions: Proceedings
514
of an International Conference. Society of Underwater Technology.
515
Rodenbusch, G., K¨allstr¨om, C., 1986. Forces on a large cylinder in random two-dimensional flows.
516
In: Offshore Technology Conference, OTC 5096. Offshore Technology Conference.
517
Santo, H., Stagonas, D., Buldakov, E., Taylor, P. H., 2017. Current blockage in sheared flow:
518
Experiments and numerical modelling of regular waves and strongly sheared current through a
519
space-frame structure. Journal of Fluids & Structures 70, 374–389.
520
Santo, H., Taylor, P. H., Bai, W., Choo, Y. S., 2014a. Blockage effects in wave and current: 2D
521
planar simulations of combined regular oscillations and steady flow through porous blocks. Ocean
522
Engineering 88, 174–186.
523
Santo, H., Taylor, P. H., Bai, W., Choo, Y. S., 2015. Current blockage in a numerical wave tank:
524
3D simulations of regular waves and current through a porous tower. Computers & Fluids 115,
525
256–269.
526
Santo, H., Taylor, P. H., Williamson, C. H. K., Choo, Y. S., 2014b. Current blockage experiments:
527
force time histories on obstacle arrays in combined steady and oscillatory motion. Journal of
528
Fluid Mechanics 739, 143–178.
529
Sarpkaya, T., Bakmis, C., Storm, M. A., 1984. Hydrodynamic forces from combined wave and
530
current flow on smooth and rough circular cylinders at high Reynolds numbers. In: Offshore
531
Technology Conference, OTC 4830. Offshore Technology Conference.
Sarpkaya, T., Isaacson, M., 1981. Mechanics of Wave Forces on Offshore Structures. New York:
533
Van Nostrand Reinhold.
534
Taylor, P. H., 1991. Current blockage: reduced forces on offshore space-frame structures. In:
Off-535
shore Technology Conference, OTC 6519.
536
Taylor, P. H., Santo, H., Choo, Y. S., 2013. Current blockage: reduced Morison forces on space frame
537
structures with high hydrodynamic area, and in regular waves and current. Ocean Engineering
538
57, 11–24.
539
Wang, B., Guo, X., Mei, C. C., 2015. Surface water waves over a shallow canopy. Journal of Fluid
540
Mechanics 768, 572–599.
541
Zhao, Y. P., Bi, C. W., Dong, G. H., Gui, F. K., Cui, Y., Guan, C. T., Xu, T. J., 2013. Numerical
542
simulation of the flow around fishing plane nets using the porous media model. Ocean Engineering
543
62, 25–37.