M E T A L S
Characterisation and modelling of in-plane springback
in a commercially pure titanium (CP-Ti)
S. Khayatzadeh1,* , M. J. Thomas2, Y. Millet3, and S. Rahimi1
1
Advanced Forming Research Centre (AFRC), University of Strathclyde, 85 Inchinnan Drive, Inchinnan, Renfrew, Glasgow PA4 9LJ, UK
2TIMET UK Ltd., Witton, Birmingham B6 7UR, UK 3
TIMET SAVOIE, 62 Avenue Paul Girod, 73400 Ugine, France
Received:12 October 2017
Accepted:28 December 2017
The Author(s) 2018. This article is an open access publicationABSTRACT
Effective prediction of springback during sheet metal forming is critically important for automotive and aerospace industries, especially when forming metals with high strength-to-weight ratio such as titanium. This requires materials mechanical data during plastic deformation and their dependencies on parameters like strain, strain rate and sample orientation. In this study, springback is quantified experimentally as elastic strain recovery, degradation in Young’s modulus and inelastic strain recovery on unloading in a commer-cially pure titanium type 50A (CP-Ti-50A). The results show strain rate-de-pendent anisotropic mechanical behaviours and a degradation in Young’s modulus with increased level of plastic deformation. The level of degradation in Young’s modules increases gradually from 13% for samples parallel to the rolling direction (RD) to 20% for those perpendicular to the RD. A measurable nonlinear strain recovery was also observed on unloading that is orientation dependent. The level of springback is characterised as the sum of elastic recovery and the contributions from both the degradation in Young’s modulus and anelastic strain recovery. It is shown that the Chord modulus can estimate springback with a reasonable accuracy taking into consideration the elastic strain recovery, degradation in Young’s modulus and anelastic strain recovery.
Introduction
Springback is a strain recovery in a formed product following a forming process [1] that often causes deviation from a desired geometry. In addition to the geometrical non-conformance, springback also chan-ges the status of strain and stress in a deformed
material following the tool’s (e.g. punch) removal [2–4]. Springback is one of the major engineering problems associated with parts manufacturing, especially in sheet metal forming processes due to the small thickness of the sheet material. This is even more pronounced for high-strength metals such as titanium and its alloys that are used predominantly
Address correspondence toE-mail: [email protected]
in aerospace industry, due to their high strength-to-weight ratio [5]. Accurate prediction of springback for such metals is a challenge, particularly for parts with complex geometries. An extensive body of the literature exists on studying springback in different materials, where the origin of springback is linked to the changes in materials mechanical properties and responses during plastic deformation [1,6–12].
Representing material’s elastic behaviour as a lin-ear trend (i.e. Young’s modulus) is one of the sources of uncertainties when modelling springback. A study reported by Chen et al. [6] on 26 diverse commercial sheet alloys showed that no finite linear trend can be observed in the elastic region during loading of these alloys. In contrast, a consistency in the data was observed for nonlinearity throughout the transition region from elastic to plastic, starting from very low stress levels far below the yield point. Therefore, considering elastic behaviour as a linear curve by using a single value for Young’s modulus to describe the elastic region can potentially generate significant uncertainties in determination of springback. This is even more pronounced during unloading compared to loading [1,5,7–9,13–15].
Earlier studies [1, 7, 8, 10, 11, 13–17] show a degradation in Young’s modulus as a function of the level of plastic deformation for different alloys. This has usually been shown by comparing the initial elastic modulus, characterised using standard meth-ods, at no plastic strain to those measured after var-ious levels of plastic strain through interrupted tensile tests, consisting of a series of loading–un-loading–loading steps on a same sample [5]. In addition to progressive degradation in Young’s modulus as a function of plastic deformation, Luo and Ghosh [1] have shown that following plastic deformation in deep drawing of quality special killed (DQSK) steel, an inelastic nonlinear strain recovery occurs making the total strain recovery that is greater than the value expected on the basis of considering degraded single value for elasticity. This form of visco-plastic strain recovery is known as ‘‘anelastic’’ strain which is time rate dependent, and these dependencies have not been reported previously [1, 8, 13]. It was shown that higher levels of plastic deformation reduce Young’s modulus significantly, though increases Poisson’s ratio [1]. Different methodologies exist to study degradation in Young’s modulus as a function of plastic deformation, such as interrupted uniaxial [1, 7, 8, 13–15, 18] and biaxial
loading–unloading–loading tensile tests [19,20], and pre-strained three-point bending tests [19, 21–23]. The former is the most reported method used for detailed characterisation of elastic modulus during plastic deformation [1,7,8,10,11,13–17]. Despite the intensive application of interrupted tensile test tech-nique, it has been argued that the pre-strained three-point bending test provides measurement of degra-dation in elastic modulus during plastic deformation more accurately [19]. A comparative study of uniax-ial, biaxial and three-point bending test methods was carried out by Xue et al. [19] on three types of dual-phase steels (i.e. DP500, DP600 and DP780), and the highest and lowest initial elastic modulus were those of uniaxial and biaxial testing methods, respectively, and that of the three-point bending tests were in between.
Degradation in elastic modulus by increasing the level of plastic deformation has been observed for different materials. Benito et al. [11] reported&8% decrease in Young’s modulus with 6% plastic defor-mation in pure iron deformed by drawing at room temperature, followed by a negligible increase in the Young’s modulus (&6 GPa) after further 3% defor-mation. In a study conducted on TRIP 700 steel by Mendiguren et al. [7], the Young’s modulus is decreased by 20% after 12% plastic deformation, which raised an alarm on considering this significant change in the prediction of post-forming springback. The level of degradation is shown to vary for differ-ent materials. These differences were studied by Abvabi et al. [10] where the degradation was observed to be more pronounced for higher-strength steels compared to softer grades.
unloading cycle of interrupted tensile tests. It can be used as a mean value for estimating springback including elastic strain recovery, degradation in Young’s elastic modulus and nonlinear strain recov-ery [5]. Chord modulus has been used in springback prediction models based on finite element analyses [5, 10, 14], and the results were more closer to the experimentally measured springback. This was gen-erally done by substituting the elastic modulus with changes in Chord modulus versus the level of applied plastic deformation. Also, as similar as to the degradation in Young’s elastic modulus, a degrada-tion in Chord modulus is observed with increasing plastic deformation [5,8,14].
The anelastic strain recovery can be significantly high, as for instance&20% of the total strain recovery is measured in TRIP steel [18]. Sun et al. [14] investigated the strain recovery following plas-tic deformation, by describing the strain as a quasi-plastic–elastic (QPE) phenomenon that has resulted from a combination of elastic, plastic and QPE deformations. A significant improvement was achieved in predicting springback using this model in dual-phase steel [14]. It was shown that a sig-nificant magnitude of nonlinear strain recovery occurred in addition to the elastic strain recovery following unloading, taking into consideration the degradation in elastic modulus as a function of plastic strain [14].
During sheet metal forming process, an abundance of plastic strain is introduced to a deformed part at different strain rates. For complex geometries, the actual strain rate may vary for different areas of the part [25]. Previous reports [15, 26, 27] suggest that springback can be drastically influenced by strain rate and work hardening behaviours of the material. This was clearly shown for two different aluminium alloys of type 2024-T3 and type 2024-O, where the springback for the later exhibited much lower sensi-tivity to strain rate compared to that of the former [27]. An additional study [26] also showed that springback in commercially pure titanium is sensitive to strain rate. Despite the importance of the influence of strain rate on springback, and the locational dependency of strain rate throughout a part during sheet forming processes, there is still lack of under-standing of the overall effect on springback.
Additionally, in anisotropic materials springback behaviour varies for different orientations of a part due to the directional dependency of the mechanical
properties [28]. Few studies have attempted to take the anisotropic mechanical properties into an account when estimating springback [7, 28–30]. It was con-cluded that the springback magnitude was depen-dent on the orientation of the investigated sample with respect to the rolling direction of the original sheet.
Establishing a relationship between springback and an appropriate material model is vitally impor-tant, to estimate springback more effectively. This requires a clear understanding of changes in mate-rial’s behaviours, such as elastic modulus, with plastic deformation, as well as the elastic and anelastic strain recovery behaviours upon unloading. This paper aims to present a clear understanding of the evolution of Young’s modulus as a function of plastic deformation, and the elastic and anelastic strain recovery behaviours in a commercially pure titanium type 50A. The purpose is to gain a thorough understanding of mechanical properties in different directions to quantify the influence of plastic defor-mation on Young’s modulus and anelastic strain recovery that are both required in springback pre-diction models.
Experimental procedure
Material and microstructure characterisation
The material investigated in this study is an uncoated cold rolled sheet of commercially pure titanium grade 50A (CP-Ti50A) with a thickness of 1.6 mm. This was supplied by TIMET in a form of sheets with 1.6 mm91 m92 m (T9W 9L) dimensions. The specimens for uniaxial tensile tests were extracted from the as-received sheets using electrical discharge machining (EDM) with their lengths along three ori-entations of 0, 45 and 90 angles to the rolling direction (RD), to investigate the extent of material’s mechanical anisotropy. The samples were manufac-tured based on ASTM E8/EM8-11 [31], with gauge length and width dimensions of 57 and 12.5 mm, respectively.
(SiC) and polished by 6- and 1-lm lubricate diamond paste, successively. The mirror-finished samples were then electro-polished at ambient temperature for 60 s at 30 V in Struers’ electrolyte A3, to remove approximately 20- to 30-lm material from the mechanically polished surface. The acquisition of EBSD maps was carried out using a fully automated AZtec HKL Advanced (plus C5 Prem) Nordlys Max 2 EBSD system interfaced to a FEI Quanta-650 field-emission gun scanning electron microscope, with an accelerating voltage of 20 kV and a 100-lm-diameter aperture. The acquisition time was set to 60 ms, col-lecting at least 2 frames for each point. High-resolu-tion orientaHigh-resolu-tion maps with 0.5-lm step size and 550lm9500lm area each have been collected from both sample orientations (i.e. cross sections parallel (ND–RD) and perpendicular (ND–TD) to the RD). ND and TD, respectively, stand for the normal direction and transverse direction. In all cases, a minimum of 88% of the scanned areas were indexed.
Uniaxial tensile testing
Uniaxial tensile tests were conducted using a Zwick Roell Z250 machine to examine the mechanical properties in different directions of the as-received material. The standard tensile tests were carried out under three different strain rates of 0.002, 0.01 and 0.1 s-1for each sample orientation (i.e. 0, 45and 90 to the RD). Each test condition was repeated twice (i.e. total of 18 experiments) for each sample orien-tation. An external MTS-type extensometer, capable of measuring displacement in two directions of length (L) and width (W), was employed to measure the changes in dimensions along and across the gauge length of the samples during testing. True stress and true strain were computed from the engi-neering data set, under an assumption that the sam-ple’s volume remains constant after deformation in tension.
Interrupted tensile testing
A set of interrupted tensile tests consisting of several stages of loading–unloading–loading loops were conducted on the standard tensile samples with their lengths at 0, 45and 90to the RD, under the same parameters (e.g. strain rate) as those of the standard tensile experiments. These tests were carried out using the same tensile test machine (i.e. Zwick/Roell)
as that of the uninterrupted standard tensile tests in displacement control mode in which a number of deformation steps (i.e. loading and unloading) were applied. For each loading and unloading loop, the sample was loaded at displacement control condition up to a predefined target strain and then unloaded to a nonzero 50 N load to ensure that the sample is not subjected to compression on unloading. For each sample orientation and strain rate, two tests were performed with different numbers of loading–un-loading loops, one with 5% increment in strain in each step and the other with 4%. This was to understand the potential dependency of the mea-sured parameters such degradation in Young’s modulus, on the number of loops during interrupted tensile testing.
For each sample, displacement along the gauge length was measured during the test using a clip-on extensometer, as well as by digital image correlation (DIC) method. The difference between the results of both displacement measurement techniques was very small (i.e. maximum of 0.3%). For each loading–un-loading loop, Young’s modulus was measured dur-ing loaddur-ing, as similar as that for an uninterrupted tensile test, based on ASTM standard [32]. The Chord modulus was also calculated for each unloading– loading loop using the slope of a line connecting the start and end points of an unloading step. This was also done to study the degradation in Chord modulus with a progress of plastic strain, similar to that of Young’s modulus.
Residual stress measurements
Surface and through thickness residual stress were measured on both sides of the as-received sheet and within the gauge length of the specimens extracted for tensile tests. The purpose of these measurements was to understand the status of stress in the as-received material and after extracting the specimens, prior to the tensile experiments. The surface residual stress was measured using a Proto laboratory X-Ray Diffraction (LXRD) stress diffractometer and sin2w method [33]. The measurement points were along two directions of parallel to, and perpendicular to the RD for the as-received sheets, and longitudinal (along the length) and transverse (along the width) of the gauge length of tensile samples. The stresses were calculated from the strains of the {302} reflection plane at 148.7 Bragg angle. The stress uncertainty was obtained from the best fit to the sin2w plot. For each point in both directions, 10 measurements with 3 s exposure time for each measurement were performed. A round col-limator with 1 mm radius and elevenw-offset angles in the range of maximum±30were employed.
The through thickness stress measurement was carried out using a PRISM hole-drilling system manufactured by Stresstech that measures surface displacement based on electronic speckle pattern interferometry (ESPI) using a monochromatic laser with 532 nm wavelength as a light source for illu-mination. The endmills used for these measurements were 1.8 mm titanium aluminium nitride (TiAlN)-coated drills. Images were recorded after each step increment, and subsequently, the surface displace-ment induced by material removal during drilling was measured. The measured displacements were then used for the calculation of residual stress assuming Young’s modulus of 104, 109 and 117 GPa for samples at 0, 45 and 90 angles to the RD, respectively. These values for Young’s modulus were extracted from the standard tensile experiments car-ried out in this study. A Poisson’s ratio of 0.3 was considered for all directions.
Results
Material’s microstructure
The microstructure of the as-received CP-Ti sheet in the plane containing the normal (ND) and rolling
directions (RD) and normal to the transverse direc-tion (TD) is given in Fig.1a and b, respectively, with IPF colouring with respect to the TD. The EBSD data show that the CP-Ti material has a twin-free microstructure with equiaxed grains in both ND–RD and ND–TD planes with a similar average grain size of 5.6±3.5lm (Fig.1d) and a typical rolled a-Ti texture. The measured rolled a-Ti texture is a split (0001) basal texture with mostc-axes inclined at an angle of±(25–35) from the ND towards the TD and almost randomly orienteda-axis, as shown in {0001} and 1010 pole figures in Fig.1c. The maxi-mum (0001) pole intensity of *5.6 was observed at two symmetric positions of /1 =0 and 180,/=30 and /2 varied in the range of 0B/2 B60. Euler angles /1,/and/2 were defined with reference to the HCP crystal coordinates of the [1100]=RD, [2110]=TD and [0001]=ND.
Residual stress measurements
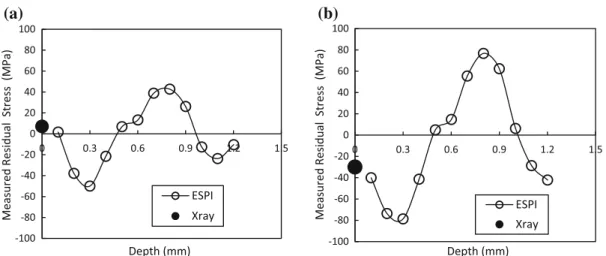
The surface and through thickness residual stress profiles measured on the titanium sheet in the as-received condition, prior to manufacturing of the tensile specimens, assessed by both XRD- and ESPI-based hole drilling, are shown in Fig. 2. The data show very low surface residual stress in the trans-verse direction (TD) and a small compressive (&-30 MPa) surface residual stress in the rolling direction (0 to the RD). On the other hand, the results of hole-drilling based on ESPI show higher levels of residual stress with depth, changing from
90oto the RD are slightly higher compared to those oriented at 0oand 45oto the RD.
Anisotropic behaviour
Table1 summarises the details of the results of standard tensile tests for three orientations of the as-received sheet (i.e. 0o, 45oand 90oto the RD), under different testing conditions. The gauge length dis-placement for each specimen was measured by both clip-on extensometer and DIC technique which their results were comparable and consistent. For each test, Young’s modulus (E), yield stress (r0.2), ultimate tensile strength (ruts) and failure strain (ef) are
analysed. These data show that Young’s modulus is not sensitive to strain rate (&1 GPa), for the same sample orientation. This is consistent with the results of several studies reported on the effect of strain rate on Young’s modulus [1,14,15], where no noticeable changes were observed. However, a study by Leacok et al. [26] showed that the initial Young’s modulus of commercially pure titanium increases with higher strain rates. Figure4a, b, and c, respectively, shows the plots of true stress– true strain curves for samples at 0o, 45oand 90oto the RD obtained under different strain rates of 0.002, 0.01 and 0.1 s-1. For each sample orientation, the yield stress is observed to be increased with an increase in the strain rate. Also, at
Figure 1 Microstructure characteristics of the as-received CP-Ti
used in these investigations;aandb,respectively, show the EBSD orientation maps with IPF colouring with respect to the TD of the cross sections containing ND–RD and ND–TD (i.e. parallel and perpendicular to the RD),c corresponding {0001} and 1010
each strain rate, the yield stress is increased by changing the sample orientation from 0 to 90with respect to the RD. For instance, under applied strain rate of 0.002 s-1, the measured yield stress for the sample at 0to the RD is&301 MPa, and that of the sample at 90to the RD is&407 MPa. Similarly, the Young’s modulus is increased by 10% with changing sample’s orientation from 0 to 90 to the RD. The percentages of elongation of the samples with their lengths at 45to the RD are higher, compared to those of the samples at 0and 90to the RD. However, the ultimate tensile strength (UTS) shows an opposite behaviour where the maximum value was measured for the samples at 0to the RD and minimum value was measured for the samples at 45 to the RD. In general, the results of tensile experiments show that the material behaviour is strain rate dependent.
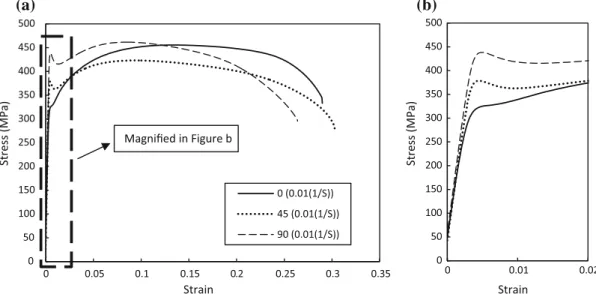
Figure5a shows the full engineering stress–true strain curves for samples with different orientations to the RD, tested under a constant strain rate of 0.01 s-1. It is apparent that the work hardening is reduced by changing the sample orientation from 0 to 90 to the RD. The stress–strain curves of the samples at 45o and 90o to the RD were following a similar trend, while that of the sample parallel to the RD (i.e. 0o) showed higher strain hardening rate. The data were fit in Hollomon’s empirical equation shown in Eq. (1), to evaluate the strain hardening coefficients for different orientations [34].
r¼kðepÞn ð1Þ
wherer is flow stress,epis true plastic strain,kand n are material’s constants known as strengths
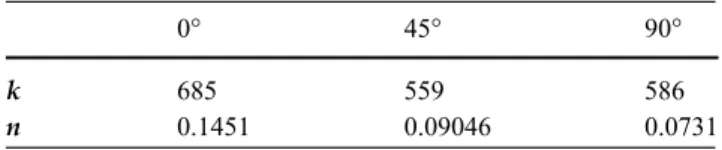
constant and strain hardening exponent, respectively. The constants were computed for the experimental flow curves obtained for all three sample orientations (i.e. 0o, 45oand 90oto the RD) tested under strain rate of 0.01 s-1. The constants are summarised in Table2. These constants (i.e. K and n) were appeared to be orientation dependent. This is evident by comparing the K and n values computed for different sample orientations (see Table 2). Figure5b emphasises on the elastic region and early stage of the plastic deformation of the results of standard tensile tests obtained for different sample orientations. A second yield point can be seen for samples at both 45 and 90to the RD, though it is more pronounced for the latter (Fig.5).
Effect of plastic deformation on elastic
modulus
Figure6a shows the results of two different cases of interrupted tensile tests with different numbers of loading–unloading loops, conducted on samples 0oto the RD and under a strain rate of 0.002 s-1. The true stress–true strain data for a continuous standard tensile test obtained for the same sample orientation and similar condition are also provided for the aid of comparison. The interrupted tensile test trials include a test with 5% strain interval and another with 4% strain interval between each loading and unloading step. A similar trend has been observed for the results of both continuous and interrupted tests, and no obvious difference was seen between the results of interrupted tests with different strain intervals.
(a)
(b)
-100 -80 -60 -40 -20 0 20 40 60 80 100
Measured Residual Stress (MPa)
Depth (mm) ESPI Xray
-100 -80 -60 -40 -20 0 20 40 60 80 100
0 0.3 0.6 0.9 1.2 1.5 0 0.3 0.6 0.9 1.2 1.5
Measured Residual Stress (MPa)
Depth (mm) ESPI Xray
Figure 2 Surface and through thickness residual stress components measured by XRD- and ESPI-based hole drilling on the as-received
(a)
(b)
(c)
-30 -25 -20 -15 -10 -5 0 5 10
0 10 20 30 40 50 60
Sxx (MPa),
Measured
Residual
Stress along
the Gauge
Length
(Face 1)
Distance Along the Gauge Length (mm)
0 Degree 45 Degree 90 Degree
-30 -20 -10 0 10 20 30 40 50
0 10 20 30 40 50 60
Syy (MPa),
Measured
Residual
Stress Perpindicular
to the Gauge
Length (Face
1)
Distance Along the Gauge Length (mm)
0 Degree 45 Degree 90 Degree
-25 -20 -15 -10 -5 0 5 10 15 20
0 10 20 30 40 50 60
Sxx (MPa),
Measured
Residual
Stress
along the Gauge
Length
(Face 2)
Distance Along the Gauge Length (mm)
0 Degree 45 Degree 90 Degree
-60 -50 -40 -30 -20 -10 0 10 20
0 10 20 30 40 50 60
Syy (MPa),
Measured
Residual
Stress
Perpindicular
to the Gauge
Length (Face
2)
Distance Along the Gauge Length (mm)
0 Degree 45 Degree 90 Degree
Y
x
0
45
90
Y
x
0
45
90
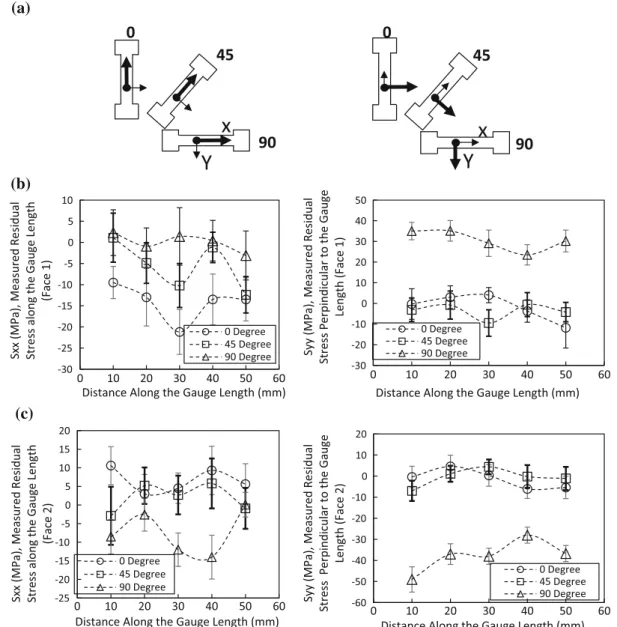
Figure 3 a Schematic illustration of the direction of tensile
specimens with respect to the RD and the highlighted directions of
the XRD stress measurements with bold arrows, b and
c distribution of residual stresses along and perpendicular to the gauge length for face 1 and face 2, respectively.
Table 1 Details of mechanical properties obtained from the standard tensile tests conducted on samples at different orientations to the RD
of the as-received sheet
Direction of sample 0 45 90
Strain rate (1/sec) 0.002 0.01 0.1 0.002 0.01 0.1 0.002 0.01 0.1
E(GPa) 102.0 104.7 103.7 109.8 110.3 110.2 117.8 119.2 119
Elongation, (ef) % 28 26 23 31 27 25 28 24 22
0.2% yield (MPa), (r0.2) 301 309 332 342 367 394 407 418 452
Figure6b shows the results of interrupted tensile tests on samples at 90o to the RD, under different strain rates. A consistency can be observed between
the two testing methods, when comparing the results of interrupted tensile tests (Fig.6b) with those of the
(b)
(c)
(a)
0 50 100 150 200 250 300 350 400 450 500
0 0.05 0.1 0.15 0.2 0.25 0.3 0.35
0 0.05 0.1 0.15 0.2 0.25 0.3 0.35
Stress (MPa)
Strain
0 (0.1(1/s))
0 (0.01(1/S))
0 (0.002(1/S))
0 50 100 150 200 250 300 350 400 450 500
0 0.05 0.1 0.15 0.2 0.25 0.3 0.35 0.4
Stress (MPa)
Strain
45 (0.1(1/s))
45 (0.01(1/S))
45 (0.002(1/S))
0 50 100 150 200 250 300 350 400 450 500
Stress (MPa)
Strain
90 (0.1(1/s))
90 (0.01(1/S))
90 (0.002(1/S))
Figure 4 Engineering stress–strain curves measured on CP-Ti50A samples under different strain rates of 0.002, 0.01 and 0.1 s-1, for
samples oriented ata0o,b45oandc90oto the RD.
(a)
(b)
0 50 100 150 200 250 300 350 400 450 500
0 0.05 0.1 0.15 0.2 0.25 0.3 0.35
Stress (MPa)
Strain
0 (0.01(1/S))
45 (0.01(1/S))
90 (0.01(1/S))
Magnified in Figure b
0 50 100 150 200 250 300 350 400 450 500
0 0.01 0.02
Stress (MPa)
Strain
Figure 5 Engineering stress–strain curves obtained from CP-Ti50A samples with different orientations of 0, 45and 90to the RD,
continuous standard tensile tests (Fig. 4) under dif-ferent strain rates.
The elastic regions of the loading stages of all the loading–unloading cycles of the interrupted tensile tests, carried out on two sample orientations of 0and 90 to the RD under 0.01 s-1 strain rate, are super-imposed by translating them to a common coordi-nate, as shown in Fig.7. The slope of stress–strain curve in the elastic region (i.e. Young’s modulus) is reducing with an increase in the level of plastic
Table 2 Material’s constants computed by fitting the measured
stress–strain curves to Hollomon’s empirical equation for different sample orientations of the as-received sheet, tested under 0.01 s-1 strain rate
0 45 90
k 685 559 586
n 0.1451 0.09046 0.0731
(a)
(b)
0 50 100 150 200 250 300 350 400 450 500
0 0.05 0.1 0.15 0.2 0.25 0.3 0.35
Stress (MPa)
Strain
Interrupted- Case 1 Interrupted- Case 2 Standard Tensile
0 50 100 150 200 250 300 350 400 450 500
0 0.05 0.1 0.15 0.2 0.25 0.3
Stress (MPa)
Strain
90 (0.1(1/s))
90 (0.01(1/s))
90 (0.002(1/s))
Figure 6 a Engineering stress–true strain curves for two
inter-rupted (i.e. sequential loading–unloading) tests on samples at 0to the RD and under the strain rate of 0.002 s-1, in which the data for
deformation. This measurable degradation in Young’s modulus is appeared to be orientation dependent, as it is more pronounced for the samples at 90to the RD (see Fig.7b) compared to those at 0 the RD (see Fig.7a).
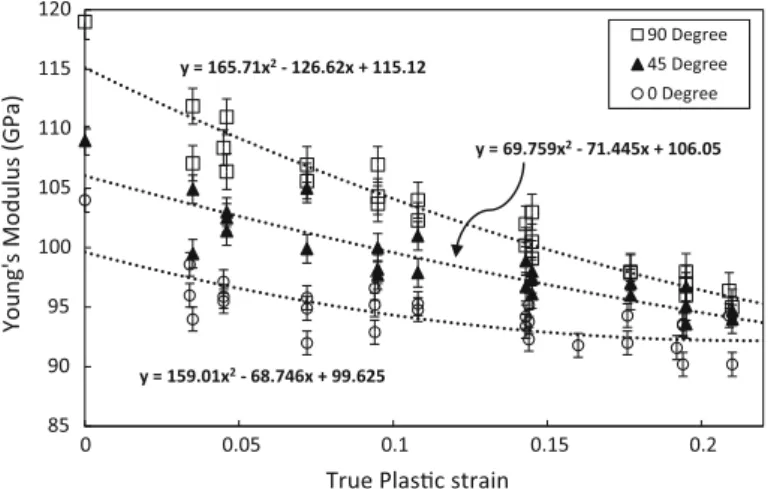
The results of interrupted tensile tests on samples with different orientations to the RD showed differ-ent levels of degradation in Young’s modulus as shown in Fig.7. This is shown in more details by plotting the degradation in Young’s modulus as a function of true plastic strain for samples at 0, 45 and 90to the RD, in Fig.8. For each sample orien-tation in Fig.8, the presented data include the results obtained under all three strain rates (i.e. 0.1, 0.01 and 0.002 s-1), even beyond the ultimate stress. Since the
work hardening behaviour was seen to be influenced by strain rate (see Fig.4), the dependency of the degradation in Young’s modulus on strain rate was explored. Disregarding sample orientation, these results do not show a strong dependency of degra-dation in Young’s modulus on strain rate. Despite the higher initial elastic modulus (&119 GPa), the highest level of degradation in Young’s modulus (&20%) is measured for the samples at 90to the RD compared to those of the samples at 0and 45to the RD. The lowest level of degradation in Young’s modulus is measured for the samples at 0to the RD with almost 13GPa reduction from the initial mea-sured value of 104GPa (i.e.&12%). This is evident in Fig.8 where the slope of reduction in Young’s
(a)
(b)
0 50 100 150 200 250 300 350 400 450 500
stress (MPa)
True Strain
0%
5%
10%
15%
20%
0 50 100 150 200 250 300 350 400 450 500
0 0.001 0.002 0.003 0.004 0.005 0.006 0 0.001 0.002 0.003 0.004 0.005
Stress (MPa)
True Strain
0% 5% 10% 15% 20%
Figure 7 Engineering stress–true strain curves of the elastic regions of the loading stages of the interrupted tensile tests translated into a
common reference frame, for the samples tested under 0.01 s-1
, and sample orientation ata0to the RD andb90to the RD.
y = 165.71x2- 126.62x + 115.12
y = 69.759x2- 71.445x + 106.05
y = 159.01x2- 68.746x + 99.625
85 90 95 100 105 110 115 120
0 0.05 0.1 0.15 0.2
Y
o
ung'
s Modulus
(G
Pa)
True Plasc strain
90 Degree
45 Degree
0 Degree
modulus rises by changing the sample orientation from 0 to 90 to the RD. All directions exhibited a substantial decrease in Young’s modulus by plastic deformation and reached almost a similar value of 95GPa after&0.2 true plastic strain (Fig.8).
Anelastic strain recovery
The nonlinear anelastic recovery occurs on unloading during each cycle of the interrupted tensile tests where the unloading curve does not appear to follow an expected Young’s modulus linearly considering the degradation in Young’s modulus. As discussed earlier, the Young’s modulus degrades as a function of the level of plastic deformation (see Fig.8).
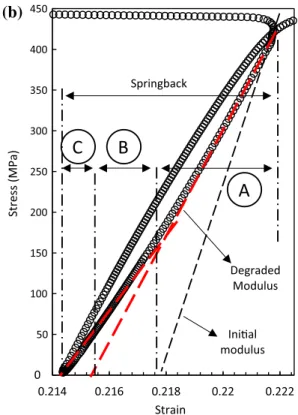
Figure9a, b shows magnified views of unloading– loading stages for two separate loops of an inter-rupted tensile test on a sample at 0 the RD and under strain rate of 0.01 s-1. The unloading curve for loop 1 (see Fig.9a) follows the straight Young’s modulus (&105GPa) line on unloading down to just below 200 MPa stress and then deviates from the elastic recovery line by an additional nonlinear recovery. This type of nonlinear recovery was
observed for all steps during the interrupted tensile tests.
Figure9b shows a similar nonlinear recovery for loop 4 of the same test. For all cases, the anelastic recovery occurred when the stress dropped below &150 MPa on unloading. A noticeable reduction in the final strain, expected based on the initial Young’s modulus, was measured on complete unloading. The total springback (i.e. strain recovery) on unloading can then be divided into three segments caused by elastic recovery (considering initial value), degradation in Young’s elastic modulus and anelastic recovery. These are denoted as A, B and C, respec-tively, in Fig.9b. Hence, the total springback can be formulated as the relationship shown in Eq. (2):
eSpringback¼eAþeBþeC¼
r
E0þeBþeC ð2Þ
where eA, eB and eC are the magnitudes of strain recovered by elastic recovery, degradation in Young’s modulus and anelastic recovery on unloading, respectively. eA, segment A in Figure9b, can simply be computed using the Young’s modulus of the as-received material with no plastic deformation. This
(a)
(b)
0 50 100 150 200 250 300 350 400 450
Stress (MPa)
Strain
Degradaon in modulus due to plasc deformaon
Anelasc Strain Recovery Inial modulus
104.7 GPa
0
50 100 150 200 250 300 350 400 450
0.046 0.048 0.05 0.052 0.214 0.216 0.218 0.22 0.222
Stress (MPa)
Strain
Inial modulus
A
B
C
Degraded Modulus Springback
Figure 9 Typical views of the strain recovery behaviour on
unloading from different levels of plastic deformation for a sample at 0to the RD tested under strain rate of 0.01 s-1,aafter&0.05
can be different for different sample orientations in anisotropic materials such as the CP-Ti material studied in this work (see Table1), in which case the magnitude of computed elastic strain recovery (i.e. segment A in Fig.9b) is not identical for different sample orientations. eB, segment B in Fig.9b, is caused by the degradation in the Young’s modulus as a function of plastic deformation as shown in Fig.8. eC, segment C in Fig.9b, is a springback which is caused by nonlinear strain recovery.
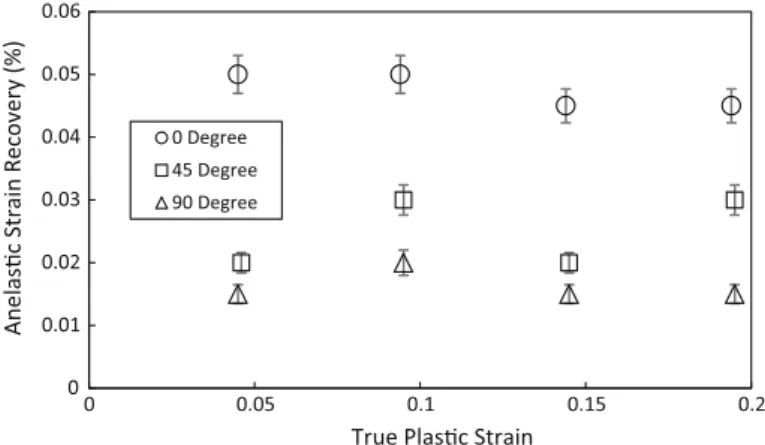
The plot of nonlinear strain recovery (eC) evolution as a function of plastic strain for all sample orienta-tions is shown in Fig.10 for the tests conducted under 0.01 s-1 strain rate. The magnitudes of non-linear strain recovery for the samples at 0oto the RD are observed to be higher by an order of magnitude (&0.0005) than those of the samples at 45and 90to the RD. The magnitudes of anelastic strain recovery for samples at 45and 90to the RD are almost in the same range, with those of the former slightly higher than those of the latter. The magnitude of nonlinear strain recovery as a function of plastic deformation remained almost constant for all directions, under a constant strain rate. Therefore, the magnitude of nonlinear strain recovery appears to be directional dependent with respect to the orientation of the as-received sheet. A similar evaluation approach for all sample orientations under different strain rates of 0.1 and 0.002 s-1showed that the magnitude of nonlin-ear strain recovery is independent of applied strain rate.
As shown in Fig.9, the material shows a complex nonlinear strain recovery behaviour following unloading from stresses corresponding to different
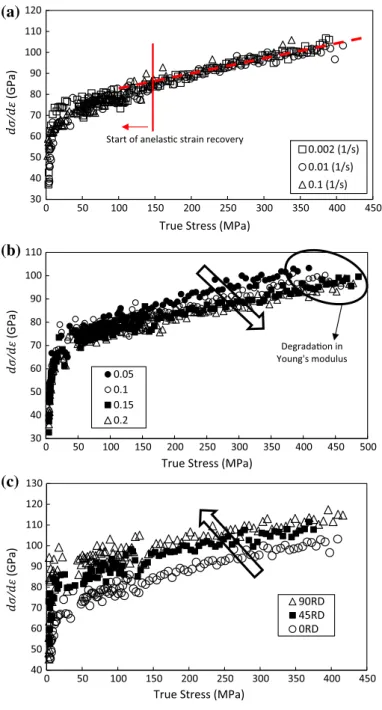
levels of plastic deformation. To further investigate this behaviour, the instantaneous tangent modulus (dr/de) of the unloading segment of the loading– unloading loops for all the interrupted tensile tests are calculated and plotted in a common origin in a same coordinate system. These data are shown in Fig.11a, b and c as functions of true plastic stress to evaluate effects of strain rate, level of plastic defor-mation and sample orientation, respectively. Fig-ure11a shows the results of these calculations for the samples at 0to the RD that were deformed to 0.05 plastic strain under different strain rates of 0.1, 0.01 and 0.002 s-1. For all cases, the instantaneous tangent modulus curve, plotted as a function of true stress, can be divided into two sections of (1) linear, starting from high stress values and ending at &150 MPa, and (2) nonlinear, where the slope of the curves alters drastically with higher gradients. The change in the slope is coinciding with a point where the nonlinear strain recovery is commenced (see Fig. 9), which is typically around 150 MPa stress. Figure11a also shows that disregarding strain rate, the first section of the instantaneous tangent modulus as a function of true stress curve decreases with a similar slope.
Figure11b shows the instantaneous tangent mod-ulus as a function of true stress for different unloading cycles of an interrupted tensile test. A decrease in the slope of the initial linear section of the instantaneous tangent modulus is observed with an increase in the level of plastic strain (see Fig.11b). However, the slopes of these curves at lower levels of true stress are identical for all different levels of plastic strains. This behaviour is in a good agreement with the observed degradation in Young’s modulus 0
0.01 0.02 0.03 0.04 0.05 0.06
0 0.05 0.1 0.15 0.2
Anelasc Strain Recovery (%)
True Plasc Strain
0 Degree
45 Degree
90 Degree
Figure 10 Anelastic strain recovery of samples with different orientations with respect to the RD as a function of true plastic strain and
as a function of plastic deformation discussed earlier (see Fig.8). Figure11c shows the instantaneous tan-gent modulus curves as a function of true stress for tests conducted on different sample orientations under the same strain rate of 0.01 s-1. These data are only shown for the first loop of the interrupted tensile tests, where the samples were deformed to 0.05 true
plastic strains. The data suggest that the slope of the instantaneous tangent modulus increases by chang-ing the sample orientation from 0to 90 to the RD. This is primarily due to the fact that the initial Young’s modulus of the material at 90to the RD is higher than that of the sample at 0 to the RD (see Table 1).
(a)
30 40 50 60 70 80 90 100 110 120
0 50 100 150 200 250 300 350 400 450
(GPa)
True Stress (MPa)
0.002 (1/s)
0.01 (1/s)
0.1 (1/s)
Start of anelasc strain recovery
(b)
(c)
30 40 50 60 70 80 90 100 110
0 50 100 150 200 250 300 350 400 450 500
(GPa)
True Stress (MPa)
0.05 0.1 0.15 0.2
Degradaon in Young's modulus
40 50 60 70 80 90 100 110 120 130
0 50 100 150 200 250 300 350 400 450
(GPa)
True Stress (MPa)
90RD 45RD 0RD
Figure 11 Evolution of instantaneous tangent modulus (dr/de) as
a function of true stress during unloading stage of interrupted tensile tests carried out on CP-Ti50A.aSamples aligned with the RD underwent 0.05 true plastic strain under different strain rates. bSample 0to the RD subjected to different levels of true plastic strain (i.e. different loops of the same interrupted tensile test) under
constant strain rate of 0.01 s-1. Note that the data for unloading stage of all loops are transferred to a common coordinate system with the same origin. cSamples with different orientations with respect to the RD underwent 0.05 true plastic strain with constant strain rate of 0.01 s-1
Discussion
In-plane springback in CP-Ti50A
The titanium used in this study exhibited anisotropic mechanical behaviours for different sample orienta-tions with respect to the RD, as shown in Fig.5. This heterogeneity in the mechanical behaviour as func-tions of sample orientation and strain rate will con-sequently influence the final springback, following sheet forming processes. The experimentally mea-sured residual stresses, shown in Fig.3, indicate the existence of negligible residual stress in the manu-factured samples prior to the mechanical testing. This agrees with the assumption that the measurement of springback has not been influenced by residual stress.
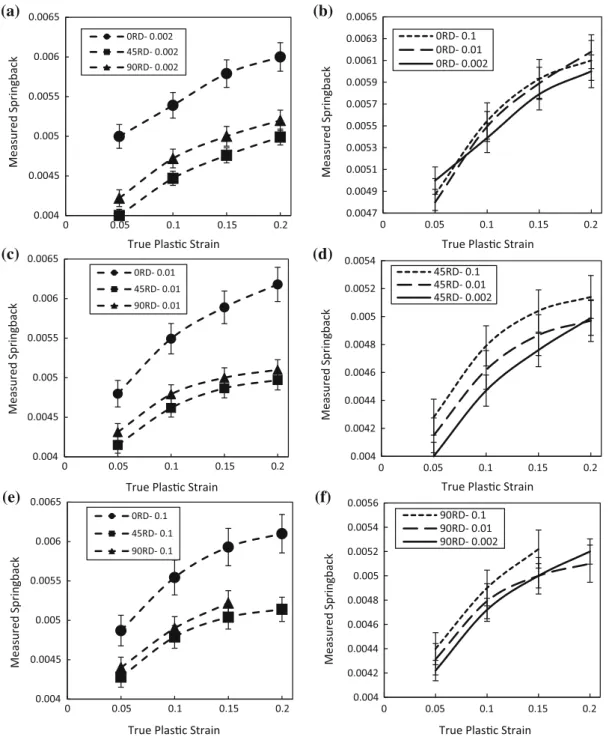
The measured springback during unloading, using both DIC and external extensometer, has been eval-uated for all samples to understand the effect of sample orientation and strain rate on springback during uniaxial tensile tests. Figure12a, c, e shows the variation of measured springback as a function of plastic deformation on samples with different orien-tations to the RD, under constant strain rates of 0.002, 0.01 and 0.1 s-1, respectively. Overall, the level of springback is increased with higher levels of plastic deformation for all sample orientations. The samples at 45 and 90to the RD show lower magnitudes of springback compared to those at 0 to the RD. The origin of this significant difference is in the higher nonlinear strain recovery of the samples aligned with the RD, as shown in Fig.10. The order of variation in springback between different sample orientations remains approximately the same for all the applied strain rates. The influence of strain rate on springback is shown in Fig.12b, d and f, respectively, for sam-ples at 0, 45 and 90 to the RD. Overall, it can be seen that the springback increases for all sample orientations by an increase in the strain rate.
The results presented in Fig. 12are in line with the findings reported elsewhere for different materials [25–27]. It was argued by Kulkarni and Prabhakar [27] that strain rate dependency of springback is different for different materials. This is discussed for two types of aluminium alloys where type 2024-T3 was more sensitive to strain rate compared to type 2024-O. For the CP-Ti-50A material used in this study, strain rate sensitivity was observed (see Fig.12). The specimens at 45to the RD showed the
highest sensitivity to strain rate (see Fig. 12d) com-pared to those of the samples at 0 and 90 (see Fig.12b, f) which are almost half in magnitude.
Springback characterisation
The results of the present study show that in addition to material’s anisotropic mechanical properties and strain rate dependency, the degradation in Young’s elastic modulus as a function of plastic deformation and also the anelastic strain recovery are crucially important factors in predicting springback. These are shown schematically in Fig. 13, where segments A, B and C represent different parts of springback, as illustrated in experimentally in Figure9. Therefore, accurate prediction of springback in this material requires several considerations that are discussed in the following.
1. Strain rate dependency of the flow behaviour of the material [15,25–27]: as shown in Fig. 4, the Ti-50A grade used in this study showed a noticeable strain rate dependency. During sheet metal forming processes, depending on the complexity of the desired geometry, the material undergoes heterogeneous plastic deformation with different strain rates [15,25–27]. This can influence spring-back as shown experimentally over a wide range of strain rates and for different sample orienta-tions in Fig.12.
3. Anelastic strain recovery (i.e. segment C in Fig.13) during unloading [6, 14, 18]: In the present study, it was shown that the anelastic strain recovery contributed&10% in the total springback for samples at 0o to the RD. The presented results suggest that this behaviour is orientation dependent (see Fig.10). Neglecting
segment C in Fig.13 (i.e. anelastic recovery) would result in inaccurate estimation of spring-back, as this has not often been considered in existing studies on springback reported in the literature [1,8,9,11].
4. Anisotropic material behaviour: as shown in Fig.12, different levels of springback occurred
(b)
(a)
(d)
(c)
(e)
(f)
0.004 0.0045 0.005 0.0055 0.006 0.0065
Measured Springback
True Plasc Strain
0RD- 0.002
45RD- 0.002 90RD- 0.002
0.0047 0.0049 0.0051 0.0053 0.0055 0.0057 0.0059 0.0061 0.0063 0.0065
Measured Springback
True Plasc Strain
0RD- 0.1 0RD- 0.01 0RD- 0.002
0.004 0.0045 0.005 0.0055 0.006 0.0065
Measured Springback
True Plasc Strain
0RD- 0.01
45RD- 0.01
90RD- 0.01
0.004 0.0042 0.0044 0.0046 0.0048 0.005 0.0052 0.0054
Measured Springback
True Plasc Strain
45RD- 0.1 45RD- 0.01 45RD- 0.002
0.004 0.0045 0.005 0.0055 0.006 0.0065
Measured Springback
True Plasc Strain
0RD- 0.1
45RD- 0.1
90RD- 0.1
0.004 0.0042 0.0044 0.0046 0.0048 0.005 0.0052 0.0054 0.0056
0 0.05 0.1 0.15 0.2 0 0.05 0.1 0.15 0.2
0 0.05 0.1 0.15 0.2 0 0.05 0.1 0.15 0.2
0 0.05 0.1 0.15 0.2 0 0.05 0.1 0.15 0.2
Measured Springback
True Plasc Strain
90RD- 0.1 90RD- 0.01 90RD- 0.002
Figure 12 Measured springback during unloading stage of
inter-rupted tensile tests, as a function of true plastic strain, fora,cand econstant strain rates and different sample orientations (i.e. 0, 45
for different sample orientations. These results are in agreement with a number of studies evaluated the effects of anisotropic mechanical properties on springback [7,28–30]. Therefore, it is imperative to consider materials anisotropic behaviour, to estimate springback accurately. The anisotropic materials behaviour and the mea-sured decrease in the Young’s modulus with a progress of plastic deformation are due to the presence of relatively strong texture and pre-ferred crystallographic orientation of the CP-Ti material used in this study. The IPF coloured EBSD map (see Fig.1) shows a fairly strong alignment of {0001} poles, i.e. the c-axis of the HCPaunit cell, towards TD as suggested by the presence of dominant red (or close to red) coloured grains within the microstructure. As shown in Fig.1c, the {0001} poles are oriented along a direction at±(25–30) from the ND towards the TD and perpendicular (i.e. at 90 angle) to the RD. This explains the difference in the measured Young’s modulus for the sample orientation at 0to the RD compared to that at 90 to the RD (see Table1). Nevertheless, anisotropic mechanical behaviours are expected for textured titanium, especially at room temperature. Fur-thermore, noticeable difference also exists for the 0.2% proof strength, whilst the ductility is not strongly influenced by texture at room tempera-ture (see Table1).
Chord modulus
As discussed, the occurrence of springback in uni-axial direction consists of two sections of linear (i.e. elastic strain recovery) and anelastic strain recovery (see Fig.13). Recent studies [5–7, 9, 10, 13, 14, 24] have shown that Chord modulus, that is the slope of a straight line connecting the start and end points of the unloading curve (see Fig.13), is a good estimation of average springback including both the degradation in Young’s modulus and anelastic strain recovery. Chord modulus has been used in springback pre-diction models based on finite element analyses [5, 10, 14], and the results were more closer to the experimentally measured springback. A similar approach was implemented by Chen et al. [5] where four separate values were considered for elastic modulus to describe the changes throughout a load-ing–unloading loop. These four values were the slopes of the stress–strain curves at the beginning and the end of loading and unloading curves, denoted as E1, E2, E3 and E4, respectively. It was argued that E1 and E3, and E2 and E4 are almost identical, and the Chord modulus is very close to the average of all these four quantities [5].
Chord modulus is computed for the interrupted tensile tests conducted in this study, and the results are shown in Fig. 14 along with the measured Young’s modulus as functions of plastic deformation. Figure14 shows the data for 0 and 90 to the RD sample orientations, as the two extreme conditions of
Figure 13 Schematic illustration of elastic and anelastic strain
recovery during applied load removal leading to springback. The
degradation in Young’s elastic modulus has also been
degradation under different strain rates. The initial value for Chord modulus at no plastic deformation is assumed to be equal to normal Young’s modulus. As shown in Fig.14, the Chord modulus was measured to be lower than Young’s modulus at similar level of plastic deformation. This is due to the lower slope of the unloading curve caused by anelastic strain recovery (see the schematic in Fig.13). Similar trend of degradation is observed for Chord modulus as that of the Young’s modulus, with a progress of plastic deformation. Also, similarly to the Young’s modulus, the degradation in Chord modulus appears to be independent of strain rate. Similar observations have been reported for different materials [5,8,14].
Modelling in-plane springback
Finite element analyses were performed to simulate the uniaxial tensile testing using experimental data obtained in this study, to predict springback upon removing load after certain level of plastic deforma-tions. Data obtained for different sample orientations (see Fig.4 and Table1) were used to evaluate the magnitude of springback in different orientations. The material behaviour is modelled by implementing the flow curves of material in the format of true stress–true plastic stain for each strain rate. A similar procedure was applied for each sample orientation. In these simulations, the degradation in Young’s modulus has been taken into consideration. The applied boundary conditions were in a way that one side of the uniaxial sample was restricted to move in vertical direction (i.e. Y) and free to move in hori-zontal direction (i.e. X). Extension in the gauge length that was aligned with the Y direction was applied
through displacements to the top edge of the uniaxial sample along Y. The degradation of Young’s modu-lus as a function of plastic deformation (see Fig.8a was implemented using a USDFLD subroutine. Simulations were also performed to predict spring-back by taking the calculated Chord modulus (Fig.14) into account instead of Young’s modulus. These simulations were conducted in ABAQUS by using 8-node linear brick (C3D8) element type.
Figure15a and b, respectively, shows the results of simulations for two sample orientations of parallel and perpendicular to the RD, under applied strain rate of 0.01 s-1. The experimentally measured springback data are also provided for the aid of comparison. The results are also shown for the sim-ulations with and without considering the degrada-tion in elastic modulus and those with considering the Chord modulus. It can be seen, for both sample orientations, without considering the degradation in Young’s modulus in the simulations, the predicted springback is significantly lower than the experi-mental results. On the other hand, by considering the degradation in Young’s modulus as a function of plastic deformation in the simulation, the predicted springback is improved. However, there is still a gap between the results of prediction models and the experimentally measured springback. This can be due to the observed nonlinear strain recovery (see Fig.10) that has not been taken into consideration in the prediction model. In an attempt to consider both the degradation in Young’s modulus and anelastic strain recovery in the simulation model, Chord modulus was implemented. Note that the degrada-tion in Chord modulus with a progress of plastic
(a)
(b)
80 85 90 95 100 105 110
Elasc Modulus
(GPa)
True Plasc strain
E, 0.1 (1/s) E, 0.01 (1/s) E, 0.002 (1/s) Ec, 0.1 (1/s) Ec, 0.01 (1/s) Ec, 0.002 (1/s) Young's Modulus
Chord Modulus
90 95 100 105 110 115 120
0 0.05 0.1 0.15 0.2 0.25 0 0.05 0.1 0.15 0.2 0.25
Elasc Modulus
(GPa)
True Plasc strain
E, 0.1 (1/s) E, 0.01 (1/s) E, 0.002 (1/s) Ec, 0.1 (1/s) Ec, 0.01 (1/s) Ec, 0.002 (1/s) Young's Modulus
Chord Modulus
Figure 14 Degradation in Young’s modulus and Chord modulus as a function of true plastic strain for tests conducted under different
deformation, as shown in Fig.14, is also considered. By repeating the simulations on these bases, the results of FE predictions become significantly closer to the results of measured springback. Similar improvements in the predicted data were observed for other sample orientations and applied strain rates. This shows that the springback can be evaluated with reasonably small uncertainties when considering the Chord modulus. However, due to the anelastic behaviour, the linear unloading section cannot be estimated accurately with Chord modulus. This will be also pronounced for complex forming process (i.e. sheet forming process) where different locations of the part are at different stress status.
Conclusions
In this study, detailed analyses of degradation in Young’s elastic modulus and anelastic strain recovery as functions of plastic deformation, along with ani-sotropic mechanical behaviours in a commercially pure titanium type CP-Ti50A, were investigated. The major purpose of this study was to identify the fac-tors contributing into springback during sheet metal forming, and the major observations are concluded as follows:
• Degradation in Young’s modulus is observed as a function of plastic deformation which is depen-dent on sample orientation and independepen-dent of strain rate. The highest level of degradation in Young’s modulus was measured to be&20% for
samples perpendicular to the RD compared
to&13% for those aligned with RD.
• Anelastic strain recovery, that is an element of springback, was observed during unloading which is directional dependent. The highest level of anelastic strain recovery (&10% of the total springback) was measured for the samples with their length along the RD.
• The magnitude of anelastic strain recovery is almost equal to the level of strain recovery caused by the degradation in Young’s modulus as a function of plastic deformation.
• The level of measured total springback differs for different directions and increases by increasing strain rate during plastic deformation.
• The Chord modulus is found to be more efficient in predicting springback, especially for uniaxial loading–unloading tests. This modulus is able to reasonably estimate the strain recovery caused by both the degradation in Young’s modulus and also the anelastic strain recovery. However, Chord modulus is not efficient in predicting the elastic recovery (segments A and B) only.
Acknowledgements
The authors would like to acknowledge the support provided by the Advanced Forming Research Centre (AFRC), University of Strathclyde, and valuable advice from TIMET. This research is financially supported by TIMET, Rolls Royce, Boeing, Bifrangi and Aubert&Duval.
(a) (b)
0.004 0.0045 0.005 0.0055 0.006 0.0065
Measured Springback
True Plasc Strain
Experiments FEA- Inial E FEA- Degradaon in E FEA- Chord Modolus
0.0035 0.004 0.0045 0.005
0.04 0.09 0.14 0.19 0.04 0.09 0.14 0.19 0.24
Measured Springback
True Plasc Strain
Experiments FEA- Inial E FEA- Degradaon in E FEA- Chord Modulus
B: Degradaon in E
Figure 15 Comparison between experimentally measured
spring-back and the results of FE simulations. The FE simulations are carried out with and without considering the degradation in
Young’s modulus and also with Chord (EChord) modulus.aSamples
Open Access This article is distributed under the terms of the Creative Commons Attribution 4.0 International License (http://creativecommons.org/ licenses/by/4.0/), which permits unrestricted use, distribution, and reproduction in any medium, pro-vided you give appropriate credit to the original author(s) and the source, provide a link to the Crea-tive Commons license, and indicate if changes were made.
References
[1] Luo L, Ghosh AK (2003) Elastic and inelastic recovery after plastic deformation of DQSK steel sheet. J Eng Mater Technol 125(3):237
[2] Eglin JC, Gouty O, Joanna D (1996) Shape and process parameters optimization for the accurate control of spring-back in sheets metal forming. In: Sheet metal, vol 2. University of Twente, Enschede, pp 3–14
[3] Joannic D (998) Modelisation mecanique et simulation du retour elastique en emboutissage des toles minces et opti-misation parametrique. Ph. D. thesis, Universite´ de Franche-Compte´, Besanc¸on
[4] Burchitz IA (2008) Improvement of springback prediction in sheet metal forming. Netherlands Institute for Metals Research, Delft
[5] Chen Z, Gandhi U, Lee J, Wagoner RH (2016) Variation and consistency of Young’s modulus in steel. J Mater Process Technol 227:227–243
[6] Chen Z, Bong HJ, Li D, Wagoner RH (2016) The elastic– plastic transition of metals. Int J Plast 83:178–201
[7] Mendiguren J, Corte´s F, Go´mez X, Galdos L (2015) Elastic behaviour characterisation of TRIP 700 steel by means of loading–unloading tests. Mater Sci Eng A 634:147–152 [8] Cleveland R, Ghosh A (2002) Inelastic effects on springback
in metals. Int J Plast 18(5):769–785
[9] Pe´rez R, Benito JA, Prado JM (2005) Study of the inelastic response of TRIP steels after plastic deformation. ISIJ Int 45(12):1925–1933
[10] Abvabi A, Mendiguren J, Kupke A, Rolfe B, Weiss M (2016) Evolution of elastic modulus in roll forming. Int J Mater Form 10(3):463–471
[11] Benito JA, Manero JM, Jorba J, Roca A (2005) Change of Young’s modulus of cold-deformed pure iron in a tensile test. Metall Mater Trans A 36:3317
[12] Evans M (2008) Measuring the predictive accuracy of var-ious models of formability of Corus Tubular Blanks. J Mater Sci 43(8):2562–2573. https://doi.org/10.1007/s10853-008-2472-x
[13] Mendiguren J, Trujillo JJ, Corte´s F, Galdos L (2013) An extended elastic law to represent non-linear elastic beha-viour: application in computational metal forming. Int J Mech Sci 77:57–64
[14] Sun L, Wagoner RH (2011) Complex unloading behavior: nature of the deformation and its consistent constitutive representation. Int J Plast 27(7):1126–1144
[15] Kim H, Kim C, Barlat F, Pavlina E, Lee M-G (2013) Non-linear elastic behaviors of low and high strength steels in unloading and reloading. Mater Sci Eng A 562:161–171 [16] Mendiguren J, Corte´s F, Galdos L, Berveiller S (2013) Strain
path0s influence on the elastic behaviour of the TRIP 700
steel. Mater Sci Eng A 560:433–438
[17] Ma L, Ricker RE (2005) Effect of plastic strain on modulus and springback predictions of an aluminum alloy. In: 11th international symposium on plasticity. Kauai, Hawaii, pp 121–123, 4–8 Jan
[18] Yu HY (2009) Variation of elastic modulus during plastic deformation and its influence on springback. J. Mater Des 30:846–850
[19] Xue X, Liao J, Vincze G, Pereira AB, Barlat F (2016) Experimental assessment of nonlinear elastic behaviour of dual-phase steels and application to springback prediction. Int J Mech Sci 117:1–15
[20] Andar MO, Kuwabara T, Yonemura S, Uenishi A (2010) Elastic-plastic and inelastic characteristics of high strength steel sheets under biaxial loading and unloading. ISIJ Int 50(4):613–619
[21] Wang H, Yan Y, Wan M, Wu X (2012) Experimental investigation and constitutive modeling for the hardening behavior of 5754O aluminum alloy sheet under two-stage loading. Int J Solids Struct 49(26):3693–3710
[22] Zang S, Lee M-G, Sun L, Kim JH (2014) Measurement of the Bauschinger behavior of sheet metals by three-point bending springback test with pre-strained strips. Int J Plast 59:84–107
[23] Munitz A, Kaufman MJ (2013) Springback and anelasticity of mg alloys measured in three-point bending. J Mater Sci 48(15):5361–5372. https://doi.org/10.1007/s10853-013-7331-8
[24] Lee K-H, Kim Y-J, Jerng DW, Ainsworth RA, Dean D (2013) Creep elastic follow-up factors under combined pri-mary and secondary stresses. Int J Press Vessel Pip 101:12–22
[25] Ghosh AK (1977) The Influence of strain hardening and strain-rate sensitivity on sheet metal forming. J Eng Mater Technol 99(3):264–274
commercially pure titanium in a stretch forming operation. Key Eng Mater 639:107–114
[27] Kulkarni P, Prabhakar S (2003) Influence of the effect of strain rates on springback in aluminum 2024 (ISO AlCu4Mg1). In: 4th European LS-DYNA users conference, vol 2024. pp 27–34
[28] Gomes C, Onipede O, Lovell M (2005) Investigation of springback in high strength anisotropic steels. J Mater Pro-cess Technol 159(1):91–98
[29] Alexandrov S, Hwang Y-M (2009) The bending moment and springback in pure bending of anisotropic sheets. Int J Solids Struct 46(25):4361–4368
[30] Nguyen V, Thomson P, Chen Z (2015) Prediction of springback in anisotropic sheet metals: the effect of orien-tation and friction. Proc Inst Mech Eng Part L J Mater Des Appl 229(6):503–510
[31] ASTM E8/E8M-11 (2012) Standard test methods for tension testing of metallic materials
[32] ASTM E111-04 (2010) Standard test method for Young’s modulus, tangent modulus, and chord modulus. Practice, vol 3, no. Reapproved 2010, pp 1–7
[33] Fitzpatrick ME, Fry AT, Holdway P, Kandil FA, Shackleton J, Suominen L (2005) Determination of residual stresses by X-ray diffraction—Issue 2. National Physical Laboratory, Teddington, UK