Automated in-core image generation from video to aid
visual inspection of nuclear power plant cores
Paul Murray*, Graeme West, Stephen Marshall, Stephen McArthur
Dept. Electronic and Electrical Engineering, University of Strathclyde, 204 George Street, Glasgow,
G1 1XW corresponding author* email: paul.murray@strath.ac.uk phone: +44 (0) 141 548 2502
Abstract –
Inspection and monitoring of key components of nuclear power plant reactors is an essential activity for understanding
the current health of the power plant and ensuring that they continue to remain safe to operate. As the power plants age,
and the components degrade from their initial start-of-life conditions, the requirement for more and more detailed
inspection and monitoring information increases. Deployment of new monitoring and inspection equipment on existing
operational plant is complex and expensive, as the effect of introducing new sensing and imaging equipment to the
existing operational functions needs to be fully understood. Where existing sources of data can be leveraged, the need for
new equipment development and installation can be offset by the development of advanced data processing techniques.
This paper introduces a novel technique for creating full 360° panorama images of the inside surface of fuel channels
from in-core inspection footage. Through the development of this technique, a number of technical challenges associated
with the constraints of using existing equipment have been addressed. These include: the inability to calibrate the camera
specifically for image stitching; dealing with additional data not relevant to the panorama construction; dealing with
noisy images; and generalising the approach to work with two different capture devices deployed at seven different
Advanced Gas Cooled Reactor nuclear power plants. The resulting data processing system is currently under formal
assessment with a view to replacing the existing manual assembly of in-core defect montages. Deployment of the system
will result in significant time savings on the critical outage path for the plant operator and will result in improved
visualisation of the surface of the inside of fuel channels, far beyond that which can be gained from manually analysing
the raw video footage as is done at present.
Keywords- Visual inspection, image stitching, nuclear power generation, nuclear safety.
ABBREVIATIONS
AGR Advanced Gas-cooled Reactor
SIFT Scale-Invariant Feature Transform
1 INTRODUCTION
Many of the world’s nuclear power plants are approaching, or have exceeded their initial
design lifetimes. These initial lifetimes were based on conservative estimates of degradation,
and there is the opportunity to extend the operational lifetimes of these plants. In the US for
example, there is the Light Water Reactor Sustainability (LWRS) program which is looking
to support the operation of the fleet of light water reactors to 60 years and beyond. In the UK,
several of the 2nd generation Advanced Gas-Cooled Reactor (AGR) power plants have been
granted lifetime extensions, with a target of an average of 7 years across the fleet [1]. As the
plant components age, there is an increasing need to understand their health and to predict
how they will look in the future to ensure continued safe operation.
Two main methods of providing information to support the case for lifetime extension are 1)
through condition monitoring, where data relating to the health of the plant is gathered during
routine operation, and 2) through inspection, where the plant is shut down and a portion of it
is inspected. As well as the safety requirements, there are financial implications associated
with outages, as each day a UK AGR is operational, equates to approximately £0.5M in
income.
In the case of the AGR plants, the graphite core is a life-limiting component (along with the
boiler systems), and inspection of fuel channels provides insight into the condition of the
core. Each reactor consists of around 300 fuel channels and, at the start of life, only a few
fuel channels (typically four) were inspected. In 2015 this number has risen to 31 for the
oldest plants and the channels to be inspected are selected based on various competing
criteria [2]. This results in an increase in the volume of data that needs to be assessed before
the plant is returned to service, and this assessment lies on the critical outage path. As a
result, the application of automated or semi-automated techniques to aid the processing and
future, this will also facilitate an increased number of channel inspections which could
positively impact any decisions based on economic factors associated with plant inspection.
One approach for improved data handling would be to design and build new inspection tools
which optimize data capture and automatically process the data acquired to provide
sophisticated decision support. However, the development and deployment of new inspection
equipment, particularly that which is to be inserted into the harsh environment of a reactor
core, is very expensive. Leveraging data captured using existing equipment is therefore
desirable as it minimizes additional financial outlay. However, the feasibility and complexity
of this approach is determined by the constraints of the existing data capture process which
may not align directly with the proposed use of the data.
This paper describes the application of advanced signal and image processing techniques to
existing in-core inspection TV footage, with the aim of producing chanoramas - full 360°
panoramas of the inside of the fuel channels. The contributions made in this paper include:
1. integrating the use of a-priori knowledge about the camera pose and position to
overcome issues of the largely featureless surface areas of the graphite core which
restricts the application of more traditional image stitching techniques [3-8]
2. generating these novel chanoramas using data from across the nuclear fleet in the UK
in a reliable, repeatable and timely manner, with minimal human intervention
3. dealing with variation in: camera orientation, illumination, noise and other distortions
which arise from a data capture system with the absence of the ability to calibrate the
camera
4. deployment of software which takes a channel inspection video as an input and
automatically generates a chanorama of the inspected channel as an output, without
More generally, a key contribution of this paper is that we present a technique which makes
significantly better use of an existing data set. The proposed approach allows existing
inspection videos to be rendered and viewed as a single image where the entire fuel channel
inspection video can be seen in the context of the channel itself. The techniques proposed
herein can be applied to any video which is captured in a similar format to that used to
capture the videos used in this study.
The remainder of this paper is laid out as follows: Section 2 describes: the formation of the
AGR cores; the existing inspection techniques; and manual methods for data analysis as well
as highlighting the challenges for automating the image processing. Section 3 provides a brief
summary of related work and, in Section 4, our new system for converting inspection videos
into chanoramas is described in detail. In Section 5 we discuss the results of applying our
techniques to process a number of videos and we compare our images to those produced for
the same channel using the existing manual techniques before concluding in Section 6.
2 INSPECTION OF ADVANCED GAS-COOLED REACTOR CORES
Seven of the nine nuclear power plants in operation in the UK are of the AGR design. The
AGR graphite core is constructed from layers of cylindrical graphite bricks, and each layer
consists of around 300 fuel bricks plus interstitials which are physically keyed together.
Cores generally consist of 11 brick layers, although this varies from plant to plant, and each
of the bricks stands around 800mm tall. The graphite core is configured in this way to form
various channels to accommodate fuel, control rods and control the passage of the CO2 gas
coolant. As well as providing the physical structure for housing the fuel, the core also acts as
a neutron moderator. Under fast neutron irradiation and through the process of radiolytic
oxidation, the properties of the graphite bricks, such as their dimensions, strength and
Young’s modulus all change, and under certain conditions the bricks can crack. Tracking
can provide supporting evidence that indicates the cores are in good condition and remain fit
for purpose.
2.1 Fuel channel inspection and video capture
During an outage, part of the inspection process uses tools named CBIU (Channel Bore
Inspection Unit) and NICIE (New In-Core Inspection Equipment) which are lowered into
each of the AGR fuel channels selected for inspection [12]. These tools are equipped with
various sensors including, a video camera, which are used to acquire data from inside the
channel. Using the tool to record videos of successive vertical scans of the channel wall at
different camera facings with sufficient overlap between the scans ensures that full coverage
of the internal channel surface is obtained. During these scans, detailed measurements of the
channel bore are also recorded. If anything unusual is observed during these scans, such as a
defect in the channel wall, the region of the channel that contains the defect is revisited, and
additional video data known as “crack following footage” is recorded. This additional footage
is gathered solely for the purpose of manually generating montages which are used to assess
and quantify the defect, and no further bore measurements are taken.
2.2 Existing Data Analysis Techniques
At present, all data analysis is performed manually by an expert operator. As a result, the
existing manual montage generation process is time-consuming and labor-intensive, requiring
suitable frames to be identified and extracted from the footage and manually assembled into
the montage using third party image manipulation software. The resulting montages are
assessed along with other measurements taken during the inspection to make a qualified
statement to support return to service of the plant. The method proposed in this paper for
automatically generating chanoramas from just the vertical scans: speeds up the generation of
crack montages; provides additional images of the surrounding area; and removes the need to
re-visit and record the additional crack following footage. This means better crack montages
the existing approach. Furthermore, the automatic approach requires less data to be captured
thus reducing the channel inspection time. This in turn shortens the plant outage duration.
2.3 Video format and challenges for automatic processing
The inspection video consists of a series of vertical scans of the channel at (generally 6)
different orientations. Since the camera has a 70° field of view, these orientations provide a
small amount of horizontal overlap of the scans in the spatial domain and allow the entire
channel to be visually inspected using the camera. At first, automatically processing the video
to produce a stitched image may seem like a trivial task. However, there can be many
variations in the way in which the data is recorded including: changes in illumination and in
camera pose; differences in the order in which the camera is rotated; changes in the scan
direction and in optical configuration; variation in the number of scans recorded; as well as
changes in the physical location of the tool at the beginning and end of each scan. This is not
to mention the presence of image noise and, a lack of distinctive features for use when
aligning images before stitching. The variations in the data format as described often occur
between plants but, in some cases, variations do occur within a set of videos from a single
inspection of one plant. In fact, it is not uncommon to observe illumination changes, and
variations in tool position at the beginning and end of each scan within a single fuel channel
inspection itself. All of these factors present a significant challenge for implementing a
system capable of automatically processing data from all channels at each plant to convert
videos into static images. While a protocol could be implemented for all future data
acquisition, this clearly cannot be applied to data which has already been recorded and the
proposed system must therefore work on historic data in its existing format. In fact, even if a
protocol is prescribed for future data capture, there is no guarantee that it will be followed
3 RELATED WORK
The creation of large montages from multiple images is a technique which is commonplace in
consumer photo editing products [8]. The approach to stitching together a series of images to
form a composite image can be described conceptually by:
𝐼𝑜 = 𝜆𝐷 + (1 − 𝜆)𝐾 (1)
Where Io is the output image, D is the application of domain-independent image stitching
techniques, K is the a-priori knowledge which can be factored in and λ is a value between 0
and 1 representing the balance of these two factors. A λ value of 1 represents no a-priori
knowledge is used in the image stitching process. As λ decreases, more domain specific
knowledge is utilised by adding constraints on how each sub-image can be stitched in the
global image (potentially reducing the calculation overhead). Examples of a-priori
knowledge would include, knowing that all images are taken at the same scale or that they are
all oriented the same way. Or, if some information about the motion path of the acquisition
device is available, more advanced relationships between overlapping images can be
approximated. At the other end of the spectrum, a λ value of 0 means the exact location,
rotation and scale of each sub-image is known and no explicit additional image
transformations need be calculated.
Central to the generation of panoramic images is the need to correctly align the individual
overlapping component images before seamlessly blending them together. In situations where
there is no a-priori knowledge (λ=1), the alignment between overlapping images can often be
estimated from the data itself. There are two main approaches to determine the alignment of
images for automated approaches and these are known in the literature as the direct approach
and the feature based approach [8]. The direct approach performs a comparison of image
pixels in overlapping frames to deduce the geometric relationship, whereas the feature based
alignment prior to stitching. For both methods, it is important that there is sufficient detail in
the images to be aligned. If there is a lot of detail in the images, it is likely that there will be
some distinct features in both of the overlapping images, which can be used to determine
image alignment. Unfortunately this is rarely the case when considering images of the surface
of fuel channel bricks, which tend to be large, grey, featureless surfaces. This issue also arises
in other industrial environments in which visual inspections are performed, e.g. pipes and
storage vessels in the oil and gas sector [13-15]. In such cases, it is often difficult to find
enough distinct feature points in overlapping images that can be used to accurately estimate
image alignment prior to stitching. In the next section, we assess the applicability of the
direct and feature-based approaches and contrast them with a knowledge-based approach,
which makes assumptions about the position of the camera (λ=0) to generate a montage.
4 CONVERTING IN-CORE INSPECTION VIDEOS INTO STATIC IMAGES
In our application, there is some knowledge about the data capture process used when
recording each video. For example, the direction of the camera motion is generally known,
the tool speed is assumed to be constant, and the camera facing for each vertical scan of the
channel (the camera orientation sequence) can be logged during data capture. There is also a
small amount of metadata embedded within the video in the form of overlay text which is
shown in a frame extracted from one video in Figure 1(a). The video overlay provides
information such as, the name of the plant and channel being inspected, the date and time of
inspection, the tool height within the channel and the camera facing for each vertical traversal
of the channel. Provided the aforementioned information is available, automatically creating
1. the raw video footage is converted into frames
2. the frames are analysed to find the beginning and end of each scan – all frames which
do not belong to a vertical scan are then discarded
3. individual montages of each vertical scan are constructed
4. the resulting vertical scan montages are aligned with each other in a global image
5. the vertical scan images (generally 6) are stitched together to create a chanorama of
the full fuel channel surface.
The video to frame conversion can be achieved using any open source or commercially
available software for this task. As such, the details of this step will not be discussed further
in this paper. Instead, we now focus on explaining the sophisticated signal and image
processing techniques we have designed to analyse the frames extracted from the video in
order to automatically create chanormas.
4.1 Identifying frames corresponding to the beginning and end of scans
When the inspection tool is stationary, the section of the image containing information about
the tool height in the video overlay does not change since the tool is not moving. However,
when the tool is being translated vertically within the channel, the tool height (obviously)
changes, and so does the section of the image displaying this information in the overlay. The
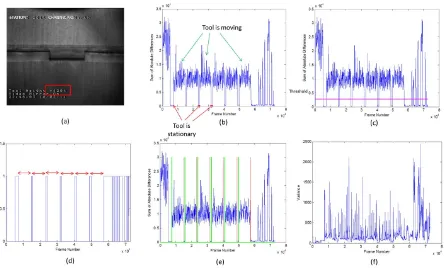
region of the image which contains the tool height information is highlighted in Figure 1(a).
A simple solution would be to analyse this height data to identify the individual channel
scans based on rates of change or some other suitable technique. However, the height data is
not recorded separately and the only way to obtain it would be to use Optical Character
Recognition [16] to extract it from individual frames in the video.
A simpler solution is therefore to extract the region of the image containing the tool height
value from each frame in the video and threshold it (to convert it to binary) [17], before
successive frames. If applied to an entire video sequence, this process produces a video
[image:10.595.78.522.124.392.2]summary profile like the one shown in Figure 1(b).
Figure 1 Detecting the beginning and end of each scan (a) Image with tool height information highlighted (b) Video summary profile (c) Video summary profile and threshold value overlaid (d) Binary signal where “ON” means tool is stationary – red arrows highlight points which are separated by the expected distance of a scan (e) Start points (green impulses) and end points (red impulses) overlaid on video summary profile (f) Variance profile for the same video.
In practice, not all frames need to be used to create a video summary profile. In fact, the one
shown in Figure 1(b) was computed using every 20th frame to reduce processing time. In the
video summary profile, relatively high values (large differences) indicate that the tool is
moving, and, conversely, relatively low values (little differences) indicate that the tool is
stationary. By automatically analysing video summary profiles like the one shown in Figure
1(b), it is possible to identify frames in which the tool starts and stops moving and,
subsequently, to detect the frames which correspond to the beginning and end of each scan.
The first step in the automatic analysis is to smooth the video summary profile before
thresholding [17, 18] it to extract local minima corresponding to frames in which the
inspection tool is stationary. This concept is demonstrated in Figure 1(c) which shows the
applying this threshold is shown where “on” values indicate the tool is stationary. By
computing the distance between these points in the resultant binary signal shown in Figure
1(d), and searching for those points that are some fixed distance, equivalent to the length of
each scan apart, it is possible to extract the frame numbers which correspond to the beginning
and end of each scan. This is demonstrated in Figure 1(d) where there are 7 “on” points
(pulses) separated by roughly the same fixed distance in the binary signal. If the distance
between these points lies within the range of the expected number of frames between each
scan in the video, it is likely that these points denote the beginning and end frame of each
scan. These frame numbers can therefore be extracted as candidate start and stop points as
shown in Figure 1(e).
One drawback with relying solely on the distance between the detected points is that any two
stoppages of the tool which happen to be separated by the same distance as that expected for
a scan will be detected as such and corresponding start and stop points will be computed. For
example, if the time taken for the tool to enter the channel and reach the bottom (while the
forward facing camera is recording) lies within the expected time frame for a scan, this region
of the video would be detected using the algorithm described. To improve our confidence that
the points detected by the algorithm do in fact correspond to the channel scans, a second
video summary profile can be computed and analysed. This second summary profile is
computed by finding the variance, 𝜎2 = ∑ (𝑥𝑖−𝜇)
2
𝑁 𝑁
𝑖=0 , of pixel intensities within a small
window (corresponding to the pixels which change between frames) of successive frames,
where xi denotes an image pixel, µ is the mean of the image and N is the number of pixels in
the image. The variance profile for the channel used here for demonstration is shown in
Figure 1(f).
Spikes in the variance profile correspond to regions of change e.g. brick interfaces (where
generally darker than their surroundings. In situations where more than the desired number of
scans is detected, the scans with the fewest peaks in the corresponding region of the variance
profile are rejected. Rejecting candidate start and stop points based on the number of peaks in
the variance profile (assuming that a scan should contain brick interfaces) allows the correct
start and stop points to be retained for further processing.
4.2 Stitching vertical strips for channel scans
The first step in processing the individual frames of the video is to remove the overlay text
since this should not be allowed to affect the results. When the overlay has been cropped
from the source image, this leaves us with a frame size of 620 by 410 pixels. The large
number of frames generated from the video, with a high degree of similarity between
consecutive frames, offers a range of options for constructing a montage depending upon how
much knowledge is utilised in the stitching process. If the assumption is made that the camera
moves at a fixed rate and at a fixed orientation, which is reasonable given the equipment set
up, then the distance moved between successive frames is constant. In our application, the
speed of the camera hoist equates to a vertical shift of 5 pixels between successive frames.
To consider the situation where our assumption of fixed rate and orientation of the camera
was incorrect, we wished to explore the possibility of using either the direct or feature based
approach (see [8] for more details) for the construction of the montage. However, applying
these stitching methods to all the frames immediately caused an issue, as each frame contains
a slightly different view of the same scene where a) the object is not flat, but the inside of a
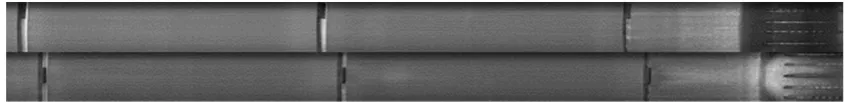
cylinder and b) is illuminated in a non-uniform way. This is illustrated in Figure 2 which
shows a sequence of three frames showing the same feature, a brick interface, taken from the
same small piece of footage. In the first image, the brick interface is slightly above the centre
of the camera in the field of view and is bowed upwards, in the second image the camera and
in the field of view causing a downward bow. Attempting to stitch these three frames to form
a composite image using the standard direct and feature based approaches fails to produce a
satisfactory result, as the curvature of the channel is not taken into consideration. One
approach to tackle this would be to perform a calibration operation on the camera [19].
Techniques for performing this task tend to introduce calibration images or known patterns
into the scene. These are then imaged and used to learn mathematical transformations which
model distortions introduced by the optics of the imaging system and, in this application, the
curvature of the channel. However, as no access to the camera was/is available, traditional
[image:13.595.79.521.319.437.2]techniques for this task were not pursued further.
Figure 2 Screenshots of the same brick interface at three different instances, indicating the effect of the curvature of the fuel channel wall
4.2.1 Full frame abuttal montage generation
If the assumption of fixed rate and position of the camera was made, and given that there is 5
pixels vertical shift between successive frames then, given a frame height of 410 pixels, every
82nd frame could simply be abutted to form a panorama of the channel. This offers the benefit
that the minimum number of frames needs to be extracted from the video and assembled to
form the montage. A typical output using this approach is shown in Figure 3(a) where
stitched images from each camera orientation have been aligned and placed side by side to
show a single brick layer containing a crack. The image quality of the output produced by
other. The undesirable effects of lens distortion and non-uniform illumination are also clearly
visible in the final result achieved when using this approach.
4.2.2 Window extraction and abuttal montage generation
Since the image data is acquired at a rate that is much higher than the speed at which the
camera traverses the channel, there is significant overlap between successive frames. As a
result, the effects of non-uniform illumination and lens distortion across the image shown in
Figure 3(a) can be suppressed by cropping a much smaller window from each and every
frame rather than abutting a large section from every nth frame. Additionally, by selecting the
position of this window to coincide with the point at which the interface and camera align has
the effect of practically eliminating the “bowing” artefacts caused by lens distortion and the
curvature of the channel.
This process is illustrated in Figure 3(b) where the height of the window of pixels cropped
from each frame has been set by the speed of the camera hoist. Building the output image by
stacking small regions cropped from each successive frame generates a high quality image
like the one shown in Figure 3(c) and no blending or other correction process is required to
produce the final result. Furthermore, the effects of lens distortion are less apparent and the
non-uniform illumination is suppressed – particularly in the vertical direction. Alleviating the
need for pre/post processing in this way reduces the time taken to produce stitched images
which are representative of the channel bore without introducing false pixel values in the
blending/correction process. One drawback is that this approach does not account for the
possibility of sub-pixel motion between frames. Instead, we assume that the appropriate
window height which should be extracted from each frame corresponds to an integer number
of pixels. For the application described in this paper, this assumption has been demonstrated
Figure 3 Example of generating 2D stitched image from sequential frames captured during a bottom to top scan from inside the fuel channel. (a) Image produced by abutting non-overlapping frames in global output image (b) Video sequence (3 frames) from which a small region of each frame is extracted and placed in the global output image. (c) Result of building output image of a single brick layer using a 5 pixel high window from the centre of each frame.
4.2.3 Fixing the window height parameter
The camera moves in the vertical direction, therefore, only the height of the window needs to
be defined so that the region which is cropped from the image corresponds directly to those
pixels which have changed between successive frames. In the case of the approach described
here in Section 4.2.2, the window height is fixed by a user based on the speed at which the
camera moves when acquiring the data. While this method provides a robust and efficient
way to create montages of the individual scans of the channel, we also wanted to test how
well more traditional image stitching techniques would perform. For this reason, a direct and
feature based approach were developed and used to compute a suitable value for the window
height based on the estimated image alignment between successive frames. The application
of these direct and feature based approaches was undertaken for comparison purposes and to
demonstrate robustness against variations in camera hoist speed and camera orientation.
4.2.4 A Direct Approach
After cropping out the overlay text in the video sequence, matching regions in successive
frames are identified using cross correlation. Since most of the video contains little detail, an
edge image is computed for each successive frame using the Sobel operator [17] and the
generates a random binary pattern of edges from neighbouring images such that these random
patterns can be matched using cross correlation. By computing the position of the maximum
value in the correlation output, for neighbouring binary images, we can estimate the vertical
shift between these patterns in successive frames. This shift equates to the number of pixels
which have changed between the current frame and the previous frame and can be used as the
window height for producing the stitched strips.
4.2.5 A Feature-based Approach
After cropping out the text overlay, features are computed for neighboring images using SIFT
(Scale Invariant Feature Transform) [20]. SIFT is a robust algorithm for automatically
extracting and describing feature points in image data and is widely used in image stitching
applications. For our purposes, SIFT is applied to neighboring frames and matching points
between these frames are identified. Outliers introduced during the matching process are then
rejected using RANSAC (RANdom Sample Consensus) [21] before the average distance
between the remaining, correctly matched points is computed. RANSAC is another widely
used algorithm in the image stitching community which repeatedly samples the pairs of
matched points and rejects outliers by finding the largest consensus set of points which match
the underlying model. The average distance between the remaining matched points (after
applying RANSAC) is then used as the window height when cropping regions from the
current frame and placing them in the global image to produce the stitched output.
4.2.6 A Knowledge-based Approach
Since the camera is known to travel at a constant speed as it is raised from the bottom of the
channel to the top, the number of pixels which actually change between successive frames as
the camera moves should be constant. With this knowledge, we are able to simply estimate
the optimal window parameters such that it contains only the pixels that have changed
between the current frame and the previous one and fix this height when stitching the entire
measuring (manually using image analysis software) the number of pixels which change
between successive frames. For the knowledge approach, no further calculation of window
height is required. A 5 pixel high window which spans the width of the image is cropped
from each frame and placed in the correct location in the global output image. The window
height can be increased or decreased if the camera moves faster or slower respectively. In
cases where a camera is known to change speed during capture, a model can be developed to
adapt the window height for different sections of the video to avoid repeating or missing data.
4.2.7 Comparison of approaches
Each of the implementations described in the previous sections (except the full frame abuttal
method) were applied to the same data set in order to assess and compare their performance
with frames extracted from the original video. Figure 4 shows crops from the full channel
images produced using each of the three methods for stitching the data alongside a frame
from the original video sequence of the same part of the channel. This section of the channel
contains a vertical bore crack intersecting a brick interface (Figure 4(a)).
Clearly, all three methods accurately reproduce the image of the crack and the brick interface
as seen in the original video frame where approximately 116 frames have been used to
produce the images shown in Figure 4(b), (c) and (d). Furthermore, there is no visible
difference in the image quality produced by each of the three methods. On average, the
knowledge-based approach processes a single frame in 9ms when executed on a PC with a
Core i7-3770 processor and 16GB of RAM. On the same system, the direct approach takes
around 135ms per frame and the feature based approach can take up to 500ms to compute the
height of the window which should be cropped from the current frame. Since there is no
observable difference in the images produced by each method, and since the knowledge
approach is a fast, effective and robust alternative to the more computationally expensive
Figure 4 Comparison of image alignment techniques using 116 frames (a) Original image from video sequence containing a brick interface and a crack. (b) Knowledge approach (c) Direct approach (d) Feature approach
4.3 Aligning the Strips in a Global Output Image
When all six vertical strips have been stitched, they are placed side-by-side and aligned
vertically in a global image before the horizontal alignment and stitching is performed. Since
the vertical strips generally differ in height, it is not sufficient to place them side-by-side
without first computing the optimal vertical alignment between them. An example of three
bricks cropped from the bottom of a pair of overlapping strips (rotated through 90°) is shown
in Figure 5, where the misalignment between brick interfaces is clear.
Figure 5 Two regions of overlapping N and N+60 scans highlighting the misalignment that exists in the brick interfaces when the images are simply placed side by side.
In order to estimate and compensate for the offset between strips, we firstly apply a Sobel
mask, [17], to locate horizontal edges in the overlapping images. This produces a binary edge
image for each strip where, in general, the “on” pixels correspond to the brick interfaces. By
summing each row, these edge images may each be reduced to a 1D profile before computing
the 1D cross correlation of these signals. The best alignment between two overlapping images
is then easily computed by finding the position of the maximum value in the cross correlation
[image:18.595.79.539.72.184.2] [image:18.595.85.511.445.496.2]vertically in the global output image. Figure 6 shows the results of applying this method to
[image:19.595.86.509.137.187.2]the two overlapping stitched images shown in Figure 5.
Figure 6 Result of aligning two overlapping images in a global image using the method described in this section.
4.4 Estimating the Horizontal Overlap between Scans
The final stage in the image stitching process is to estimate the extent of the horizontal
overlap between neighboring scans before shifting the images left/right accordingly to
produce the final chanorama. Since the overlap is not constant between all six scans, and
since it depends largely on the engineer who is manually positioning the camera, the
knowledge approach cannot reliably be used for this task. Instead, we have used SIFT [20] to
extract and match feature points which can be used to estimate the horizontal overlap
between overlapping images. SIFT which was explained briefly in Section 4.2.5 was chosen
due to its accuracy when applied to the problem.
The algorithm for horizontal stitching when applied to a pair of overlapping images can be
summarized as:
Compute SIFT points from overlapping images of vertical scans
Perform matching of SIFT points
Reject outliers using RANSAC
Estimate the extent of the horizontal overlap
Crop the right side of the leftmost image by the horizontal overlap
Shift the rightmost image to the left by the value of the horizontal overlap
As we have explained, a major difficulty for stitching the images captured from inside the
channels of the reactor core is that there is a lack of distinctive features in the data. As a
are extracted, and hence the matches that do occur are often erroneous when two entire strips
are being aligned. Since the strips have already been aligned vertically using the cross
correlation approach described in Section 4.3, it is possible to extend the application of SIFT
by constraining the matching algorithm in order to reduce the likelihood of false matches. For
example, we know that points at the top right of one image cannot possibly match points in
the bottom left of its aligned neighboring image. To prevent such matches from occurring, the
algorithm can be applied to small blocks of each image in turn starting at the top and working
through to the bottom. In this heuristic way of constraining SIFT, we are applying the
algorithm to small overlapping windows where matches are likely to occur and thus forcing
the algorithm to find matches in those regions. This approach is effectively reducing the
value of λ introduced earlier in Equation (1) of Section 3 in order to make more use of the
pre-existing knowledge available about the relationship that exists between overlapping
images of the scene.
Each time the algorithm is applied to extract features and find matches, a histogram of the
horizontal distance between matched points for that image block is computed after RANSAC
has been applied. The result is a number of histograms containing estimates of the horizontal
overlap between the subsections of the images. From each histogram, the most frequent
estimate is selected as the horizontal overlap. A confidence score for this estimate is
computed using:
where CS denotes the confidence score computed from histogram h. The estimate with the
highest confidence is then used as the horizontal overlap for the pair of images in question.
In Figure 7 we have shown an example of a single brick layer cropped from a full channel
image before and after horizontal stitching. Both images have been processed using the
1 max
E h CS
h
stitching technique described in the previous sections and have been aligned using the cross
correlation approach described in Section 4.3. The regions circled in Figure 7 illustrate the
[image:21.595.154.437.163.409.2]capability of the horizontal stitching routine.
Figure 7 Example of horizontal stitching (a) Image before horizontal stitching (b) Image after horizontal stitching
5 RESULTS AND DISCUSSION
The system described in this paper has been applied to data from all 7 AGR plants in the UK.
To date, over 75 full channel images have been generated and the initial results are extremely
promising. One of these full channel images, as well as a zoomed region of this montage, and
three zoomed regions from different full channel images, are shown in Figure 8. The image
shown in Figure 8(a) represents almost one hour of video footage. Shown here as a snapshot,
the inspection footage can be interpreted in a glance, and features like the crack in brick layer
7 (highlighted in the black box in Figure 8(a)), can be identified, located and quantified in the
context of the brick, and with respect to the full channel. A zoomed version of this feature is
cores of the AGRs are some of the first of their kind ever to be seen (some of which were first
[image:22.595.103.494.135.440.2]presented in [9]).
Figure 8 Some results produced using the method described in Section 4 to produce chanoramas from inside AGRs. (a) Chanorama rotated through 90° for visualisation (left of page: top of channel and right of page: bottom of channel). (b) Zoomed region of (a) highlighted to show crack. (c) Bottom region of a channel showing 2.5 brick layers and methane holes. (d) Two brick layers from a different channel. (d) Brick layer with trepanned holes.
We have compared the output of the approach described in this paper with an example of a
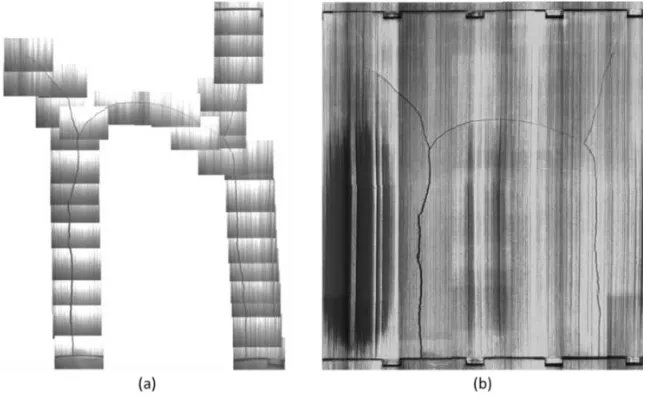
stitched image generated using the existing manual process. The first comparison, shown in
Figure 9, is concerned with the level of core coverage offered by the automatic method when
compared with the manual approach. While the automatic approach generates a chanorama,
the manual approach offers coverage in the region of just 3%-4% of the entire channel. The
comparison shown in Figure 10 is concerned with the resultant image quality when using the
Figure 9 Comparison of the core coverage offered by the manual and automatic method for image stitching. (a) Core coverage offered by manual approach equates to around 25% of a single brick layer which is between 3% - 4% coverage of the full channel. (b) Chanorama - a full channel image offering 100% channel coverage.
Figure 10 Comparison of existing approach with proposed approach for image stitching. (a) Stitched image of defect region (produced manually from the crack following footage). (b) Stitched image of defect region cropped from the chanorama (generated automatically from vertical scan footage using proposed approach).
By visual inspection, it is clear that the quality of the image produced by the automatic
techniques described in this paper is significantly higher than the quality of the image
produced by manual assembly of individual full frames. While both images clearly show the
crack, the result produced by the automatic approach offers a higher quality image which
contains much more information than the one produced with the existing method.
Figure 9 and Figure 10 demonstrate exactly how better use of all data available has the
[image:23.595.136.459.293.492.2]quality when using the automatic approach, is that by taking small strips from each
consecutive frame and stacking these on top of each other, we actually remove the majority
of the non-uniform illumination and saturation that is present in each frame of the video. We
also reduce the effects of lens distortion retrospectively and without camera calibration data
(as this is not available). However, this is not the case when the montages of defect regions
are manually assembled using entire frames from the video. In this situation, the non-uniform
illumination and saturated pixels are widespread throughout the stitched image.
While it is theoretically possible to manually stitch a full channel image from any video
sequence, it is simply not practical to do this. The time required to manually produce images
of cracks and defect regions alone, like the one in Figure 10(a), cannot be quantified in
advance and can take more than a full working day to complete. This time increases
significantly if multiple cracks appear in a single channel since each crack requires a different
stitched image to be produced. On the other hand, the automatic approach can be completed
within 15 – 30 minutes using state-of-the-art PCs to produce images like the ones shown in
Figure 8(a) and Figure 9(b) which offer 100% channel coverage. This time depends only on
the length of the video sequence and hence the number of frames which must be processed.
The number of anomalies in the channel does not affect the time taken to automatically
produce a full channel image. Furthermore, using this approach will alleviate the requirement
to capture crack following footage which would directly reduce the time taken to inspect
channels. Longer term, this should allow more channels to be inspected more frequently and
could lead to the existing nuclear plants operating for longer to provide a reliable source of
energy for the UK.
Due to the minimal time overhead associated with the automatic stitching method, even in
situations where no cracks are found in a channel during inspection, it is useful to generate
experts to study images of fuel channels in more detail and to observe various features of the
channel like never before. For example, expert operators could view and study images of fuel
channels from which samples have been trepanned for testing in the lab to gather data about
the state of the graphite in the core. Furthermore, the effects of dose-end-depression caused
when the fuel is in-situ and the plant is at power, as well as fundamental features of the
graphite itself can also be seen from such images. In addition to this, the images produced
following any inspection can be archived and used for reference in future if any cracks are
found during a repeat channel inspection. Finally, in situations where other measurements
and inspection techniques provide conflicting results about surface defects in a channel,
images like the ones presented here can be readily consulted to confirm or deny the existence
of any anomaly.
In spite of all the benefits we have discussed, it should be noted that there is still a small
amount of non-uniform illumination across each vertical strip image which is generated using
the automatic method. This is observable in all of the stitched images shown in this paper
which have been produced using the techniques described herein. It is this non-uniform
illumination that causes the individual strips to exhibit a “tubing” effect in the final stitched
montage. Techniques for removing this non-uniform illumination by using surface fitting are
currently under investigation.
6 CONCLUSIONS
In this paper, we have presented a novel approach and system for automatically generating
stitched images from videos recorded during in-core inspections of fuel channels in the UK’s
AGR nuclear fleet. We have explained the existing visual inspection and data capture process
and we have highlighted the variations in this which pose challenges for designing a system
to automatically convert the inspection videos into high quality full channel images of fuel
techniques and explained that on obtaining unsatisfactory results when applying existing
state-of-the-art techniques [15] and [13] to our data, we chose to design our own automated
image stitching system for processing AGR inspection videos. We have described our
method in full and demonstrated the high quality full channel images it is able to produce.
The novel approach for image stitching, which uses knowledge relating to the position and
facing of the camera during footage capture has been compared to two other stitching
techniques based on a direct approach and a feature based approach for computing alignment.
Our knowledge based approach was shown to perform as well as the other approaches in
terms of accuracy and image quality, but with the benefits of reduced complexity and
computational running time. In section 5, several full channel images from inside the reactor
core of the AGR were shown and compared with results produced using the existing manual
approach. The full channel images (known as chanoramas) shown here could not practically
have been produced without the method described herein. We have explained the existing
manual approach that is currently used to produce stitched images of defect regions, and we
have demonstrated that in comparison the techniques proposed in this paper offer a
significant improvement in terms of efficiency, image quality and channel coverage.
As the AGR plants grow older, there will be increasing pressure to inspect more channels
more often to provide supporting evidence that plants are safe and reliable for continued
operation. Reducing the time taken to produce stitched montages of defect layers (and the rest
of the channel) using the automatic approach described in this paper is of benefit as this
activity often lies on the critical path during an outage. Also, if over time channels exhibit
multiple defects, the automatic approach (unlike the manual one) will not take any longer to
generate all crack montage images required to return plants to power. In fact, time savings
like this which lie on the critical path could prevent premature closure of healthy plants by
It is also important that the size and condition of any defects in the channel are measured over
time and that any changes can be readily quantified. By using the automated image stitching
techniques described in this paper to produce full channel images, the human element of
manually assembling these images is removed, providing a more robust and repeatable
platform for image generation and subsequent comparison. Looking forward, using the
automatic approach to produce full channel images of the same channel from different
inspections, should allow a direct comparison of any changes in channel condition over time
to be performed.
A software tool based on the method that has been described in this paper is currently being
implemented for deployment at all AGR plants in the UK. The tool is being trialed and used
initially by the expert operators who are currently assembling the defect montages by hand. It
is anticipated that the tool will be used in parallel with the existing manual process until such
times that the automatic approach is fully trusted by plant operators. In addition to
automatically producing full channel images from inspection videos, the tool will highlight
potential defect brick layers to a user and it will aim to automatically detect, locate and
quantify any cracks or other anomalies in the channel. The system will be accompanied by a
database which will allow users to instantly archive and access images which have been
stitched by the tool. Furthermore, by accessing historic images in the database, users will be
able to asses and quantify changes and developments of the channel conditions over time.
ACKNOWLEDGEMENTS
The authors would like to thank EDF Energy for funding this work. Thanks also to Rahul
Summan and Gordon Dobie for various useful discussions about image stitching and camera
REFERENCES
[1] N. Houlton, "Life Extension of the EDF Energy Nuclear Fleet," Nuclear Institute Congress, Manchester, UK, Oct 2013.
[2] C. E. Watson, P. C. Robinson, and P. R. Maul, "The role of data visualisation in core inspection decision making," in Modelling and Measuring Reactor Core Graphite Properties and Performance, G. B. Neighbour, Ed., ed: The Royal Society of Chemistry, 2013, pp. 149-157.
[3] R. Szeliski, "Image mosaicing for tele-reality applications," in Proceedings of the Second IEEE Workshop on Applications of Computer Vision, 1994, pp. 44-53.
[4] H. Bay, A. Ess, T. Tuytelaars, and L. V. Gool, "Speeded-Up Robust Features (SURF)," Computer Vision and Image Understanding, vol. 110, pp. 346-359, Jun. 2008.
[5] H. Bay, T. Tuytelaars, and L. Van Gool, "SURF: Speeded Up Robust Features," in
ECCV, 2006, pp. 404-417.
[6] M. Brown and D. G. Lowe, "Recognising panoramas," in Proc. ICCV 2003, Nice, France, 2003, pp. 1218-1225.
[7] T. Tuytelaars and K. Mikolajczyk, "Local invariant feature detectors: a survey,"
Foundations and Trends in Computer Graphics and Vision, vol. 3, pp. 177-280, 2008. [8] R. Szeliski, "Image alignment and stitching a tutorial," Microsoft Research, Tech.
Rep. MSR-TR-2004-92, Oct. 2004.
[9] P. Murray, G. West, S. Marshall, and S. McArthur, "Automated image stitching for enhanced visual inspections of nuclear power stations," in Proc. CM & MFPT, Krakow, Poland, 2013.
[10] T. Bloodworth, M. Anderson, M. Brown, and J. Williams, "Eddy current inspection of AGR fuel channels: keyway cracks and density mapping," in Proc. NDT, Northamptonshire, UK, 2012.
[11] C. J. Wallace, G. M. West, S. D. J. McArthur, and D. Towle, "Distributed data and information fusion for nuclear reactor condition monitoring," IEEE Trans. Nuclear Science, vol. 59, pp. 182-189, Feb. 2012.
[12] A. Cole-Baker and J. Reed, "Measurement of AGR graphite fuel brick shrinkage and channel distortion," in Management of Ageing Processes in Graphite Cores. vol. 309, G. B. Neighbour, Ed., ed: Royal Society of Chemistry, 2007, pp. 201-208.
[13] G. Dobie, R. Summan, C. MacLeod, and S. Gareth Pierce, "Visual odometry and image mosaicing for NDE," NDT & E International, vol. 57, pp. 17-25, Jul. 2013. [14] R. Summan, "Positioning for mobile NDE inspection platforms," PhD Thesis, Dept.
Electronic and Electrical Engineering, University of Strathclyde, Glasgow, Scotland, 2013.
[15] M. Brown and D. G. Lowe, "Automatic panoramic image stitching using invariant features," International Journal of Computer Vision, vol. 74, pp. 59-73, Aug. 2007. [16] S. Mori, H. Nishida, and H. Yamada, Optical Character Recognition: John Wiley
\& Sons, Inc., 1999.
[17] R. C. Gonzalez and R. E. Woods, Digital image processing. Upper Saddle River, NJ: Pearson Education, 2008.
[18] N. Otsu, "A threshold selection method from gray-level histograms," IEEE Transactions on Systems, Man and Cybernetics, vol. 9, pp. 62-66, Jan 1979.
[19] Z. Zhengyou, "A flexible new technique for camera calibration," Pattern Analysis and Machine Intelligence, IEEE Transactions on, vol. 22, pp. 1330-1334, 2000.
[20] D. G. Lowe, "Distinctive image features from scale-invariant keypoints,"
[21] M. A. Fischler and R. C. Bolles, "Random sample consensus: a paradigm for model fitting with applications to image analysis and automated cartography,"