Enhanced DC voltage control strategy for fault management of a VSC-HVDC
connected offshore wind farm
Dimitrios Tzelepis†,Anastasios Oulis Rousis ∗, Adam Dy´sko †, Campbell Booth†,
†University of Strathclyde, Glasgow, UK ∗Imperial College London, London UK
[email protected], [email protected], [email protected], [email protected]
Keywords—DC voltage control , Fault Ride Through, Offshore Wind Farms, Permanent Magnet Synchronous Generators, HVDC Transmission
Abstract
This paper proposes a DC voltage control strategy for fault management taking into advantage the operation of the mas-ter controller located in the offshore AC substation platform. The issue resolved via the proposed controller relates to over-voltages caused in the HVDC links when the power transfer onshore is disrupted due to faults occurring at the AC side of the onshore grid. The control strategy presented in this paper proposes an effective way of maintaining the DC over-voltage within safety limits via reducing the connected wind farm power output. The operation of the aforementioned control strategy requires small computational power and no communication.
1. Introduction
Currently, offshore wind farms have ratings up to 500 MW with their capacities expected to reach 1 GW within the next few years [1]. The existing AC solutions, even though are well-established, have a number of disadvantages making them inappropriate for the future far offshore multi-GW ap-plications; major issues being relatively high losses, require-ments for reactive power compensation and limited transfer capability. The DC systems can overcome these limitations to a large extent. Specically, HVDC systems and especially VSC-HVDC systems are characterised by the advantages listed below when compared to relevant AC systems [2]–[5]:
• More efficient long distance power transmission. • Interconnection of asynchronous grids.
• Independent control of active and reactive power. • AC system support.
• Unity power factor.
• Short circuit level limitation. • Limited visual impact.
As it has become apparent that HVDC systems will be de-ployed on a large scale in the future, their analysis has gained a lot of attention from many research teams worldwide. One of the issues that needs to be analysed relates to the fault ride through (FRT) capability of the offshore wind farms. Due to their large capacities offshore wind farms are required to comply with the fault ride through requirements as set
out in the various grid codes; this implies that offshore wind farms need to remain connected to the grid under certain fault conditions. However the reduction of power injected into the mainland AC grid due to the fault results in increase of the DC voltage of the link as the power balance is disrupted. Sig-nificant over-voltages could potentially impact the lifetime of the cable (e.g. short duration single phase faults onshore) or even permanently damage the cable (e.g. major three-phase faults onshore that lead to extreme over-voltages). In the literature several methods are proposed for maintaining the DC voltage within acceptable limits during the faults. However, these methods require either additional equipment (e.g. DC choppers [6]), therefore they impose additional capital costs to the wind farm and waste of energy or need for communication between the HVDC converter station and the wind farm and as such they are considered slow for the given time frame of the faults. More efficient methods identify the DC over-voltage and once this is done they impose an over-frequency condition on the offshore AC grid so that the individual WTG controllers decrease the WTG output with no need for additional equipment or communication; however they are not the most effective as they need to interpret the fault into a certain condition at the offshore AC grid before action is initiated. The proposed method in this paper requires no communication and the response time is within the time frame of typical faults. Furthermore, under certain conditions even the use of additional equipment can be omitted so that no power is wasted (see subsection 4.3 for more details).
The paper is organised as follows: Section 2 provides the basis of modelling HVDC systems and their associated con-trol. Section 3 presents the issue and gives a brief overview of the existing FRT methodologies while the proposed FRT approach is introduced. Section 4 shows the simulation re-sults and finally in Section 5 conclusions are drawn.
2. Modelling
and
Control
of
VSC-HVDC
Transmission System
Figure 1: Electrical Schematic of a Typical VSC HVDC Transmission System
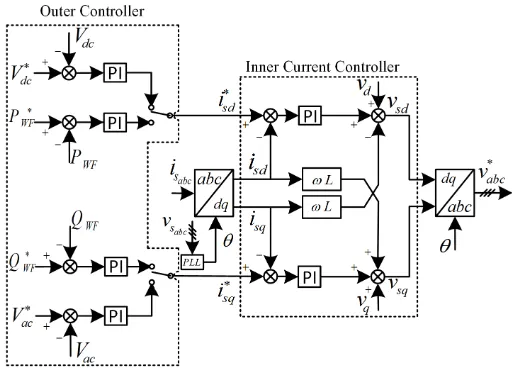
The LLC is used to control the switching of power electronics valves, where the PWM technique is usually adopted. The control mode of the UPC is illustrated in Figure 2 and comprises of two controllers, the outer (power or voltage) controller and the inner current controller (ICC) [7]–[10].
Figure 2: FRC Upper-level Controller
The main purpose of the outer controller is to generate the reference signals for the currents in thedqframe, which are used in the inner current controller. The i∗d component is generated by the active power or DC voltage sub-controllers while i∗q component is generated by the reactive power and
the AC voltage sub-controllers. In all cases PI regulators are deployed for the control of the blocks. It has to be noted here that for a point-to-point HVDC system the inverter is usually operating under DC voltage and reactive power control mode, while the rectifier is responsible for the active power and AC voltage regulation.
• Active and reactive power controllers: In the three phase system, the active and reactive power can be calculated by equations 1 and 2 respectively:
pAC=vaia+vbib+vcic (1)
qAC=
1 √
3(vabic+vbcia+vcaib) (2) When the q axis is aligned with the voltage phasor of the AC grid (i.e. ed=0), the active and reactive
powers in the dq frame are expressed as:
pAC=eqiq (3)
qAC=eqid (4)
Equations (3) and (4) prove that the active and reac-tive powers are independently controlled by theqand
dcomponents of the converter current respectively.
• DC voltage controller: The DC voltage controller maintains the DC voltage at a predefined value by controlling the active power exchange with the AC grid and this is achieved by regulating the reference value of theq component of the current.
The controller is set up to operate in accordance with the error of the energy stored in the capacitor, ∆WC =WC∗−WC. The energy of the capacitor is
proportional to the square of the DC voltage.
• AC voltage controller:The responsibility of the AC voltage controller is to control the amplitude of the AC voltage at the connection point which is achieved by regulating thei∗d.
The main goal of the ICC is to generate the AC current by evaluating the voltage drop on the series reactance of the connected AC system. For this to be achieved, the input signals (i.e. converter currents) are transformed to a rotating dq reference frame via the Park Transformation [11]. The reference is synchronised with the AC voltage of the grid via a Phase Locked Loop (PLL). Using this technique the active and reactive power can be controlled independently. The output of the ICC is a reference value for the converter voltage, which is then used by the LLC to control the switching of the power electronic valves. Considering the simplified equivalent model of the AC side of a VSC converter, the following equation can be written:
es−vC =RTiC+LTd/dt(iC) (5)
Using the Park Transformation equation (5) can be written as:
ed−vd=RTid+LTd/dt(id)−LTiq (6)
eq−vq =RTiq+LTd/dt(iq)−LTid (7)
WhereLT,RT are the equivalent inductance and resistance
between the converter and the connection point with the AC grid.
3. FRT Control Strategies
[image:2.595.40.296.260.447.2]offshore HVDC converter station injects unconstrained elec-trical power into the DC links to be delivered to the mainland AC transmission system. However, when faults occur on the AC system, the power injected into the AC grid from the onshore HVDC converter station is reduced significantly. Since the wind farms continue to produce the same amount of power the resulting imbalance leads to DC link over-voltages. In order to prevent the wind farm from being disconnected these over-voltages must be rapidly constrained to an acceptable level.
3.1. Existing FRT Methods
Several voltage limiting strategies can be found in the tech-nical literature to facilitate FRT capability. These can be summarised as follows:
• Use of a DC chopper: This method utilises a fully-rated DC chopper connected in series with a braking resistor as illustrated in Figure 1 [10]. The energy excess is dissipated through the resistor to maintain the DC voltage within acceptable limits. The method is advantageous as the WF remains in operation, and is also suitable when HVDC systems are connected to weak AC networks. However, this solution comes at additional cost, an increased substation footprint and more importantly significant waste of produced energy until the fault is cleared.
• Reduction of wind farm output utilising communi-cation systems: This is a de-loading control strategy which utilises the communication infrastructure of the VSC - HVDC system to transmit the appropriate signals to the WTGs for active power reduction [12]. This option comes with potential delays due to the need for transmitting the command signals through communication links.
• Fast reduction of WF active power output at the generator level: In this method, active power control schemes are utilised to reduce the active power output of the generators and limit the rise of DC voltage. Based on this idea many different approaches are proposed [6], [10], [13], [14]; all these methods aim to avoid the use of DC chopper, hence reducing the cost and power losses. However, there are many challenges which have to be taken into considera-tion, such as mechanical and electrical stresses of the equipment, need for communication signals and frequency/angular stability of the AC system.
3.2. Proposed FRT Method
This paper proposes a DC voltage control strategy which takes advantage of the operation of the master controller located in the offshore AC substation platform. The master controller calculates the active power reference for each wind turbine generator taking into account any measurements received from the HVDC link (e.g. status of the DC voltage). This allows the master controller to calculate appropriate reference values, even for instances when there is a fault on the HVDC link. The guiding principle for this is the fact that any fault on the AC side of the grid imposes certain amount of over-voltage in the DC link [5]. Examples of this
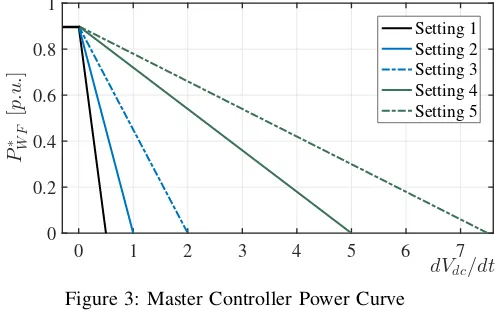
behaviour include faults at the AC connection point as well as voltage dips resulting from other remote AC faults. The time duration when the onshore grid is not available affects the over-voltage levels as well as the Rate of Change of Voltage (ROCOV). Therefore, a tracking curve is added into the master controller, as illustrated on Figure 3, to adjust the active power reference in relation to the severity of the fault, and specifically the ROCOV.
0 1 2 3 4 5 6 7
dVdc/dt 0
0.2 0.4 0.6 0.8 1
P
∗ WF
[
p
.u
.
]
[image:3.595.312.563.165.321.2]Setting 1 Setting 2 Setting 3 Setting 4 Setting 5
[image:3.595.309.553.340.497.2]Figure 3: Master Controller Power Curve
Figure 4: Wind Farm Master Controller
In addition to the master controller, a DC chopper is con-nected close to the offshore VSC converter station to avoid extreme values of DC voltage (e.g. in excess of 1.6 p.u. as shown in Figure 6) when the reduction of the active power export is not sufficient to mitigate it. Iterative simulations indicated that for major three-phase faults the active power export should be reduced to zero for the over-voltage to be maintained within permissible limits (i.e. 1.2 p.u.). However, this is not considered realistic within the given time frame due to the WTGs’ inertia and dynamics involved. Therefore the controller is adjusted to reduce the active power to a minimum of 40% of the rated value.
In steady state condition the offshore WF operates under the power reference denoted by PW F∗ (I). When OV Stage I threshold is exceeded, the power referenceP∗
This allows the system to ramp-up the power reference
PW F∗ (III)smoothly following the successful clearance of the fault. Such control loop provides a non-oscillatory power restoration to the system improving power quality and re-sponse of the HVDC system. During the operation of the controller under the restoration loop, the power is not tracked through the power curves, hence the derivativedVdc/dthas
no impact on the power reference. A secondary over-voltage element (OV Stage II) is integrated in the controller to enable the DC chopper when the reduction of the active power export is not sufficient to keep DC voltage within admissible limits. The over-voltage threshold for stage II has been set to 1.19 p.u.
The proposed controller, which benefits from the fact that no communication signals and small computational power are required, is illustrated in Figure 4. The strategy was modelled in Matlab/SimulinkR and validated using transient simulation.
4. Validation Case Studies
This section presents simulation based case studies which demonstrate and quantify the key benefits of the proposed controller.
[image:4.595.308.554.55.349.2]4.1. Model Description
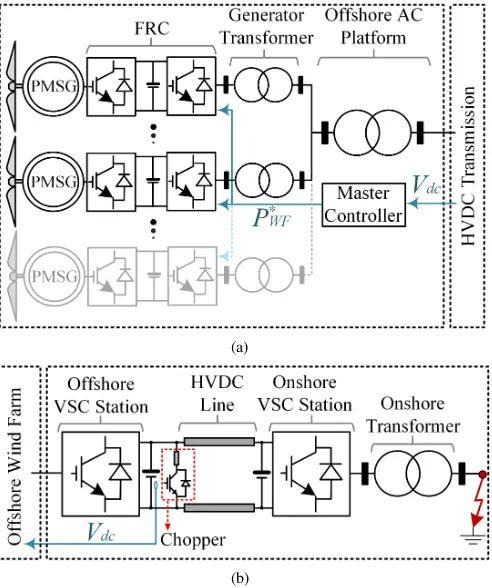
Figure 5 illustrates the model network which includes a wind farm comprised of Permanent Magnet Synchronous Gener-ators (PMSGs) connected by Fully Rated Converters (FRC) (Figure 5.a). The wind farm is connected to an offshore 2-level VSC converter station. Power is transferred onshore via 300 km HVDC transmission line operating at 640 kV and is injected into the AC grid through the onshore 2-level VSC converter station (Figure 5.b).
Parameter Value
WF Capacity 1 GVA
PMSG Transformer 3.3/66 kV WF Transformer 66/300 kV DC Line Length 300 km
DC Voltage ±320 kV
AC Voltage (L-L, RMS) 400 kV AC Frequency 50 Hz X/R Ratio of AC Network 20 AC Short-Circuit Level 10 GVA Onshore Transformer 300/400 kV
Table 1: Wind Farm, HVDC and Onshore AC Network Parameters.
The case study network parameters are presented in detail in Table 1. The values are selected to represent typical offshore wind farm networks to be deployed in the coming years. Specifically, with regards to the utilised WTGs, the major manufacturers currently design units with capacities in excess of 8 MW. These wind turbines operate at 3.3 kV or 6.6 kV, hence the transformers’ LV winding needs to be rated accordingly. The length of DC transmission line was set to 300 km to represent likely future distances. There are already offshore wind farms being developed with distances greater than 100 km (e.g. Hornsea Project One), and it is expected that offshore wind farm locations will cover distances greater than 200 km from the coast in the future.
(a)
(b)
Figure 5: Case Study Network - (a) Offshore Wind Farm (b) HVDC and HVAC Transmission Networks
4.2. Case Studies
The case studies presented in this paper include single-phase to ground and three-phase faults. The selection of only these two types of faults stems from the fact that single-phase to ground faults are the most frequent faults and three-phase faults, even though rare, represent the most challenging sit-uation from an FRT perspective. The response of the system is tested under different settings (i.e. different slopes of the power adjustment characteristic) on the master controller as illustrated in Figure 4.
4.3. Simulation Results
In Figure 6 the DC voltage natural response (i.e. without any limiting control scheme) is presented for single and three phase faults on the AC side of the onshore grid. Such response clearly illustrates the nature of the over-voltage problem. In both cases the DC voltage rise can be observed, approximately 1.2 p.u. and 1.6 p.u. for single phase and three phase faults respectively. These figures can be used as a reference to evaluate the system performance when the FRT DC voltage control scheme is enabled. An example response of the system when the proposed scheme is utilised under setting option 2, is presented in Figures 7 and 8 for single and three phase faults respectively.
[image:4.595.82.252.464.579.2]0 0.1 0.2 0.3 0.4 0.5 0.6 0.7 0.8 0.9 1
Time [s]
1 1.2 1.4 1.6 1.8
Vd
c
[p
.u
.]
[image:5.595.41.295.54.174.2]Single Phase Fault Three Phase Fault
Figure 6: Natural response of Vdc to single and three phase
faults
has no longer severe impact (due to its potential clearance by onshore protection systems) on the DC voltage, the system restoration process is initiated. Power reference is ramped up to pre-fault value within less than 100 ms, while DC voltage is gradually restored to 1.0 p.u. in a slightly oscillating manner.
0 0.1 0.2 0.3 0.4 0.5 0.6 0.7 0.8 0.9 1
0.9 1 1.1
Vd
c
0 0.1 0.2 0.3 0.4 0.5 0.6 0.7 0.8 0.9 1
-1 0 1
d
Vd
c
/
d
t
0 0.1 0.2 0.3 0.4 0.5 0.6 0.7 0.8 0.9 1
Time [s] 0.4
0.6 0.8 1
P
∗ W
F
a)
b)
[image:5.595.306.558.198.427.2]c)
Figure 7: Single-Phase Fault of a) Vdc, b) dVdc/dt, c)
PW F∗ /dt
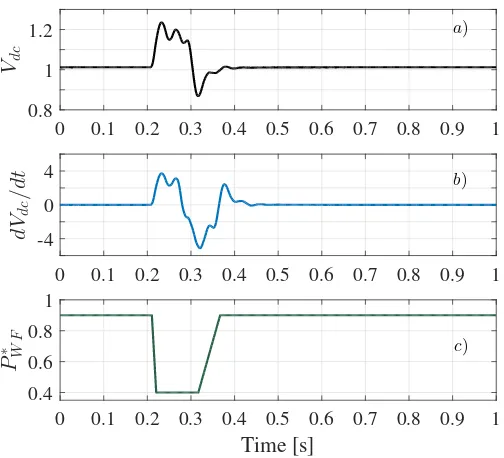
Figure 8 illustrates the system response to a three-phase fault. Compared to single-phase faults, this type of fault causes a steeper increase in DC voltage and consequently in higher ROCOV which reaches values close to 4p.u./sec. This is out of the operating region of the master controller with the selected setting option 2. Therefore, the power reference
PW F∗ remains at the lowest permissible level of 0.4 p.u. for about 100 ms. During this fault the OV Stage II threshold is exceeded and the DC chopper is enabled for about 20 ms to dissipate the excess of energy and to keep the DC voltage within the safe region. Finally, after approximately 100 ms, the power restoration is initiated to recover the system back to the pre-fault state. It is interesting to note that there is significant difference in the restoration time for these two different faults. After a single phase fault, DC voltage is
restored within 400 ms while in the case of three-phase fault, the restoration time is much shorter (approximately 200 ms). The most probable reason for this discrepancy is the fact that during the three-phase fault power reference is held at a minimum permissible level for about 100 ms while the chopper is also enabled which has additional damping effect. During a single-phase fault, on the other hand, such actions are not initiated, as DC voltage have been held within the safe margin by reducing the power reference only for a short period of time.
0 0.1 0.2 0.3 0.4 0.5 0.6 0.7 0.8 0.9 1
0.8 1 1.2
Vdc
0 0.1 0.2 0.3 0.4 0.5 0.6 0.7 0.8 0.9 1
-4 0 4
d
Vdc
/
d
t
0 0.1 0.2 0.3 0.4 0.5 0.6 0.7 0.8 0.9 1
Time [s] 0.4
0.6 0.8 1
P
∗ W
F
a)
b)
c)
Figure 8: Three-Phase Fault of a) Vdc, b) dVdc/dt, c)
PW F∗ /dt
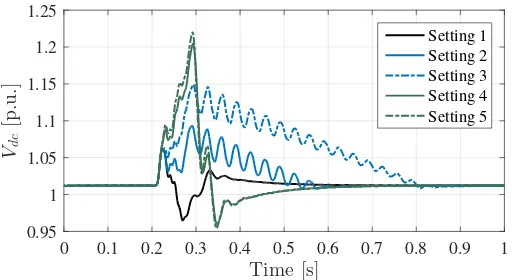
[image:5.595.41.293.323.552.2]0 0.1 0.2 0.3 0.4 0.5 0.6 0.7 0.8 0.9 1
Time [s]
0.95 1 1.05 1.1 1.15 1.2 1.25
Vd
c
[p
.u
.]
[image:6.595.42.298.53.193.2]Setting 1 Setting 2 Setting 3 Setting 4 Setting 5
Figure 9: DC VoltageVdcresponse under different controller
settings
5. Conclusions
Simulations indicated that AC-side faults in close proximity to converter stations can cause high DC over-voltages in the range of 1.2 - 1.6 p.u. that can potentially damage the DC link. The proposed DC voltage control scheme which benefits from the fact that no communication signals and small computational power are required, was found to effec-tively limit the impact of the aforementioned faults on the DC voltage rise. Specifically, for single-phase faults it has been observed that during the fault, and when the controller is enabled, DC voltage stays below 1.1pu and is eventually restored to the nominal value within approximately 400 ms. As far as the three-phase faults are concerned, the DC voltage stays within the acceptable limits (i.e. 1.2pu), but for this to happen operation of the DC chopper is required for a short period of time. In this case restoration to the nominal value is achieved within 200 ms. It is also worth noting that restoration of the DC voltage is significantly reduced when the proposed controller is enabled (e.g. for a single phase fault restoration periods in only a third of the time required when the controller is not enabled). Regarding the sizing of the DC chopper, the results indicate that even though its presence is required during the major three-phase faults, the size of the resistor can be established using cost benefit analysis. For such a study to be more effective it is proposed to consider extreme values of typical Contract for Difference (CfD) rates for Round 3 UK offshore wind farms and eventually calculate an Operational Expenditure (OPEX) figure for each of these cases. The results could be used to draw a conclusion for a technically but also economically feasible solution.
References
[1] EWEA, “The european offshore wind industry-key trends and statistics 2015,” 2016.
[2] K. Meah and S. Ula, “Comparative evaluation of hvdc and hvac transmission systems,” inPower Engineering Society General Meeting,
2007. IEEE, June 2007, pp. 1–5.
[3] P. Bresesti, W. L. Kling, R. L. Hendriks, and R. Vailati, “Hvdc connection of offshore wind farms to the transmission system,”IEEE
Transactions on Energy Conversion, vol. 22, no. 1, pp. 37–43, March
2007.
[4] D. Tzelepis, A. Ademi, D. Vozikis, A. Dysko, S. Subramanian, and H. Ha, “Impact of vsc converter topology on fault characteristics in hvdc transmission systems,” in Power Electronics Machines and
Drives, IET 8th International Conference on, March 2016.
[5] A. O. Rousis and O. Anaya-Lara, “Dc voltage control for fault management in hvdc system,” Energy Procedia, vol. 80, pp. 237 – 244, 2015.
[6] B. Silva, C. L. Moreira, H. Leite, and J. A. P. Lopes, “Control strategies for ac fault ride through in multiterminal hvdc grids,”IEEE
Transactions on Power Delivery, vol. 29, no. 1, pp. 395–405, Feb
2014.
[7] O. Gomis-Bellmunt, A. Egea-Alvarez, A. Junyent-Ferre, J. Liang, J. Ekanayake, and N. Jenkins, “Multiterminal hvdc-vsc for offshore wind power integration,” inPower and Energy Society General
Meet-ing, 2011 IEEE, July 2011, pp. 1–6.
[8] L. Xu, L. Yao, and C. Sasse, “Grid integration of large dfig-based wind farms using vsc transmission,”IEEE Transactions on Power Systems, vol. 22, no. 3, pp. 976–984, Aug 2007.
[9] L. Zhang, L. Harnefors, and H. P. Nee, “Modeling and control of vsc-hvdc links connected to island systems,”IEEE Transactions on Power
Systems, vol. 26, no. 2, pp. 783–793, May 2011.
[10] C. Feltes, H. Wrede, F. W. Koch, and I. Erlich, “Enhanced fault ride-through method for wind farms connected to the grid through vsc-based hvdc transmission,”IEEE Transactions on Power Systems, vol. 24, no. 3, pp. 1537–1546, Aug 2009.
[11] H. Knudsen, “Extended park’s transformation for 2 times;3-phase synchronous machine and converter phasor model with representation of ac harmonics,”IEEE Transactions on Energy Conversion, vol. 10, no. 1, pp. 126–132, Mar 1995.
[12] S. Nanou and S. Papathanassiou, “Evaluation of a communication-based fault ride-through scheme for offshore wind farms connected through high-voltage dc links based on voltage source converter,”IET
Renewable Power Generation, vol. 9, no. 8, pp. 882–891, 2015.
[13] G. P. Adam, K. H. Ahmed, S. J. Finney, and B. W. Williams, “Ac fault ride-through capability of a vsc-hvdc transmission systems,” inEnergy
Conversion Congress and Exposition (ECCE), 2010 IEEE, Sept 2010,
pp. 3739–3745.
[14] M. Mohammadi, M. Avendano-Mora, M. Barnes, and J. Y. Chan, “A study on fault ride-through of vsc-connected offshore wind farms,” in
Power and Energy Society General Meeting (PES), 2013 IEEE, July