City, University of London Institutional Repository
Citation
: Forth, J. ORCID: 0000-0001-7963-2817, Bryson, A. and Stokes, L. (2016). Are
firms paying more for performance?. International Journal of Manpower, 37(2), pp. 323-343. doi: 10.1108/IJM-01-2015-0006This is the accepted version of the paper.
This version of the publication may differ from the final published
version.
Permanent repository link:
http://openaccess.city.ac.uk/20906/Link to published version
: http://dx.doi.org/10.1108/IJM-01-2015-0006
Copyright and reuse:
City Research Online aims to make research
outputs of City, University of London available to a wider audience.
Copyright and Moral Rights remain with the author(s) and/or copyright
holders. URLs from City Research Online may be freely distributed and
linked to.
City Research Online: http://openaccess.city.ac.uk/ [email protected]
Are Firms Paying More For Performance?
John Forth (NIESR)
1Alex Bryson (UCL and NIESR)
Lucy Stokes (NIESR)
April 2016
Purpose
We use firm-level data to investigate changes in the economic importance of performance-related-pay (PRP) in Britain through the 2000s.
Design/methodology/approach
We utilise nationally-representative, monthly data on the total wage bill and employment of around 8,500 firms. Using these data, we decompose the share of the total economy-wide wage bill accounted for by bonuses into the shares of employment in the PRP and non-PRP sectors, the ratio of base pay between the two sectors, and the gearing of bonus payments to base pay within the PRP sector.
Findings
The growth in the economic importance of bonuses in Britain in the mid-2000s – and subsequent fluctuations since the onset of recession in 2008 – can be almost entirely explained by changes in the gearing of bonus to base pay within the PRP sector. There has been no substantial change in the percentage of employment accounted for by PRP firms; if anything it has fallen over time. Furthermore, movements in the gearing of bonuses to base pay in the economy are heavily influenced by changes in Finance: a sector which accounts for a large proportion of all bonus payments in Britain.
Research implications
The paper demonstrates the importance of understanding further how firms decide the size of bonus payments in a given period.
Originality/value
Ours is the first paper to present monthly firm-level data for the Britain on the incidence and size of bonus payments in the 2000s.
Key words: performance pay; bonuses; recession; business cycle; finance JEL Classification: J33
Acknowledgements and Disclaimer
This work is funded by the Economic and Social Research Council, Grant Reference ES/I035846/1. It includes analyses based on data from the Monthly Wages and Salaries Survey, produced by the Office for National Statistics (ONS) and supplied by the Secure Data Service at the UK Data Archive. The data are Crown Copyright and reproduced with the permission of the controller of HMSO and Queen’s Printer for Scotland. The use of the data in this work does not imply the endorsement of ONS or the UK Data Service at the UK Data Archive in relation to the interpretation or analysis of the data. This work uses research datasets which may not exactly reproduce National Statistics aggregates. We thank participants at the Eversheds Labour Relations Conference in 2012, the "New Research in Performance-related Pay" 2013 Conference at the University of Aberdeen, the 2013 WPEG Conference, the 2014 “Workshop on Firm-Level Analysis of Labour Issues” in Louvain, and seminars at NIESR and King's College, London for useful comments. None of these
1. Introduction
Labour economists ascribe great importance to performance-related pay (PRP) because,
compared to paying fixed time-rate wages, it provides opportunities to increase labour
productivity by inducing additional effort and attracting high ability workers (Lazear, 1986;
Prendergast, 1999). There is abundant empirical evidence in support of these propositions in
settings as diverse as windshield repairs (Lazear, 2000), strawberry picking (Bandiera et al.,
2007), and tree planting (Shearer, 2004). Given its economic benefits, one might expect the
incidence of PRP to be high in market-oriented economies. Yet the research literature has
provided ample evidence of the hidden costs of PRP (Prendergast, 1999: 21-33; Frick et al,
2015), and early studies found PRP was less pervasive than might have been anticipated if it
was optimal for most firms.
It is perhaps for this reason that Lemieux et al.’s (2009) seminal paper (LMP hereafter)
attracted so much attention. Using the Panel Study of Income Dynamics (PSID) they found
the incidence of PRP jobs in the United States increased from 38 per cent in the late 1970s to
around 45 per cent in the 1990s. More telling still, they speculated that secular changes in
technology might lie behind the growth of PRP. The first of these changes is skills-biased
technical change (SBTC) which has increased demand for skilled labour in industrialised
economies, inducing employers to attract the most able workers by linking their rewards to
performance. The second potential technical reason for the growth of PRP has been the
advances in information and communication technologies which have reduced the costs of
collecting and processing information about worker performance (op. cit., 3). Since these
trends in SBTC and monitoring costs are likely to be pervasive across advanced
market-oriented economies, albeit to varying degrees, it is conceivable that they may have led to
further growth in the use of PRP in the US in recent years, and to growth in other countries.
However, recent studies inspired by LMP have raised important questions about current
trends, at least for the United States. First, using establishment data from the Bureau of Labor
Statistics' Employer Costs for Employee Compensation (ECEC) series (which derives from
the National Compensation Survey), Gittleman and Pierce (2013a) show the proportion of
jobs with performance pay rose in the 1990s, only to fall in the 2000s such that, by 2013, it
had declined by about one-fifth in the period since LMP's study period. They test various
possible reasons for the decline, but none have much explanatory power. However, they do
show that, although the decline is apparent throughout the wage distribution and within
industry and occupation, it is concentrated among lower earners. Second, a series of papers
have begun to question whether there is positive selection into PRP on ability. Using the
PSID used by LMP, Heywood and Parent (2012) show that, among men, the tendency for
blacks. Indeed they say "if anything [we find] evidence that high-ability blacks sort out of
performance pay" (op. cit.: 281). In a second paper using the National Longitudinal Survey of
Youth (NLSY), Heywood and Parent (2013) find skilled fathers select into performance pay
jobs, whereas skilled mothers select out of performance jobs. These findings are not
consistent with the standard assumptions regarding workers sorting into performance pay
jobs on ability, and suggest that any increase in PRP incidence driven by SBTC may not be as
straightforward as LMP imply.
These studies raise questions about recent trends in PRP in other market-oriented economies.
Cross-sectional comparative studies find low PRP incidence rates of around 10-15 per cent in
many European countries, compared to around 40 per cent in the United States. Only
Scandinavian countries seem to approach the PRP incidence levels of the United States
(Bryson et al., 2013). But have other countries experienced any recent growth in PRP? This
paper focuses on developments in Britain, a country in the lower half of international
rankings in terms of the percentage of employees who said they were in receipt of PRP in the
mid-2000s (Bryson et al., 2013). Evidence from the periodic Workplace Employment
Relations Survey (WERS) series has indicated that the percentage of all workplaces in Britain
using PRP schemes increased between 1984 and 2004, though the increase was far from
uniform across different types of PRP (Pendleton et al., 2009). However, the latest WERS,
conducted in 2011, suggests that PRP has reached a plateau and that, in the case of employee
share plans, usage has actually fallen (Van Wanrooy et al., 2013). The emerging picture for
Britain thus has some resonance with that portrayed by Gittleman and Pierce (2013a) for the
United States. There is little else by way of evidence on trends in PRP in Britain however.
One exception is the research undertaken by Bell and Van Reenen (2010, 2013) which
indicates that annual bonuses have played an important role in the growth of wage dispersion
at the top of the earnings distribution, especially in Finance, a sector which is more
significant for the UK economy than it is for the US.
We contribute to this literature by mapping the incidence of PRP using firm-level data that
have never before been used in this literature. These data are the Monthly Wages and
Salaries Survey (MWSS) which are the basis for the Office for National Statistics' Annual
Earnings Index. The MWSS is a monthly survey which employers are required to complete
under statute. They are therefore high quality, high frequency data.i The survey is large
(circa 8,500 observations per month) and is a census of all large firms and a rotating panel of
smaller firms. We use the data to test hypotheses regarding secular and cyclical trends in
PRP.
We have four main findings. First, we show that there was some growth in the share of total
subsequent fluctuations – can be almost entirely explained by changes in the gearing (or
multiplier) that is applied to base pay in the PRP sector. In contrast, there has been no
increase in the percentage of employment accounted for by PRP firms; if anything it has
fallen over the past decade. Third, bonuses are shown to be more cyclical than base pay, such
that the overall share of wages paid out in bonuses fell during the recent recession. Fourth,
movements in the gearing of bonuses to base pay in the economy at large are heavily
influenced by changes in the Finance industry: a sector which accounts for a large proportion
of all bonus payments in the British economy. One implication is that further research is
needed on how firms – particularly in Finance but also elsewhere in the economy – decide
upon the appropriate size of bonus payments for their workers from one period to the next.
The remainder of the paper is as follows. Section Two briefly reviews the literature and
outlines our key hypotheses. Section Three introduces our data and presents our empirical
strategy for describing and analysing the data. Section Four presents our results. Section Five
concludes.
2. Literature and Hypotheses on the Changing Incidence of PRP
Both the incidence of PRP and the size of performance-related payments to employees are
contested issues in the literature. There is good economic evidence that PRP elicits greater
worker effort and can improve labour productivity (see Bryson et al., 2013, for a review).
Thus, one might anticipate a high incidence of PRP in the economy, at least in the
market-oriented sector seeking to maximise profits. Consequently, evidence suggesting that its
incidence is patchy and that, even when it is present, it forms a relatively small percentage of
total pay, are met with some surprise and even scepticism.
PRP is not necessarily optimal in some settings, however. For instance, where it is difficult to
link the effort or performance of particular workers directly to output, it may not make sense
to resort to PRP, and employers may instead prefer to incentivise employees using other
instruments such as career progression via promotion (Prendergast, 1999), as is often the case
in professions and parts of the public sector.ii Equally, where intrinsic motivation is strong, an
emphasis on monetary rewards can prove counterproductive (see Benabou and Tirole, 2003).
Moreover, workers may not wish to share the employer's risk associated with firm or
individual performance, preferring instead a standard base wage which does not vary with
performance or, if it does vary, for the sensitivity of pay to performance to be relatively low
(see Dohmen and Falk, 2011).iii Employers, recognising the need to trade off efficiency
against insurance, may choose to set the elasticity of pay to performance well below that
which might be optimal for profit maximisation. Finally, employers and workers may be
wary of the potentially negative consequences of increased wage inequality arising from PRP
International evidence from employee-level data for the mid-2000s indicates that the
percentage of employees in receipt of PRP varies markedly across countries from around
10-15 per cent in most European countries, rising to around 40 per cent in Scandinavia and the
United States (Bryson et al., 2013). No such comparative evidence exists with respect to the
size of performance payments or their share of total wages.
It is against this backdrop that we test the following hypotheses.
H1: There has been a secular rise in the use of PRP in Britain
There are several reasons why one might expect PRP to have grown over time. These relate
to falling worker bargaining power, greater potential benefits of PRP to firms, changes in
tasks and production technology, and shifts in the composition of occupations.
As noted earlier, the declining costs of the technologies required to monitor output may
encourage increased use of PRP (McGovern et al, 2007) and skills-biased technological
change (SBTC) increases the demand for highly productive workers who may be attracted by
PRP (LMP, 2009: 3). Bryson et al. (2013) show the likelihood of receiving PRP rises with
employee job autonomy in both the United States and Europe and that, in Europe, it also rises
among those performing more complex tasks. If SBTC has also resulted in a task-based
polarisation of jobs in the economy, the growth of highly skilled autonomous working at the
top end of the occupational distribution may also be conducive to the use of PRP.iv For all
these reasons one might expect to see growth in the use of PRP over time and, perhaps, a
bigger gearing of pay to performance where PRP is used.
A variant of this hypothesis is that production processes are developing in such a way as to
limit the use of traditional individual PRP, such as piece rates, with employers substituting
them instead with group-based incentives that complement team-oriented working that
characterises an increasing proportion of work settings. Freeman and Kleiner (2005) note the
demise of individual PRP in American manufacturing, while Dube and Freeman (2010) and
Kruse et al. (2010) point to substantial growth in financial participation schemes and
group-based PRP. However, both group-group-based PRP and individual PRP have been rising in Europe
(Bryson et al., 2013), perhaps because merit pay - based on subjective assessments of
employee performance by managers and supervisors - has been substituting for other forms
of individual PRP.
LMP (2009) also link the rise of PRP in the United States to the demise of trade unionism
which, they suggest, has acted as a constraint on the use of PRP. Using panel data from the
National Longitudinal Survey of Youth (NLSY) for the United States, O'Halloran (2013)
opposite is true for piece-rates. Britain has seen a continued decline in unionisation over the
last decade (Bryson and Forth, 2011; Van Wanrooy et al., 2013). If one accepts the
contention that unions act as a constraint on the use of PRP, then one might anticipate their
waning influence to translate into a secular rise in the use of PRP in Britain. Evidence
through to 2004 indicates a rise in the workplace incidence of PRP in Britain in the previous
quarter-century, although there is no clear evidence that this rise is linked to union decline
(Pendleton et al., 2009).
In spite of there being a variety of potential influences on the growth of PRP, it is also
acknowledged in the literature that PRP schemes do not always work as intended. The
dangers inherent in PRP include sabotage, ratchet effects (gaming), and the exclusive focus
on incentivised targets to exclusion of other desirable outcomes. These problems may lead
firms to abandon PRP and, indeed, there is evidence that firms do switch out of, as well as
into, performance-related pay (e.g. Belfield and Marsden, 2003). It is thus not inevitable that
the incidence of PRP will rise over time. As noted earlier, Gittleman and Pierce (2013a) used
the Bureau of Labor Statistics' Employee Costs for Employee Compensation (ECEC) data set
to show that the percentage of jobs with PRP in the United States fell by 10 percentage points
in the 2000s such that their incidence is now lower than it was in the period covered by
LMP's (2009) PSID study. This is the first evidence that the continued growth in PRP
anticipated by some analysts has not materialised.
H2: PRP is pro-cyclical
Some maintain that PRP schemes are sometimes little more than a pay relabeling exercise.
For example, firms respond to tax incentives when setting up profit-related pay and share
ownership plans because they are treated as tax-efficient payment methods. This observation
may help explain international differences in the incidence of financial participation schemes
(Bryson et al., 2013) and the otherwise hard-to-explain changes in the use of share ownership
plans and profit-related pay in Britain (Pendleton et al., 2009). Nevertheless, in most
instances it seems reasonable to assume that PRP schemes are genuine efforts by employers
to link their employees' pay to their own performance or that of the firm, whether as an
incentive, or as a means of sharing the risks (or profits) arising from fluctuations in market
conditions. Blanchflower et al (1996) provide evidence that wages change in response to
sectoral profitability. Therefore we should expect pro-cyclical movement in payments for
performance because, on average, one expects individual firms' fortunes to rise and fall with
those of the rest of the economy. Fixed base wages may also adjust to macro-economic
conditions, but we would expect them to be much less responsive to economic conditions
than PRP, and any adjustment we do observe is likely to be less pronounced than the
Among employees in general there is evidence for Britain that real earnings have become
more sensitive to unemployment since the early 2000s (Gregg and Machin, 2012). Although
the authors do not investigate how much of this sensitivity is associated with the incidence
and size of PRP, the magnitude of the change is such that much of it is likely due to the
increased sensitivity of base pay.v Empirical support for sensitivity of pay-to-performance is
found in the executive pay literature where most or all of the adjustment in compensation
comes through performance bonuses and related options. However, Bell and Van Reenen
(2011) find non-executive pay is much less sensitive to firm performance. They argue this is
because "only senior executives have a large enough share of pay in bonuses to generate a
sizeable overall effect on pay" (p. 1) while base pay remains relatively insensitive to firm
performance.
Whether firms’ propensity to use PRP schemes is affected by the business cycle is less
certain, a priori. It will depend, in part, on the bargaining power of workers and firms.
Employers may be more eager to share income risks with workers in economic downturns
through the promotion of PRP, whereas workers may prefer PRP in economic upswings when
there are larger rents to share. Industrial relations scholars point to the inertia in payment
systems and the transaction costs associated with changing schemes, considerations which
imply movement in and out of PRP is likely to be less responsive to the business cycle than
we might otherwise anticipate. Using a very broad definition of performance pay, Gittleman
and Pierce (2013b) suggest that the steep decline in the number of hours compensated with
PRP in the United States since the early 2000s is most likely due to "cyclical factors related
to the Great Recession".
H3: Explanations for trends in performance-related pay in Britain will be dominated by what
happens in the Finance sector
Performance-related pay is more common in some sectors and occupations than others due to
the role employees perform in generating sales or increasing production. For example, piece
rate work is often associated with production line manufacturing while commission on sales
is common in Retail. The British economy has a larger Finance sector than most developed
economies due to the role of the City of London as a centre for listing and trading public
listed company shares and for trading and investment more generally. Bonuses are an
important method by which firms recruit, retain and motivate bankers, traders and other
corporate executives. Some have identified bonus payments to bankers as an important
component of recent growth in wage dispersion in Britain (Bell and Van Reenen, 2013),
while others have speculated whether any increase in the bonus gearing of payments to
traders may have induced risky behaviours which may have contributed to the recent
role of bonuses in the sector we hypothesise that bonus activity in the Finance sector may
have played an important role in explaining economy-level movements in bonuses in Britain.
3. Data
Our results are based on analyses of the Monthly Wages and Salaries Survey (MWSS). The
MWSS is conducted each month by the Office for National Statistics and provides data for
around 8,500 enterprises in Britain. The sample of enterprises (strictly, reporting units) is
drawn from the Inter-Departmental Business Register according to a variable probability
design. A census is conducted among enterprises with 1,000 or more employees; the
sampling fractions then decline through three further strata (500-999 employees; 100-499
employees; and 20-99 employees). Enterprises with fewer than 20 employees are not
included in the survey. The survey covers all industries. Our data cover the period January
2000 to March 2013.
The survey contains data on total gross pay for the enterprise in the survey month, as well as
the amount of bonus/commission (i.e. PRP) included in total gross pay. Separate totals are
collected for all weekly-paid and all monthly-paid employees.vi Bonuses are measured by the
survey in the month of payment, rather than during the period over which they are earned. All
bonuses are included, with respondents being instructed to include: bonuses; commission;
performance pay; annual profit from profit-related pay schemes; long-service awards; and –
for sporting professions – appearance money. Changes in the way the data were collected
mean there is a clear likelihood of under-reporting before the year 2000, so we begin our
analysis of MWSS at this point.
Participation in the survey is compulsory and so a high response rate is achieved (around 85
per cent each month). Enterprises with 1,000 or more employees thus typically appear in the
survey dataset each month. Enterprises which enter the sample with 20-999 employees are
retained for up to five years before being rotated out. It is therefore possible to observe many
individual firms at monthly intervals over a considerable period of time, and so to observe
changes in the size of bonus payments within firms, both within and across years.
Whilst our analysis is based on the MWSS microdata provided via the UK Secure Data
Service, we can confirm that we are able to use these microdata to replicate ONS’ published
statistics for Average Weekly Earnings (for which MWSS is the source).
In regression analyses we link the MWSS reporting units to their associated enterprise
records in the Business Structure Database (BSD) – an annual extract from the UK’s official
MWSS. This linkage is feasible for around 95 per cent of all MWSS records, and at least 85
per cent in each year.
4. Results
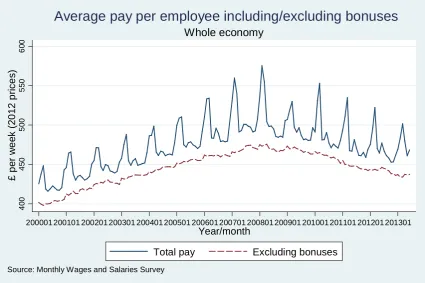
Figure 1 presents data from the MWSS showing the average real wage bill per employee in
each month from January 2000 through to March 2013 for the whole economy. The chart
shows separate series which include and exclude bonus payments. The figures are in British
pounds per week at 2012 prices. The spikes in bonus payments capture the within-year
variation that is caused by the timing of annual bonuses, typically paid in the period between
December and March to reflect individual or collective performance over the previous 12
months.
Base pay rises gently until the onset of recession in July 2008 when it flattens and then begins
to fall. Total pay follows a similar pattern, but the rise in total pay steepens between 2005
and 2008, with bonus pay appearing to constitute a rising percentage of total pay in this
period. The fall in total pay in 2008/9 also seems sharper than that seen in base pay.
Nonetheless, whereas base pay continues to be subdued in 2010, bonus pay bounces back –
albeit not to its pre-recession peak. Figure 2 charts the share of total pay that is attributed to
bonus payments and confirms that this share rose in the mid 2000s (particularly between
2005 and 2008). The share fell back in 2009 – although only to the level seen in the first half
of the decade – before regaining much of its ground in 2010. After this point, end-of-year
bonuses appear to fall slightly, whilst it appears that those paid at other points in the year may
have risen.
[INSERT FIGURES 1 AND 2 HERE]
The broad patterns are thus evident from Figures 1 and 2, but the exact scale and timing of
the changes is difficult to discern from the charts because of the seasonality of bonus
payments. To show these movements more clearly, we aggregate the monthly data into the
two bonus seasons, namely the "low season" which runs from April to November, when
bonus payments typically average around five per cent of total wages, and the "high season"
which runs from December to March, when they typically average around ten per cent.
Figure 3 then charts the growth rate in the bonus share between one season and its equivalent
in the following year (e.g. the first bar shows that the bonus share in the high season of 2001
was proportionally 14 per cent larger than the bonus share in the high season of 2000).vii The
chart shows that the growth rates in the mid-2000s were similar irrespective of the season.
The absolute growth in the bonus share was larger within the ‘high season’ series: the share
rose from a low of 8.2 per cent in 2003 to a peak of 13.1 per cent in 2007, whereas “low
proportionate growth in each series was similar. The chart also confirms that there has been
no consistent pattern over the last three years of our series.
[INSERT FIGURE 3 HERE]
These movements in the bonus share are intriguing and, intuitively, we can expect that they
may arise through a number of different mechanisms. One possible explanation for the
growth in the mid-2000s is that there was an expansion in the share of all firms using PRP,
with a consequent decline in the share of firms paying only fixed wages. Another possibility,
which might intuitively explain some of the cyclicality in the bonus share, is that there have
been changes in the size of bonuses paid out by PRP firms. We can therefore better
understand the causes of movements in bonus payments if we decompose the bonus share
into its constituent components.
In any given economy, the share of all wages paid out in bonuses in period t (the ‘bonus
share’ for period t, or Bt) is computed as the ratio between the sum of all bonus payments
(Bont) and the sum of all wages (TotWaget). That is:
𝐵𝐵𝑡𝑡 = 𝑇𝑇𝐵𝐵𝑡𝑡𝑇𝑇𝑇𝑇𝑇𝑇𝑇𝑇𝐵𝐵𝐵𝐵𝐵𝐵𝑡𝑡 𝑡𝑡 (1)
The sum of all bonus payments in period t can be written as:
𝐵𝐵𝐵𝐵𝐵𝐵𝑡𝑡= 𝐺𝐺𝑡𝑡𝐵𝐵.𝑟𝑟̅𝑡𝑡𝐵𝐵.𝐸𝐸𝑡𝑡𝐵𝐵 (2)
Where:
𝐸𝐸𝑡𝑡𝐵𝐵is the total number of employees in firms that paid bonuses in period t
𝑟𝑟̅𝑡𝑡𝐵𝐵 is average regular (or base) pay per employee in these firms in period t
𝐺𝐺𝑡𝑡𝐵𝐵 is the multiple of all regular pay that is added to the wage bill in the form of bonus payments in bonus-paying firms (that is, the gearing of bonus pay to base pay within
bonus-paying firms). This gearing is necessarily zero in non bonus-paying firms (𝐺𝐺𝑡𝑡𝑁𝑁=0).
Similarly, the sum of all wages paid out in the economy can be expressed as the sum of: all
bonuses paid out in bonus-paying firms; all regular pay paid out in bonus-paying firms; and
all regular pay paid out in non bonus-paying firms. That is:
𝑇𝑇𝐵𝐵𝑇𝑇𝑇𝑇𝑇𝑇𝑇𝑇𝑇𝑇𝑡𝑡 = 𝐺𝐺𝑡𝑡𝐵𝐵.𝑟𝑟̅𝑡𝑡𝐵𝐵.𝐸𝐸𝑡𝑡𝐵𝐵+ 𝑟𝑟̅𝑡𝑡𝐵𝐵.𝐸𝐸𝑡𝑡𝐵𝐵+ 𝑟𝑟̅𝑡𝑡𝑁𝑁.𝐸𝐸𝑡𝑡𝑁𝑁 (3)
Where:
𝑟𝑟̅𝑡𝑡𝑁𝑁 is average regular (or base) pay per employee in these firms in period t.
Let 𝑅𝑅𝑅𝑅𝑡𝑡 refer to the ratio between average regular pay per employee in bonus-paying firms
and average regular pay per employee in non bonus-paying firms. We call this the ‘regular
pay premium’ (or ‘base pay premium’) in favour of the average employee in a bonus-paying
firm:
𝑅𝑅𝑅𝑅𝑡𝑡= 𝑟𝑟̅𝑡𝑡 𝐵𝐵
𝑟𝑟̅𝑡𝑡𝑁𝑁 (4)
And let 𝐸𝐸𝑅𝑅𝑡𝑡 refer to the ratio between total employment in bonus-paying firms and total
employment in non bonus-paying firms. We call this the ‘employment premium’ in favour of
bonus-paying firms:
𝐸𝐸𝑅𝑅𝑡𝑡 = 𝐸𝐸𝑡𝑡 𝐵𝐵
𝐸𝐸𝑡𝑡𝑁𝑁 (5)
Substituting (2) and (3) into (1) and dividing all terms through by 1 𝑟𝑟̅𝑡𝑡𝑁𝑁.𝐸𝐸
𝑡𝑡𝑁𝑁 we then obtain the following:
𝐵𝐵𝑡𝑡 = 𝐺𝐺𝑡𝑡 𝐵𝐵.𝑅𝑅𝑅𝑅
𝑡𝑡.𝐸𝐸𝑅𝑅𝑡𝑡
𝐺𝐺𝑡𝑡𝐵𝐵.𝑅𝑅𝑅𝑅𝑡𝑡.𝐸𝐸𝑅𝑅𝑡𝑡+𝑅𝑅𝑅𝑅𝑡𝑡.𝐸𝐸𝑅𝑅𝑡𝑡+1 (6) The aggregate bonus share in the economy (the share of all wages attributed to bonus
payments) is thus a function of:
(a) The ratio of employment in bonus paying firms to employment in non-bonus-paying
firms (the employment premium in favour of bonus-paying firms) (EPt)
(b) The ratio of average base pay per employee in bonus-paying firms to average base
pay in non-bonus-paying firms (the base pay premium) (RPt), and
(c) the gearing within bonus-paying firms (the multiplier that bonus-paying firms
notionally apply to base pay) (𝐺𝐺𝑡𝑡𝐵𝐵).
For instance, if the employment premium is 1.10 (bonus-paying firms employ 52.5% of all
employees in the economy), the pay premium is 1.05 (average base wages in bonus-paying
firms are 5% higher than in non bonus-paying firms), and bonus-paying firms pay out
bonuses to the value of 10% of base pay (a gearing of 0.10, which implies that total pay is
1.10 times the value of base pay), then the overall share of wages attributable to bonus
payments is 5.1%.
Tracking the movement in each of these three series over time indicates whether one
monthly trend over our period of observation. It is apparent that the most substantial change -
both from month to month and over time - is in the gearing of bonus pay to base pay in PRP
firms. The ratio of base pay in PRP and non-PRP firms is flat in comparison. The
employment ratio is also relatively flat overall, but drifting slowly downwards. The
suggestion here is that firms’ propensity to pay PRP has, if anything, been declining, but that
movements in the gearing of bonus pay to base pay are at least as important in understanding
changes in the economic importance of performance pay over time.
[INSERT FIGURE 4 HERE]
The broad changes are again easier to discern if the monthly data are aggregated into bonus
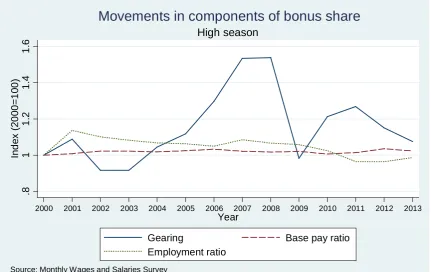
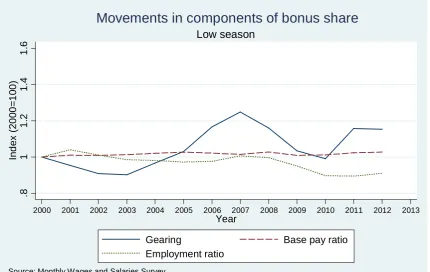
seasons. Figures 5 and 6 undertake this aggregation and also index each of the three series on
the year 2000 (i.e. 2000 = 100). Changes in the gearing within PRP firms are the dominant
feature of both the "high" and "low" season charts.
[INSERT FIGURES 5 AND 6 HERE]
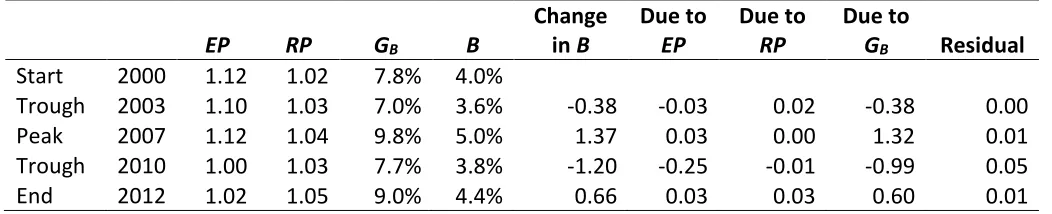
We use the values underlying Figures 5 and 6 as the basis for a shift-share analysis in order to
show the influence of changes in EPt, RPt and GB in explaining changes in the total share of
the wage bill accounted for by bonuses (B). This analysis is presented in Table 1 and
confirms that it is the change in gearing - that is, the ratio of bonuses to base pay within the
PRP sector - that explains most of the changing contribution of bonus pay to total pay. The
fourth row in Part A of the table shows, for example, that the bonus share (B) fell by 4.38
percentage points between the high season of 2007 and the high season of 2009, and that 4.29
percentage points of this fall could be attributed to the decline in the gearing (G) from 27.3%
in 2007 to 17.5% in 2009; the fall in the employment premium (EP) from 1.16 to 1.14
accounted for the remaining 0.13 percentage points of the overall decline in B. Indeed, in
each row of Table 1 we see that changes in the relative size of the PRP and non-PRP sectors,
and changes in the relative levels of base pay in the two sectors, contribute relatively little to
changes in the overall bonus share when compared with the influence of changes in the
gearing in PRP firms. This is the case in both the "high" and "low" seasons.
[INSERT TABLE 1 HERE]
To see whether compositional changes in the firm population - such as a shift in the sectoral
profile of employment - can account for changes in the bonus share – or its major
determinant, the gearing - we switch to regression models. These regressions focus on the
annual movement in the gearing (G) and bonus share (B), within each season, after
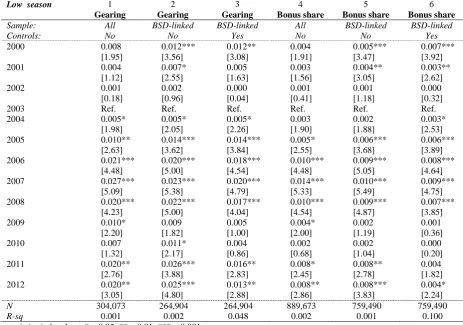
controlling for a range of firm characteristics taken from the MWSS and BSD.viii The
coefficients from these regressions after controlling for compositional changes, confirming
statistically significant increases in each series over the mid-2000s. The full results are
presented in Appendix Table A1.ix
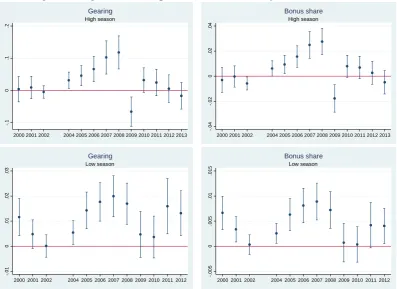
[INSERT FIGURE 7 HERE]
Table 1 (Part A, column 5) showed that, in the "high" season, there was a statistically
significant increase of about 5 percentage points in the total pay bill accounted for by bonuses
between 2003 and 2008. Figure 7 (upper right panel) shows that just under half of this is
accounted for by compositional change in firms, but there remains a statistically significant
rise of almost three percentage points in the bonus share over the period.x Correspondingly,
none of the 11 percentage point high-season increase in the gearing of bonuses to base pay
over the same period can be accounted for by compositional changes. Similar trends are
apparent in the "low" season, though the magnitudes are smaller.
We infer from the analysis above that there was a growth in the economic importance of PRP
in Britain in the mid-2000s. This arose through increases in the size of bonus payments
relative to base pay in PRP firms, rather than a growth in the proportion of all firms using
PRP. It was not merely the product of changes in the make-up of the economy. .
As the employment series in Figures 5 and 6 look broadly flat during the period in the
mid-2000s when the bonus share was growing, this suggests that individual firms were changing
their behaviour in respect of bonuses over this period. The alternative proposition is that the
growth in the bonus share arose from significant churning in the population (i.e. entry and
exit from the PRP sector). We find that this is not the case. Table 2 shows that, within the
subset of firms that we observe paying PRP in both periods (2003 and 2007), the same
increase in gearing was evident as seen among the population at large. Put simply, the
aggregate changes were not merely the product of switching or entry and exit; instead
changes in the gearing of bonuses to base pay within continuing firms were economically the
more important feature of the PRP landscape over this period.
[TABLE 2 HERE]
Turning back to the aggregate trend in bonus payments, the fact that the rise in the bonus
share ceased in 2008 with the onset of recession indicates some pro-cyclicality in bonus
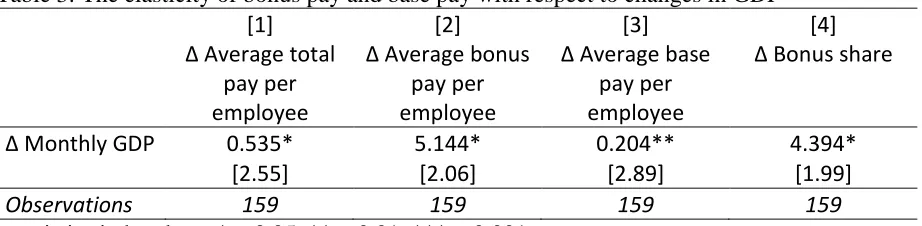
payments which exceeded any pro-cyclicality in base pay. To investigate this issue further,
we augmented our dataset with a measure of monthly GDP (NIESR, 2015) and examined the
relative elasticities of bonuses and base wages with respect to movements in national output.
The output measure is the three-month moving average of monthly GDP. We compute the
business cycle. From our MWSS dataset we compute the equivalent three-month moving
averages for total pay, bonus pay and base pay per employee, along with the three-month
moving average of the bonus share (the share of all wages paid out as bonuses in the
economy in a given month). We then compute the monthly growth rate in each of these
measures and regress each in turn on the growth rate in GDP, adding month fixed effects to
each regression in order to control for the strong seasonality in total pay and bonus pay. The
results are presented in Table 3. They show that bonuses are indeed more responsive than
base pay to the business cycle. This is evident both in the fact that the elasticity of total
payments with respect to changes in GDP is greater than the elasticity of base pay (the
coefficients in models 1 and 3 are statistically significant from one another at the 5% level:
κ2=4.64, p=0.03), and also in the fact that movements in the bonus share and GDP are
positively correlated (p=0.048).
[TABLE 3 HERE]
So far our analyses have been conducted for the whole economy but, as noted earlier, the
Finance sector has traditionally played an important role in bonus payments in Britain. The
Finance sector is important in any discussion of performance pay because its firms are the
most likely of those in any sector to pay bonuses and those bonuses tend to be very large.
Table 4 shows the economic significance of the Finance sector in respect of bonuses, by
computing the share of all bonus pay – and the share of all base pay - that was paid out to
Finance sector workers in our sample period. The share of all bonus pay going to workers in
the Finance sector is around two-fifths, but in contrast, they account for only 7 per cent of
base pay. Finance is the dominant player in the aggregate picture on bonuses in the British
economy.
[INSERT TABLE 4 HERE]
This raises a question about the size and direction of movements in the gearing and the bonus
share across the economy, once the dominant influence of Finance is removed. Repeating
our regression analysis after having excluded firms from the Finance sector, we find the
trends are much less dramatic than for the whole economy: there is still some growth in
bonus pay, but it is considerably smaller in absolute terms. Again, however, it is changes in
the gearing that are critical in driving the overall picture. Without Finance, the bonus share in
the economy rises by around 1 percentage point between 2003 and 2007 in both the high and
low-season series. All of this increase is caused by changes in the gearing of bonuses to base
pay within the PRP sector, which rises by around 2 percentage points in either series. There is
then a countervailing effect which arises from a decline in the size of the PRP sector (which
What these results highlight is that much of the dramatic change in the bonus share seen in
the economy at large can be attributed to movements in the gearing ratio of bonuses to base
pay within the Finance sector. Outside the Finance sector, the changes have been
considerably more modest. But even here, the gearing (the multiplier that PRP firms opt to
apply to the fixed part of their wage bill when deciding on the total amount of remuneration
in the firm) is the key factor. And whilst the variations are less important economically once
one moves outside of Finance, the broad trends are nonetheless similar.
5. Conclusion
Despite its potential to raise productivity, performance-related-pay (PRP) is not widespread
in market-oriented economies. Furthermore, despite secular changes conducive to its take-up,
there is mixed evidence as to whether it has become more prominent over time. Ours is the
first paper to present firm-level data for the Britain on both the incidence and size of bonus
payments in the 2000s. We decompose the share of the total wage bill accounted for by
bonuses into the shares of employment in the PRP and non-PRP sectors, the ratio of base pay
between the two sectors, and the gearing of bonus payments to base pay within the PRP
sector. We hypothesise that there will have been a secular rise in the use of PRP in Britain
and show that there was some growth in the share of total pay accounted for by bonuses in
Britain in the mid-2000s. However this rise – and subsequent fluctuations since the onset of
recession in 2008 – can be almost entirely explained by changes in the gearing of bonus to
base pay within the PRP sector. There has been no substantial change in the percentage of
employment accounted for by PRP firms; if anything it has fallen over the past decade.
As the share of wages paid out in bonuses fell in recession, this suggests that bonuses are
procyclical. We show that this is indeed the case by augmenting our dataset with a measure
of national output and demonstrating that the cyclicality of bonuses is greater than for base
pay. Finally, we hypothesise that aggregate patterns of PRP in Britain will be heavily
influenced by practice in the Finance sector. We show that the Finance industry accounts for
a large proportion of all bonus payments in the British economy, and we also show that the
movements in the gearing of bonuses to base pay in the economy at large are considerably
muted once the Finance sector is set aside. . One implication is that further research is needed
on how firms – particularly in Finance but also elsewhere in the economy – decide upon the
References
Bandiera, O., Barankay, I. and Rasul, I. (2007) “Incentives for Managements and Inequality
Among Workers: Evidence from a firm-level experiment” The Quarterly Journal of
Economics, 122(2): 729-773
Bell, B. and Van Reenen, J. (2010) "Bankers and Extreme Wage Inequality in the UK",
Special Paper No. 21, Centre for Economic Performance, London School of Economics,
April.
Bell, B. and Van Reenen, J. (2011) "Firm Performance and Wages: Evidence from Across the
Corporate Hierarchy", Discussion Paper No. 1088, Centre for Economic Performance,
London School of Economics, November.
Bell B. and Van Reenen J. (2013) “Bankers and their bonuses”, Occasional Paper No. 35,
Centre for Economic Performance, London School of Economics, February.
Benabou R and Tirole J (2003) “Intrinsic and extrinsic motivation”, Review of Economic
Studies, 70: 489-520.
Blanchflower D., Oswald A. and Sanfey P (1996) “Wages, profits and rent-sharing”,
Quarterly Journal of Economics, 111, 1: 227-251.
Bryson, A. and Forth, J. (2011) “Trade Unions”, Gregg P. and Wadsworth J. (eds.) The
Labour Market in Winter: the State of Working Britain, Oxford University Press, Oxford,
pp.255-271.
Bryson, A., Freeman, R., Lucifora, C., Pellizzari, M and Perotin, V. (2013) "Paying for
Performance: Incentive Pay Schemes and Employees' Financial Participation", in Boeri T.,
Lucifora C. and Murphy K. (eds.) Executive Remuneration and Employee
Performance-related Pay: A Transatlantic Perspective, Oxford University Press, Oxford, pp.123-268.
Dohman T and Falk A (2011) “Performance pay and multidimensional sorting: productivity,
preferences and gender”, American Economic Review, 101: 556-590.
Dube, A. and Freeman, R. B. (2010), "Complementarity of Shared Compensation and
Decision Making Systems: Evidence from the American Labor Market", in Kruse D.,
Freeman R. and Blasi J. (eds.) Shared Capitalism at Work: Employee Ownership, Profit
and Gain Sharing and Broad-based Stock Options, University of Chicago Press, Chicago,
pp.167-200.
Freeman, R. and Kleiner, M. (2005), “The Last American Shoe Manufacturers: Decreasing
Productivity and Increasing Profits in the Shift from Piece Rates to Continuous Flow
Production,” Industrial Relations, 44(2): 307-330.
Frick B, Goetzen U and Simmons R (2015) “The hidden costs of high-performance work
practices: evidence from a large German steel company”, Industrial and Labor Relations
Review, 66, 1: 198-224.
Gittleman, M. and Pierce, G. (2013a) "How Relevant is Performance Related Pay in the
United States? Current Incidence and Recent Trends", National Institute Economic
Review, No. 226, November, R4-R16.
Gittleman, M. and Pierce, G. (2013b) "Pay for Performance and Compensation Inequality:
Evidence from the ECEC", Working Paper 465, US Bureau of Labor Statistics,
Washington, September.
Gregg, P. and Machin, S. J. (2012) What a Drag: The Chilling Impact of Unemployment on
Real Wages, London: The Resolution Foundation.
Heywood, J. S. and Parent, D. (2012) "Performance Pay and the White-Black Wage Gap",
Journal of Labor Economics, 30, 2: 249-290.
Heywood, J. S. and Parent, D. (2013) "Performance Pay, the Gender Earnings Gap and
Parental Status", mimeo.
Kruse, D. L., Blasi, J. R., and Park, R. (2010), “Shared Capitalism in the US Economy:
Prevalence, Characteristics and Employee Views of Financial Participation in
Enterprises”, in Kruse D., Freeman R. and Blasi J. (eds.) Shared Capitalism at Work:
Employee Ownership, Profit and Gain Sharing and Broad-based Stock Options,
University of Chicago Press, Chicago, pp.41-76.
Lazear, E. (1986) “Salaries and piece rates” Journal of Business, 59: 405-31.
Lazear, E. (2000) "Performance pay and productivity", American Economic Review, 90:
1346-1361.
Lemieux, T., MacLeod, W. B. and Parent, D. (2009) "Performance Pay and Wage Inequality"
Quarterly Journal of Economics, 124 (1): 1–49.
Levine D (1991) “Cohesiveness, productivity and wage dispersion”, Journal of Economic
Belfield R and Marsden D (2003) “Performance pay, monitoring environments, and
establishment performance”, International Journal of Manpower, 24, 4: 452-471.
McGovern, P., Hill, S., Mills, C. and White, M. (2007) Market, Class and Employment,
Oxford University Press, Oxford.
NIESR (2015) NIESR Monthly Estimates of GDP, May 2015, London: NIESR. Available
online at: http://www.niesr.ac.uk.
Office for National Statistics (2011) Average Weekly Earnings: Quality and Methodology
Information Paper, Office for National Statistics, Newport.
O'Halloran, P. (2013) "Union Coverage, Membership and Performance-related Pay: Are
Piece Rates Different?" National Institute Economic Review, November, R1-R12.
Pendleton, A., Whitfield, K. and Bryson, A. (2009) ‘The changing use of contingent pay in
the modern British workplace’, in Brown W., Bryson A., Forth J. and Whitfield K. (eds.)
The Evolution of the Modern Workplace, Cambridge University Press, Cambridge, pp.
256-284.
Prendergast, C. (1999) ‘The provision of incentives in firms’ Journal of Economic Literature,
37, 1: 7 – 63.
Prendergast, C. (2000), “What Trade-Off of Risk and Incentives?”, American Economic
Review, 90(2): 421-425.
Prendergast, C. (2002a), “The Tenuous Trade-off between Risk and Incentives”, Journal of
Political Economy, 110(5): 1071-1102.
Prendergast, C. (2002b), “Uncertainty and Incentives”, Journal of Political Economy, 20(2):
S115-S137.
Shearer, B. (2004) "Piece rates, fixed wages and incentive effects: evidence from a field
experiment", Review of Economic Studies, 71: 514-534.
Van Wanrooy, B., Bewley, H., Bryson, A., Forth, J., Freeth, S., Stokes, L. and Wood, S.
(2013) The 2011 Workplace Employment Relations Study First Findings, Department for
Figure 1: Total pay with and without bonuses, whole economy
4
00
4
50
5
00
5
50
6
00
£ pe
r
w
ee
k
(
2
01
2 pr
ic
es
)
200001 200101 200201 200301 200401 200501 200601 200701 200801 200901 201001 201101 201201 201301
Year/month
Total pay Excluding bonuses
Source: Monthly Wages and Salaries Survey
Whole economy
Figure 2: Bonuses as a percentage of the total weekly pay bill, whole economy
Figure 3: Growth rate in bonuses compared to previous season, whole economy
0 5 10 15 Pe rce n t
200001200101 200201 200301 200401 200501200601 200701 200801 200901 201001201101 201201 201301
Year/month
Source: Monthly Wages and Salaries Survey
Whole economy
Bonuses as % of total weekly pay bill
-3 0 -2 0 -1 0 0 10 20 Pe rce n t 2001H 2001L 2002H 2002L 2003H 2003L 2004H 2004L 2005H 2005L 2006H 2006L 2007H 2007L 2008H 2008L 2009H 2009L 2010H 2010L 2011H 2011L 2012H 2012L 2013H Bonus season
Source: Monthly Wages and Salaries Survey
Whole economy
[image:22.595.78.509.413.682.2]Figure 4: Decomposition of change in proportion of wage bill accounted for by bonuses
Figure 5: Movement in components explaining change in bonus payments as percentage of total wage bill during "high" season (index where 2000=100)
0
.5
1
1
.5
Pe
rce
n
t
200001 200101 200201 200301 200401 200501 200601 200701 200801 200901 201001 201101 201201 201301
Year/month
Gearing Base pay ratio
Employment ratio
Source: Monthly Wages and Salaries Survey
Whole economy
Movements in components of bonus share
.8
1
1
.2
1
.4
1
.6
Ind
ex
(
20
00
=
1
00
)
2000 2001 2002 2003 2004 2005 2006 2007 2008 2009 2010 2011 2012 2013
Year
Gearing Base pay ratio
Employment ratio
Source: Monthly Wages and Salaries Survey
High season
[image:23.595.77.509.427.699.2]Figure 6: Movement in components explaining change in bonus payments as percentage of total wage bill during "low" season (index where 2000=100)
.8
1
1
.2
1
.4
1
.6
Ind
ex
(
20
00
=
1
00
)
2000 2001 2002 2003 2004 2005 2006 2007 2008 2009 2010 2011 2012 2013
Year
Gearing Base pay ratio
Employment ratio
Source: Monthly Wages and Salaries Survey
Low season
Figure 7: Movements in gearing and bonus share, high season and low season, after controlling for changes in the composition of the economy
Source: Monthly Wages and Salaries Survey
Notes: Point estimates represent coefficients from regressions with controls for changes in the composition of the economy (Reference = 2003). Capped bars show 95% confidence intervals. Full results are presented in Table A1.
-.
1
0
.1
.2
2000 2001 2002 2004 2005 2006 2007 2008 2009 2010 2011 2012 2013 High season
Gearing
-.
04
-.
02
0
.02
.04
2000 2001 2002 2004 2005 2006 2007 2008 2009 2010 2011 2012 2013 High season
Bonus share
-.
01
0
.01
.02
.03
2000 2001 2002 2004 2005 2006 2007 2008 2009 2010 2011 2012 Low season
Gearing
-.
00
5
0
.00
5
.01
.01
5
2000 2001 2002 2004 2005 2006 2007 2008 2009 2010 2011 2012 Low season
Table 1: Shift-share analysis accounting for change in proportion of all pay accounted for by bonuses, selected years
Part A: High season
EP RP GB B
Change
in B Due to EP Due to RP Due to GB Residual
Start 2000 1.07 1.03 17.8% 8.6%
Trough 2003 1.16 1.05 16.3% 8.2% -0.32 0.29 0.08 -0.66 -0.03
Peak 2007 1.16 1.05 27.3% 13.1% 4.84 0.01 0.00 4.83 0.00
Trough 2009 1.14 1.05 17.5% 8.7% -4.38 -0.13 0.00 -4.29 0.04
Peak 2011 1.04 1.05 22.6% 10.5% 1.80 -0.34 -0.02 2.25 -0.08
End 2013 1.06 1.06 19.1% 9.2% -1.32 0.10 0.04 -1.45 -0.02
Source: Monthly Wages and Salaries Survey
Part B: Low season
EP RP GB B
Change
in B Due to EP Due to RP Due to GB Residual
Start 2000 1.12 1.02 7.8% 4.0%
Trough 2003 1.10 1.03 7.0% 3.6% -0.38 -0.03 0.02 -0.38 0.00
Peak 2007 1.12 1.04 9.8% 5.0% 1.37 0.03 0.00 1.32 0.01
Trough 2010 1.00 1.03 7.7% 3.8% -1.20 -0.25 -0.01 -0.99 0.05
End 2012 1.02 1.05 9.0% 4.4% 0.66 0.03 0.03 0.60 0.01
Table 2: Variations in gearing, 2003 and 2007
Source: Monthly Wages and Salaries Survey
Table 3: The elasticity of bonus pay and base pay with respect to changes in GDP
[1] [2] [3] [4]
Δ Average total
pay per employee
Δ Average bonus
pay per employee
Δ Average base
pay per employee
Δ Bonus share
Δ Monthly GDP 0.535* 5.144* 0.204** 4.394*
[2.55] [2.06] [2.89] [1.99]
Observations 159 159 159 159
t-statistics in brackets; *p<0.05, **p<0.01, ***p<0.001
Source: Monthly Wages and Salaries Survey and NIESR (2015) See text for variable definitions.
Table 4: Sectoral shares of all base pay and bonus pay, Jan 2000 – March 2013
NACE Rev 1.1
Section(s) Share of all bonus pay Share of all regular pay
Finance J 39% 7%
Other private services G-I, K, O 45% 45%
Production A-F 15% 21%
Public services L-N 1% 26%
Total 100% 100%
Source: Monthly Wages and Salaries Survey
High season Low season
2003 2007 2003 2007
Firms paying PRP in both
[image:27.612.74.535.198.311.2]Appendix A
Table A1: Regressions for employment share, gearing and bonus share in "high" and "low" seasons, whole economy
High season 1 2 3 4 5 6
Gearing Gearing Gearing Bonus share Bonus share Bonus share
Sample: All BSD-linked BSD-linked All BSD-linked BSD-linked
Controls: No No Yes No No Yes
2000 0.015 -0.002 0.004 0.003 -0.002 -0.003
[1.03] [-0.11] [0.21] [0.50] [-0.33] [-0.60]
2001 0.031* 0.010 0.009 0.015* 0.006 0.000
[2.20] [0.73] [0.53] [2.41] [1.05] [-0.06]
2002 0.000 0.005 -0.005 0.001 0.003 -0.006*
[-0.00] [0.65] [-0.48] [0.20] [0.89] [-2.21]
2003 Ref. Ref. Ref. Ref. Ref. Ref.
2004 0.023* 0.030* 0.032* 0.010* 0.011* 0.006*
[2.33] [2.27] [2.47] [2.20] [2.14] [1.97]
2005 0.036** 0.040* 0.046** 0.016** 0.016* 0.009*
[3.15] [2.52] [2.88] [3.08] [2.45] [2.52]
2006 0.068*** 0.067** 0.067*** 0.029*** 0.027*** 0.016***
[4.22] [3.26] [3.35] [4.38] [3.32] [3.57]
2007 0.110*** 0.118*** 0.103*** 0.048*** 0.046*** 0.025***
[4.68] [4.09] [3.91] [5.25] [4.31] [4.58]
2008 0.111*** 0.139*** 0.118*** 0.048*** 0.053*** 0.028***
[5.00] [4.85] [4.52] [5.60] [5.13] [5.19]
2009 0.012 -0.049** -0.066** 0.005 -0.019** -0.018**
[0.99] [-2.78] [-2.83] [0.85] [-2.69] [-3.18]
2010 0.053** 0.041 0.032 0.021** 0.012 0.008
[3.07] [1.91] [1.66] [2.88] [1.43] [1.76]
2011 0.063** 0.066** 0.025 0.023** 0.018* 0.007
[3.02] [2.83] [1.18] [2.84] [2.16] [1.54]
2012 0.042* 0.061** 0.006 0.015* 0.017* 0.003
[2.55] [3.26] [0.26] [2.33] [2.38] [0.58]
2013 0.028 0.031 -0.017 0.009 0.008 -0.005
[1.73] [1.63] [-0.79] [1.46] [1.15] [-1.02]
N 173,951 145,259 145,259 479,113 389,589 389,589
R-sq 0.001 0.003 0.109 0.005 0.007 0.409
1 Table A1 continued
Low season 1 2 3 4 5 6
Gearing Gearing Gearing Bonus share Bonus share Bonus share
Sample: All BSD-linked BSD-linked All BSD-linked BSD-linked
Controls: No No Yes No No Yes
2000 0.008 0.012*** 0.012** 0.004 0.005*** 0.007***
[1.95] [3.56] [3.08] [1.91] [3.47] [3.92]
2001 0.004 0.007* 0.005 0.003 0.004** 0.003**
[1.12] [2.55] [1.63] [1.56] [3.05] [2.62]
2002 0.001 0.002 0.000 0.001 0.001 0.000
[0.18] [0.96] [0.04] [0.41] [1.18] [0.32]
2003 Ref. Ref. Ref. Ref. Ref. Ref.
2004 0.005* 0.005* 0.005* 0.003 0.002 0.003*
[1.98] [2.05] [2.26] [1.90] [1.88] [2.53]
2005 0.010** 0.014*** 0.014*** 0.005* 0.006*** 0.006***
[2.63] [3.62] [3.84] [2.55] [3.68] [3.89]
2006 0.021*** 0.020*** 0.018*** 0.010*** 0.009*** 0.008***
[4.48] [5.00] [4.54] [4.48] [5.05] [4.64]
2007 0.027*** 0.023*** 0.020*** 0.014*** 0.010*** 0.009***
[5.09] [5.38] [4.79] [5.33] [5.49] [4.75]
2008 0.020*** 0.022*** 0.017*** 0.010*** 0.009*** 0.007***
[4.23] [5.00] [4.04] [4.54] [4.87] [3.85]
2009 0.010* 0.009 0.005 0.004* 0.002 0.001
[2.20] [1.82] [1.00] [2.00] [1.19] [0.36]
2010 0.007 0.011* 0.004 0.002 0.002 0.000
[1.32] [2.17] [0.86] [0.68] [1.04] [0.20]
2011 0.020** 0.026*** 0.016** 0.008* 0.008** 0.004
[2.76] [3.88] [2.83] [2.45] [2.78] [1.82]
2012 0.020** 0.025*** 0.013** 0.008** 0.008*** 0.004*
[3.05] [4.80] [2.88] [2.86] [3.83] [2.24]
N 304,073 264,904 264,904 889,673 759,490 759,490
R-sq 0.001 0.002 0.048 0.002 0.001 0.100
t-statistics in brackets; *p<0.05, **p<0.01, ***p<0.001
2 ENDNOTES
i The WERS survey, in contrast, offers only two time points since 2000 (i.e. 2004 and 2011). The MWSS
therefore offers considerable advantages in terms of being able to observe the periodicity and cyclicality of PRP.
ii As Prendergast notes (1999: 10), where a worker is paid a fixed salary in a given period “despite the fact that
there is no immediate relation between pay and performance, he is likely to have incentives to exert effort because good performance will improve future contracts. Such reputational concerns imply that effort exertion can occur without explicit pay-for-performance contracts.”
iii In agency theory the standard assumption is that firms are risk neutral while workers are risk averse. The
choice of contract involves a trade-off between efficiency and insurance. With a fixed wage the worker is fully insured and exerts minimal effort, thus reducing efficiency. In a piece-rate contract the worker bears all the risk (no insurance), while eliciting higher effort and receiving higher earnings. Where output can vary stochastically workers will seek compensation for higher risk when moving from a fixed-wage to a piece-rate contract. In practice, most incentive pay schemes involve the combination of a base wage, which is fixed, and a variable component (Prendergast, 2000 and 2002a and 2002b).
iv The changing composition of the workforce accounts for almost one-third of the growth in PRP in the United
States during the early 2000s, whereas all the growth in PRP in Europe occurs within-group (Bryson et al., 2013).
v Van Wanrooy et al. (2013) note a high incidence of pay freezes in the public and private sectors since the onset
of recession which is consistent with greater cyclicality in earnings more generally.
vi For weekly-paid employees, the survey asks for total pay paid to employees in the last week of the month. vii Note that the high season for 2000 is not a full season because it omits December 1999.
viii The controls are industry sector; base pay per employee (quartiles); foreign-ownership; legal status; age;
organisation size - employment; organisation size - number of sites; region.
ix For each dependent variable, Table A1 first presents estimates for the full sample used in all figures presented
above, in which the only regressors are the year dummies (see columns 1 and 4). Table A1 then goes on to present estimates from the BSD-linked sample without controls and with the removal of all imputed values in MWSS (columns 2 and 5). The imputations are undertaken by the ONS, which uses real and imputed values in its construction of its measure of Average Weekly Earnings (ONS, 2011).These estimates then provide the benchmark for a more complete specification - presented in columns 3 and 6 - in which a range of firm characteristics taken from MWSS and the BSD are added in order to strip the year dummies of the effects of compositional change.
x This seems to be largely to do with removing the influence of industry. Finance accounts for a slightly larger
share of wage-weighted employment between 2003 and 2007 and, although there are more sizeable shifts elsewhere (e.g. decline of manufacturing, growth of the education and health sectors), these are much less important than Finance in terms of bonus paying. A small increase in the size of the Finance sector is sufficient to make a sizeable impact on the overall trend.
xi Full results are provided in Table 5 of [reference omitted for blind refereeing – see supplementary file