City, University of London Institutional Repository
Citation: Gami, A. (2016). Experimental and computational analysis for insect inspired
flapping wing micro air vehicles. (Unpublished Doctoral thesis, City, University of London)
This is the accepted version of the paper.
This version of the publication may differ from the final published
version.
Permanent repository link: http://openaccess.city.ac.uk/17454/
Link to published version:
Copyright and reuse: City Research Online aims to make research
outputs of City, University of London available to a wider audience.
Copyright and Moral Rights remain with the author(s) and/or copyright
holders. URLs from City Research Online may be freely distributed and
linked to.
Experimental and Computational
Analysis for
Insect Inspired Flapping Wing Micro Air Vehicles
Anish Gami
Submitted to City University London
in partial fulfilment for the Degree of
Doctor of Philosophy
School of Mathematics, Computer Science and Engineering
Contents
Contents 1
List of Tables 5
List of Figures 7
Acknowledgement 29
Declaration 30
Abstract 31
Nomenclature 34
Abbreviations 40
1 Introduction 44
1.1 Motivation . . . 44
1.2 Nature and Insects . . . 46
1.4 MAV Applications . . . 55
1.5 Various Types of MAVs . . . 58
1.5.1 Fixed Wing Aircraft and MAVs . . . 58
1.5.2 Rotary Wing Aircraft and MAVs . . . 63
1.5.3 Flapping Wing Aircraft and MAVs . . . 67
2 Review of Literature and Background 80 2.1 Insect Wing Motion . . . 80
2.2 Large Experimental Flapping Rigs . . . 86
2.3 Ornithopter to MAV Scale Flapping Rigs and Models . . . 104
2.4 Further Review of Aerodynamics . . . 126
2.4.1 Wagner Effect . . . 128
2.4.2 Added Mass Effect . . . 129
2.4.3 Kramer Effect . . . 129
2.4.4 An Additional Review of LEV, TEV, Wake Capture, Clap & Fling and TV . . . 130
3 FWMAV Design and Analysis 146 3.1 Traditional FWMAV Design . . . 147
3.2 Model I: Design Exploration . . . 151
3.2.1 Gears and Gearbox . . . 158
3.3 Model II: Design Exploration . . . 161
3.4 Flapping Wing Model Linkage Comparison . . . 166
3.5.1 Linkage Movement . . . 175
3.5.2 Kinematic Results . . . 180
3.6 Wing Morphology and Experimental Wings . . . 182
3.6.1 Wing Morphology . . . 182
3.6.2 Experimental Wings . . . 186
3.7 Measurements for Both MAV Models . . . 188
4 Experimental Methodology 206 4.1 Experimental Equipment and Arrangement . . . 206
4.2 Force Measurement System . . . 233
4.3 Experiments Performed with Analysis . . . 240
4.4 Wing Kinematics Measurement . . . 260
5 Simulation Results 280 5.1 Wing Kinematics, Non-Dimensional Parameters & Further Aerodynamics . . . 283
5.1.1 Wing Kinematics . . . 283
5.1.2 Non-Dimensional Parameters . . . 290
5.1.3 Further CFD Review Related to Flapping Wings . . . 292
5.2 Cases Simulated . . . 304
5.2.1 Drosophila . . . 304
5.2.2 Rectangular Wing . . . 314
6 Experimental Results 367
6.1 Force & Moment Measurements for Model 1 (Sym Only) . . . 369
6.1.1 Flapping Only for 47 mm Wings (WT3) . . . 369
6.1.2 Wing Motion Analysis for Model 1 . . . 376
6.1.3 Flapping Only for 60 mm Wings (WT4) . . . 385
6.1.4 Flapping & Rotation for 60 mm Wings (WT4) . . . 393
6.1.5 Flapping & Rotation with Asymmetric Pitching for 60 mm Wings (WT4) . . . 410
6.2 Force & Moment Measurements for Model 2 (Sym & Asym) . . . 421
6.2.1 Wing Motion Analysis for Model 2 (Sym & Asym) . . . 421
6.2.2 Flapping Only for 60 mm Wings (WT4) . . . 428
6.2.3 Flapping and Rotation for 60 mm Wings (WT4) . . . 431
7 Conclusion and Recommendations 440 7.1 Conclusion . . . 440
7.2 Recommendations . . . 448
Bibliography 451
A Experimental Images and Arrangements 461
B Further Experimental Results 464
C Further CFD Results and Grids etc. 469
List of Tables
1.1 Insect Data for Various Species (Azuma 2006) . . . 52
1.2 Flapping Wing Aircraft and MAVs . . . 79
3.1 Specifications For Traditional Style MAVs shown in Figures 3.1 and 3.2 . . . 151
3.2 Stroke Angles & Percentage Differences . . . 173
3.3 Specifications For Wings shown in Figure 3.18 . . . 187
3.4 Statistical Power Data for Model 1 Mechanism Only . . . 195
3.5 Statistical Power Data for Model 1 with 52 mm Carbon Fibre Bars . . . 204
3.6 Summary of Flapping Models . . . 205
3.7 Summary of Wings Utilised . . . 205
4.1 Names of The Equipment Shown in Figures 4.1 and 4.2 . . . 210
4.2 Arri Light Illuminance Data . . . 213
4.3 Materials Used in The 0 degree Inclination Experimental Setup Shown in Figures 4.4 and 4.5218 5.1 Insect Data for Hovering Flight Mode (Liu et al. 2009) . . . 300
5.3 Rectangular Wing Specifications. . . 317
5.4 Simulations Performed for a Rectangular Wing Moving in a Horizontal Plane . . . 317
5.5 Grid Density for 60 mm Experimental Wing (WT4) . . . 360
6.1 Experiments Performed with Both Models . . . 368
6.2 Flapping Cases for 60 mm Wings (WT4) . . . 386
6.3 Flapping and Rotation Cases at 0 Degree Inclination for 60 mm Wings (WT4) . . . 393
List of Figures
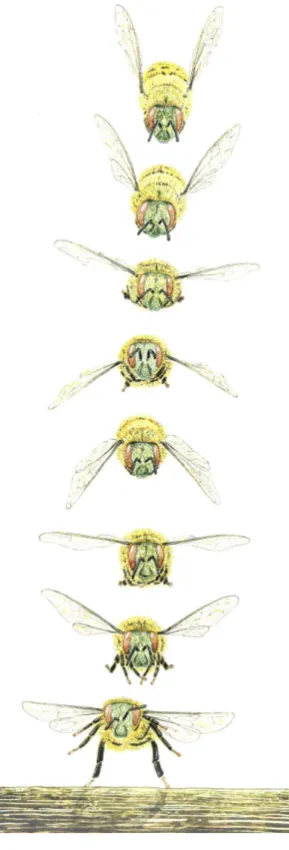
1.1 Bee Alighting Sequence Side View Whilst Carrying Pollen (Goodman 2003) . . . 49
1.2 Bee Alighting Sequence Front View (Goodman 2003). . . 49
1.3 Insect Flight Muscles; A: Direct and Indirect Dorsoventral Muscles, B: Indirect Dorsoventral and Longitudinal Muscles. Dark Muscles are Contracted, Light Muscles are Relaxed and Stretched, Dark Arrows are The Direction of Wing Movement and Light Arrows are The Direction of The Notum (Goodman 2003) . . . 54
1.4 Pointer FQM-151A (AeroVironment Inc A) . . . 58
1.5 Black Widow (AeroVironment Inc B) . . . 59
1.6 Wasp III (Designation Systems) . . . 59
1.7 Wasp AE (AV media gallery) . . . 60
1.8 Gust Resistant MAV (Galinski et al. 2010) . . . 61
1.9 Carbon Butterfly (Plantraco A) . . . 61
1.10 Micro MAV Chevron (Plantraco B) . . . 62
1.11 MAV-07 (Prox Dynamics A) . . . 63
1.12 Picoflyer (Prox Dynamics A). . . 64
1.14 Skybotix Autonomous UAV Micro Helicopter Drone (Skybotix Helicopter Robot Shop B) . . . 65
1.15 Xtreme 2.0 Gen II Quadcopter (Xtreme Quadcopter Robot Shop). . . 66
1.16 One Gram Ornithopter (Prox Dynamics B). . . 67
1.17 Micromechanical Flying Insect (Steltz et al. 2007) . . . 68
1.18 Microrobotic Fly - RoboBee (Wood 2008a) . . . 69
1.19 i-Fly Vamp (Go Radio Controlled) . . . 70
1.20 Microbat; A: Super Capacitor Powered; B: Battery Powered; C: Battery Powered with R/C Navigation (Pornsin-Sirirak et al. 2001) . . . 71
1.21 Beetle Mimicking Flapper (Nguyen et al. 2009). . . 72
1.22 Konkuk Ornithopters & MAVs; A: 360 mm Wing Span; B: 280 mm Wing Span; C: 150 mm Wing Span; D: 100 mm Wing Span (Park et al. 2008) . . . 73
1.23 Nano Hummingbird (AeroVironment Inc G) . . . 74
1.24 Delfly I: A & Delfly II: B (Delfly Website B) . . . 76
1.25 Micro Delfly (Delfly Website C) . . . 76
1.26 Hummingbird MAV (Nakata et al. 2011) . . . 76
1.27 Cornell MAV (Richter & Lipson 2011) . . . 78
2.1 Stages of Wing Motion. . . 81
2.2 Wingtip Paths for Various Insects; A: Albatross (Fast Gait), B: Pigeon (Slow Gait), C: Horse-shoe Bat (Fast Flight), D: HorHorse-shoe Bat (Slow Gait), E: Blow Fly, F: Locust, G: June Beetle, H: Fruit Fly (Shyy et al. 2013). . . 82
2.3 Bumblebee Flight Mode Alteration (Shyy et al. 2013) . . . 83
2.5 Insect Wing Coordinate Frame . . . 85
2.6 Robofly Experimental Rig (University of California Berkeley) . . . 88
2.7 Two-Dimensional Wing Path. Black Line: Instantaneous Wing position, Black Dot: Leading Edge, Red Arrow: Instantaneous Force Vectors. (Dickinson et al. 1999). . . 88
2.8 PIV Images of Fluid Dynamics for Three Different Wing Rotation Phases (Dickinson et al. 1999) 90 2.9 Diagram Portraying A Summary of Flow Dynamics, red: counter-clockwise vorticity, blue: clockwise vorticity, lighter shades represent vorticity from the previous stroke (Birch et al. 2003) 92 2.10 Smoke Visualisation via A Hawkmoth Flapping Rig (Van Den Berg et al. 1997) . . . 93
2.11 Sketch of Flow Behaviour (Van Den Berg et al. 1997) . . . 95
2.12 Diagram of Test Setup for a Flapping Wing in a Water Tunnel (Nagai et al. 2008) . . . 96
2.13 Single Wing and Two Wing Fluid Visualisation for Interval of End Upstroke-Start Downstroke (Lehmann et al. 2005) . . . 99
2.14 Overview of Clap-and-Fling Flight Mechanism (Lehmann et al. 2005) . . . 100
2.15 Iso-Surface of Vorticity Magnitude for Flexible Wing (Percin et al. 2011) . . . 103
2.16 U.S. Army Research Lab FWMAV (Hall et al. 2012) . . . 105
2.17 Hummingbird inspired FWMAV (Nakata et al. 2011) . . . 105
2.18 Cybird P1 with Body Attached and Mounted on Sting (left), Crank-Gear Mechanism with Flapping Arms (right) (Hu et al. 2010) . . . 109
2.19 Four-Winged MAV (Bolsman et al. 2009) . . . 110
2.20 Flapper Actuated by LIPCA Version 1 (Syaifuddin et al. 2006) . . . 112
2.21 Flapper Actuated by LIPCA Version 2 (Nguyen et al. 2008) . . . 113
2.22 Flapper Actuated by LIPCA Version 3 with Acrylic Links (Nguyen et al. 2007) . . . 114
2.24 Flapping Wing MAV with Two Actuators (Anderson 2011a) . . . 119
2.25 Clap-and-Fling X-Type MAV (Kawamura et al. 2008) . . . 121
2.26 Harvard RoboBee with A Hybrid Power-Control Actuator (Finio et al. 2009a) . . . 123
2.27 Harvard RoboBee with Stabilising Dampers (Teoh et al. 2012) . . . 125
2.28 Re Influence on the Drag Coefficient for a Circular Cylinder (Anderson 1986) . . . 126
2.29 Flow Around A Circular Cylinder (Anderson 1986) . . . 127
2.30 Simplified Wake Capture Schematic During Stroke Reversal (Sane 2003) . . . 131
2.31 Vorticity Images for Both Cases (Birch et al. 2003) . . . 141
3.1 Single Gear MAV Enclosed in a Bee-Like Body . . . 149
3.2 Two Gear MAV Enclosed in a Elliptic Body . . . 150
3.3 Model 1 Shown in a Variety of Views with Maximum Dimensions; A: Front View, B: Side View, C: Top View, D: Back Isometric View, E: Front Isometric View . . . 155
3.4 Parts from The Model with Their Designated Titles. . . 157
3.5 Model 2 Shown in a Variety of Views with Maximum Dimensions; A: Front View, B: Side View, C: Top View, D: Back Isometric View, E: Front Isometric View . . . 162
3.6 Vertical Guide Comparison for Both Models with Plate Connection Diagram; A: Model 1, B: Model 2 Sym Configuration, C: Model 2 Asym Configuration, D: Model 2 Sym Configuration Isometric View, E: Model 2 Asym Configuration Isometric View, F: Model 2 Connection of Vertical Guide Plate . . . 165
3.7 Experimental and CAD Images of the Linkage Mechanism During Downstroke . . . 169
3.8 Experimental and CAD Images of the Linkage Mechanism During Upstroke . . . 170
3.10 Tolerance Data for CAD Model in Symmetric Configuration . . . 172
3.11 Links and Co-ordinates for Mechanism; Blue Dots: Fixed Pivot Location, Red Dots: Variable Location . . . 174
3.12 Linkage Mechanism in Neutral Position with Angles . . . 175
3.13 Linkage Mechanism Displaced from Neutral Position with Angles . . . 177
3.14 Linkage Mechanism in Three Different Positions; Blue: Neutral Position, Red: Start Down-stroke Position, Green: Start UpDown-stroke Position . . . 181
3.15 Angle Input to The System Related to Output Angle . . . 181
3.16 Linkage Mechanism with Angle In and Angle Out . . . 182
3.17 Schematic Illustration of a Generic Wing Planform with Geometrical Details . . . 184
3.18 Experimental and CAD Wings; A: 26 mm SR Wing (WT2), B: CAD of 26 mm SR Wing (WT2), C: 47 mm Wing (WT3), D: CAD of 47 mm Wing (WT3), E: 60 mm Wing (WT4), F: CAD of 60 mm Wing (WT4) . . . 187
3.19 Power and Force Measurements of Mechanism Only; A: Model 1, B: Model 2 (sym), C: Model 2 (asym), D: Model 1, E: Model 2 (sym), F: Model 2 (asym), Coloured Dots in Graphs D,E,F Represent Axes Projections Such As Blue: Frequency Vs Vertical Force, Magenta: Frequency Vs Power, Green: Power Vs Vertical Force . . . 191
3.20 Power and Force Measurements of Mechanism Only; A: Model 1, B: Model 2 (sym), C: Model 2 (asym), D: Average Vertical Force Comparison, E: Average Power Comparison, F: Average Power / Average Vertical Force Comparison. . . 193
3.22 Power and Force Measurements of 52 mm Carbon Fibre Bar Flapping; A: Model 1, B: Model 2 (sym), C: Model 2 (asym), D: Model 1, E: Model 2 (sym), F: Model 2 (asym), Coloured Dots in Graphs D,E,F Represent Axes Projections Such as Blue: Frequency Vs Vertical Force,
Magenta: Frequency Vs Power, Green: Power Vs Vertical Force . . . 197
3.23 Power and Force Measurements of 52 mm Carbon Fibre Bar Flapping; A: Model 1, B: Model 2 (sym), C: Model 2 (asym), D: Average Vertical Force Comparison, E: Average Power Com-parison, F: Average Power / Average Vertical Force Comparison . . . 201
3.24 CAD Diagrams and Measurements for Model 1 with Carbon Fibre Bars Flapping; A: Front View of Model with Bars, B: Isometric View of Model with Bars, C: Comparison of Exper-imental Measurements and Theoretical Calculations, D: Power Required to Actuate Carbon Fibre Bars. . . 202
3.25 Normal Distribution for Power Measurements of Model 1 with 52 mm Carbon Fibre Bars; A: 3 Hz, B: 6 Hz and C: 9 Hz . . . 203
4.1 Schematic of Tests in Air . . . 208
4.2 Schematic of Vacuum Chamber Tests . . . 209
4.3 Vacuum Chamber. . . 216
4.4 Experimental Setup Top View . . . 219
4.5 Experimental Setup Side View . . . 220
4.6 Photograph of 0 Degree Inclination Setup Side View . . . 221
4.7 Photograph of 0 Degree Inclination Setup Angled View . . . 221
4.8 Hovering Experimental Setup Top View . . . 222
4.9 Hovering Experimental Setup Side View . . . 223
4.10 CAD of 0 Degree Inclination Setup Iso View . . . 224
4.12 Photograph of 90 Degree Inclination Setup . . . 225
4.13 CAD of 0 Degree Inclination Vacuum Chamber Setup Top View . . . 227
4.14 CAD of 0 Degree Inclination Vacuum Chamber Setup Side View . . . 227
4.15 CAD of 90 Degree Inclination Vacuum Chamber Setup Top View . . . 228
4.16 CAD of 90 Degree Inclination Vacuum Chamber Setup Side View . . . 228
4.17 CAD of 0 Degree Inclination Vacuum Chamber Setup Iso View . . . 229
4.18 CAD of 90 Degree Inclination Vacuum Chamber Setup Iso View . . . 229
4.19 Photograph of 0 Degree Inclination Vacuum Chamber Setup . . . 230
4.20 GUI of Software to Acquire Voltage Measurements . . . 231
4.21 GUI of Software to Acquire F/T Measurements . . . 231
4.22 Signal Produced by Reflective Sensor . . . 232
4.23 Photograph of Signal Displayed on Oscilloscope . . . 232
4.24 F/T Sensor Axes Top View . . . 235
4.25 F/T Sensor Axes Side View . . . 235
4.26 F/T Sensor Axes Iso View . . . 236
4.27 Model at 0 Degree Inclination with Force Axes Front View . . . 237
4.28 Model at 0 Degree Inclination with Force Axes Side View . . . 237
4.29 Model at 90 Degree Inclination with Force Axes Top View . . . 238
4.30 Model at 90 Degree Inclination with Force Axes Side View . . . 238
4.31 Model at 0 Degree Inclination with Force Axes Iso View . . . 239
4.33 Photograph of Cracked Mylar During Experiments . . . 242
4.34 Distances from Transducer Tool Plate . . . 243
4.35 Flapping Setup at 0 Degree Body Inclination with 60 mm Wings (WT4) . . . 244
4.36 Photograph of Flapping Setup at 0 Degree Body Inclination with 60 mm Wings (WT4) . . . . 244
4.37 Flapping Setup w/Table at 0 Degree Body Inclination with 60 mm Wings (WT4) . . . 245
4.38 Photograph of Flapping Setup w/Table at 0 Degree Body Inclination with 60 mm Wings (WT4)245 4.39 Flapping Setup w/GE at 0 Degree Body Inclination with 60 mm Wings (WT4) . . . 246
4.40 Photograph of Flapping Setup w/GE at 0 Degree Body Inclination with 60 mm Wings (WT4) 246 4.41 Flapping Setup w/TE wall at 0 Degree Body Inclination with 60 mm Wings (WT4). . . 247
4.42 Photograph of Flapping Setup w/TE wall at 0 Degree Body Inclination with 60 mm Wings (WT4) . . . 247
4.43 Flapping Setup w/TE wall and GE at 0 Degree Body Inclination with 60 mm Wings (WT4) . 248 4.44 Photograph of Flapping Setup w/TE wall and GE at 0 Degree Body Inclination with 60 mm Wings (WT4) . . . 248
4.45 Flapping Setup w/TE wall 1S at 0 Degree Body Inclination with 60 mm Wings (WT4) . . . . 249
4.46 Flapping Setup w/TE wall and GE 1S at 0 Degree Body Inclination with 60 mm Wings (WT4)249 4.47 FR Setup at 90 Degree Body Inclination with 60 mm Wings (WT4) . . . 250
4.48 FR w/GE Base Setup at 90 Degree Body Inclination with 60 mm Wings (WT4). . . 250
4.49 Photograph of Model 1 at 90 Degree Body Inclination . . . 252
4.53 Photograph of Model 2 Setup at 90 Degree Body Inclination with 60 mm Wings (WT4). . . . 254 4.54 Photograph of Model 2 Setup at 90 Degree Body Inclination with 60 mm Wings (WT4) with
Mirror Reflection View . . . 254 4.55 Vacuum Chamber Setup with Model at 0 Degree Body Inclination with 60 mm Wings (WT4) 256 4.56 Vacuum Chamber Setup with Model at 90 Degree Body Inclination with 60 mm Wings (WT4) 256 4.57 Photograph of Vac Chamber with Model at 0 Degree Body Inclination with 60 mm Wings (WT4)257 4.58 Photograph of Vac Chamber with Model at 90 Degree Body Inclination with 60 mm Wings
(WT4) . . . 257 4.59 Photograph of FW Model Flapping (Top) and Vac Chamber with Photography Equipment
(Bottom) . . . 258 4.60 CAD of Camera and Light In-Line With Wing . . . 261 4.61 CAD of Camera In-Line With Mirror Above Wing . . . 261 4.62 Wing Angle of Attack for Positive and Negative Halves (Circle Represents Leading Edge) . . 262 4.63 Wing Motion for 26 mm Semi-Rigid Wings (WT2) 50 microns 1.5 mm exposed flexible area,
Vertical Stroke Plane, D: Downstroke and U: Upstroke . . . 263 4.64 Wing Motion for 26 mm Semi-Rigid Wings (WT2) 50 microns 1.5 mm exposed flexible area
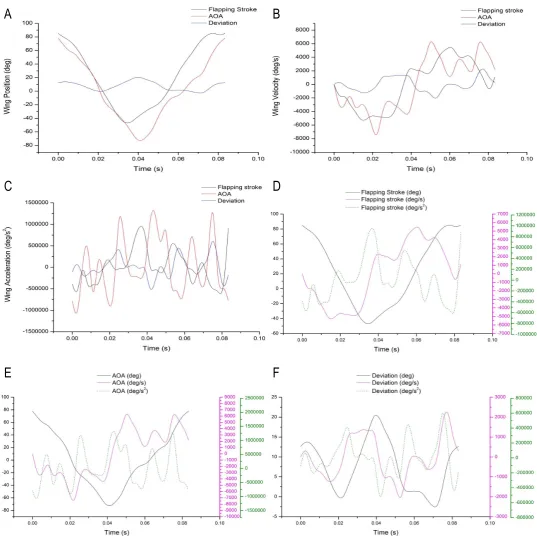
Side View, Vertical Stroke Plane, D: Downstroke and U: Upstroke . . . 264 4.65 Wing Kinematic Data for 26 mm Semi-Rigid Wings (WT2) 50 microns 1.5 mm exposed
flexible area; A:Wing Displacement Plot; B:Wing Velocity Plot; C:Wing Acceleration Plot; D:Flapping Stroke Plot; E:Angle of Attack Plot; F:Deviation Plot . . . 265 4.66 Wing Motion for 26 mm Semi-Rigid Wings (WT2) 75 microns 2 mm exposed flexible area,
4.67 Wing Kinematic Data for 26 mm Semi-Rigid Wings (WT2) 75 microns 2 mm exposed flexible area; A:Wing Position Plot; B:Wing Velocity Plot; C:Wing Acceleration Plot; D:Flapping
Stroke Plot; E: Angle of Attack Plot . . . 270
4.68 Wing Motion for 26 mm Rigid Wings (WT1) 75 microns 2 mm exposed flexible area, Vertical Stroke Plane, D: Downstroke and U: Upstroke . . . 271
4.69 Wing Motion for 26 mm Rigid Wings (WT1) 75 microns 2 mm exposed flexible area Side View, Vertical Stroke Plane, D: Downstroke and U: Upstroke . . . 272
4.70 Wing Kinematic Data for 26 mm Rigid Wings (WT1) 75 microns 2 mm exposed flexible area; A:Wing Position Plot; B:Wing Velocity Plot; C:Wing Acceleration Plot; D:Flapping Stroke Plot; E:Angle of Attack Plot; F:Deviation Plot . . . 273
4.71 Wing Motion for 26 mm Rigid Wings (WT1) 75 microns 3 mm exposed flexible area, Vertical Stroke Plane, D: Downstroke and U: Upstroke . . . 277
4.72 Wing Kinematic Data for 26 mm Rigid Wings (WT1) 75 microns 3 mm exposed flexible area; A:Wing Position Plot; B:Wing Velocity Plot; C:Wing Acceleration Plot; D:Flapping Stroke Plot; E:Angle of Attack Plot; F:Deviation Plot . . . 278
4.73 Rigid Wing Deviation Trajectory 75mic 2 mm exposed flexible area; A:Deviation with Tracking Path; B:Deviation with Velocity Path . . . 279
4.74 Wing Movement Comparison for Various Mylar Thickness’s and Lengths; A:Flapping Stroke Plot; B:Angle of Attack Plot; C:Deviation Plot; D:Deviation Motion Plot . . . 279
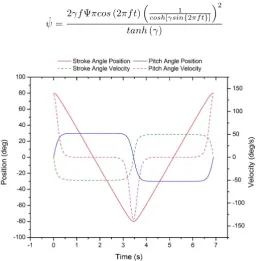
5.1 Wing Kinematics for Instantaneous Position and Velocity . . . 285
5.2 Drosophila with Ring Shaped Vortex and Downwash . . . 293
5.3 Flow Field Around Insect Wings; A: Hawkmoth, B: Drosophila . . . 295
5.4 Computational Domain with a Drosophila Wing . . . 305
5.6 Drosophila Wing Kinematics and Measurement Comparison for Various Grid Densities; A: Wing Kinematics, B: Wing Motion (green arrow: flapping, blue arrow: pitching), C: Lift Force Comparison, D: Drag Force Comparison, E: Lift Force Comparison Close-Up. . . 310 5.7 Drosophila Wing Measurement Comparison; A: Lift Force Comparison, B: Drag Force
Com-parison . . . 311 5.8 Drosophila Wing with Streamlines; A: Inner and Outer Vortex at τ = 0.25, B: Flow Field
Around Wing atτ = 0.25, C: Full Outer Vortex Travelling from Root to Tip atτ = 0.25 . . . 313 5.9 Rectangular Wing with Force Axis, Flapping is About Fy & Pitching is About Fz (Moments
Are Positive in The Anti-Clockwise Direction About Each Axes) . . . 316 5.10 Wing Pitching Schematic for Rotation Duration (Circle Represents Leading Edge) . . . 316 5.11 Kinematic and Flow Details for the Rectangular Wing; A: Kinematic Plot for Rectangular
Wing Simulations, B: Cells Surrounding The Wing, C: Rotational Positions Investigated, D: Flow Around The Wing for case 11 atτ= 0.045. Velocity Units: m/s . . . 318 5.12 Rectangular Wing Motion Through a Stroke (green arrow: flapping, blue arrow: pitching) . . 319 5.13 Flow Around The Rectangular Wing with Rotation Position D and Duration of 1.1s, Early
Downstroke . . . 320 5.14 Lift Force Comparison; A: Rotation Position D, B: Rotation Position D (average), C: Rotation
Position C, D: Rotation Position C (average), E: Rotation Position B, F: Rotation Position B (average) . . . 324 5.15 Lift Force Comparison; A: Rotation Position A, B: Rotation Position A (average), C: Rotation
Duration 3.3s, D: Rotation Duration 3.3s (average), E: Rotation Duration 2.2s, F: Rotation Duration 2.2s (average) . . . 325 5.16 Lift Force Comparison; A: Rotation Duration 1.1s, B: Rotation Duration 1.1s (average), C:
5.17 Rectangular Wing Motion for Cases 1-3; A: Case 1, B: Case 1 with Pressure on Wing Surfaces, C: Case 2, D: Case 2 with Pressure on Wing Surfaces, E: Case 3, F: Case 3 with Pressure on Wing Surfaces. . . 327 5.18 Horizontal Force Comparison; A: Rotation Position D, B: Rotation Position D (average), C:
Rotation Position C, D: Rotation Position C (average), E: Rotation Position B, F: Rotation Position B (average) . . . 332 5.19 Horizontal Force Comparison; A: Rotation Position A, B: Rotation Position A (average), C:
Rotation Duration 3.3s, D: Rotation Duration 3.3s (average), E: Rotation Duration 2.2s, F: Rotation Duration 2.2s (average) . . . 333 5.20 Horizontal Force Comparison; A: Rotation Duration 1.1s, B: Rotation Duration 1.1s
(aver-age), C: Leading Edge Mid-Chord Positions, D: Leading Edge Mid-Chord Positions (aver(aver-age), E: Average Thrust For All Cases (Legend Represents Thrust Force). . . 334 5.21 Pressure Contours of Flow Around Rectangular Wing at Mid-Span (Case 2); A: During
Down-stroke τ = 0.161, B: During Downstroke τ = 0.219, C: During Downstroke τ = 0.277, D: During Downstroke τ = 0.335, E: During Downstroke τ = 0.393, F: During Downstroke
τ= 0.451. Pressure Units: Pa . . . 335 5.22 Velocity Vectors of Flow Around Rectangular Wing at Mid-Span (Case 2); A: During
Down-stroke τ = 0.161, B: During Downstroke τ = 0.219, C: During Downstroke τ = 0.277, D: During Downstroke τ = 0.335, E: During Downstroke τ = 0.393, F: During Downstroke
τ= 0.451. Velocity Units: m/s . . . 336 5.23 Pitching Moment Comparison; A: Rotation Position D, B: Rotation Position D (average), C:
Rotation Position C, D: Rotation Position C (average), E: Rotation Position B, F: Rotation Position B (average) . . . 340 5.24 Pitching Moment Comparison; A: Rotation Position A, B: Rotation Position A (average), C:
5.25 Pitching Moment Comparison; A: Rotation Duration 1.1s, B: Rotation Duration 1.1s (aver-age), C: Leading Edge Mid-Chord Positions, D: Leading Edge Mid-Chord Positions (aver(aver-age), E: Average Pitching Moment For All Cases (Legend Represents Pitching Moment) . . . 342 5.26 Rectangular Wing in Downstroke Motion with Rotation about Mid-Chord and Leading Edge
forχ = 2.2s; A: Pressure on Wing with Mid-Chord Rotation View 1, B: Pressure on Wing with Mid-Chord Rotation View 2, C: Wing Motion with Mid-Chord Rotation, D: Pressure on Wing with Leading Edge Rotation View 1, E: Pressure on Wing with Leading Edge Rotation View 2. Pressure Units: Pa . . . 343 5.27 Rectangular Wing in Downstroke Motion with Rotation about the Leading Edge; A: Pressure
Contour of Flow Around Wing Tip with Rotation Duration as ζ = 3.3s at τ = 0.125, B: Pressure Contour of Flow Around Wing Tip with Rotation Duration as ζ = 2.2s at τ = 0.125, C: Pressure Contour of Flow Around Wing Tip with Rotation Duration asζ= 1.1sat
τ = 0.125, D: Velocity Magnitude Contour and Vectors through the Mid-Span at τ = 0.219. Pressure Units: Pa, Velocity Units: m/s . . . 344 5.28 Aerodynamic Power Comparison; A: Rotation Position D, B: Rotation Position D (average),
C: Rotation Position C, D: Rotation Position C (average), E: Rotation Position B, F: Rotation position B (average) . . . 349 5.29 Aerodynamic Power Comparison; A: Rotation Position A, B: Rotation Position A (average),
C: Rotation Duration 3.3s, D: Rotation Duration 3.3s (average), E: Rotation Duration 2.2s, F: Rotation Duration 2.2s (average) . . . 350 5.30 Aerodynamic Power Comparison; A: Rotation Duration 1.1s, B: Rotation Duration 1.1s
(aver-age), C: Leading Edge Mid-Chord Positions, D: Leading Edge Mid-Chord Positions (aver(aver-age), E: Average Aerodynamic Power For All Cases (Legend Represents Aerodynamic Power) . . . 351 5.31 Rectangular Wing with Rotation About the Leading Edge Cases 1-3 atτ = 0.125; A:
Stream-lines & Pressure Contour on Wing Surface forζ= 3.3s, B: Streamlines & Pressure Contour on Wing Surface for ζ = 2.2s, C: Streamlines & Pressure Contour on Wing Surface for
5.32 Rectangular Wing with Rotation About the Leading Edge Cases 1-3 atτ = 0.125; A: Stream-lines with Velocity Magnitude for ζ= 3.3s, B: Flow Field Around the Wing forζ= 1.1s, C: Streamlines with Velocity Magnitude forζ= 2.2s, D: Streamlines with Velocity Magnitude for
ζ= 1.1s. Velocity Units: m/s . . . 353 5.33 Fx Vs Lift Limit Cycle Comparison; A: Rotation Position D, B: Rotation Position C, C:
Rotation Position B, D: Rotation Position A . . . 354 5.34 Fx Vs Lift Limit Cycle Comparison; A: Rotation Duration 3.3s, B: Rotation Duration 2.2s,
C: Rotation Duration 1.1s . . . 355 5.35 Contour Plot for Average Aerodynamic Power / Average Lift Force For All Cases (Legend
Represents Average Power, W / Average Lift, N) . . . 356 5.36 Rectangular Wing with Rotation About the Leading Edge Cases 1-3 atτ = 0.125; A:
Stream-lines with Velocity Magnitude at Wing Tip for ζ = 3.3s, B: Streamlines with Velocity Mag-nitude at Wing Tip for ζ = 2.2s, C: Streamlines with Velocity Magnitude at Wing Tip for
ζ= 1.1s. Velocity Units: m/s . . . 358 5.37 Rectangular Wing with Rotation About the Leading Edge Cases 1-3 atτ = 0.125; A: Frontal
View of Streamlines with Velocity Magnitude at Wing Tip for ζ = 3.3s, B: Frontal View of Streamlines with Velocity Magnitude at Wing Tip forζ= 2.2s, C: Frontal View of Streamlines with Velocity Magnitude at Wing Tip forζ= 1.1s. Velocity Units: m/s . . . 359 5.38 Computational Domain with The Experimental Wing . . . 360 5.39 Experimental Wing in The Computational Domain with Dimensions . . . 361 5.40 60 mm Wing (WT4) Data with Motion and Pressure Visualisation; A: Grid Sensitivity
Com-parison for Lift Force Data, B: Experimental and CFD Lift Force ComCom-parison, C: Flapping Wing Motion of Downstroke, D: Flapping Wing Motion of Downstroke with Pressure Contours on Wing Surfaces. Pressure Units: Pa . . . 362 5.41 60 mm Experimental Wing (WT4) with Pressure Distribution; A: Coarse Mesh, B: Medium
5.42 60 mm Experimental Wing (WT4) with Streamlines and Mesh; A: Flow Characteristics During Downstroke atτ = 0.25, B: Flow Field Around Wing at τ= 0.25, C: Mesh on Wing Surface, Velocity Units: m/s . . . 365
6.1 Flapping Wing Measurements for 47 mm Wings (WT3); A: 3 Hz Spectrogram, B: 3 Hz Force & Power Data, C: 4 Hz Spectrogram, D: 4 Hz Force & Power Data E: 5 Hz Spectrogram, F: 5 Hz Force & Power Data. Colour Bar Represents Size of Amplitude. UI: M1-F-WT3-S-V . 372 6.2 Flapping Wing Measurements for 47 mm Wings (WT3); A: 6 Hz Spectrogram, B: 6 Hz Force
& Power Data, C: 7 Hz Spectrogram, D: 7 Hz Force & Power Data E: 8 Hz Spectrogram, F: 8 Hz Force & Power Data. Colour Bar Represents Size of Amplitude. UI: M1-F-WT3-S-V . 373 6.3 Flapping Wing Measurements for 47 mm Wings (WT3); A: 9 Hz Spectrogram, B: 9 Hz Force
& Power Data, C: 10 Hz Spectrogram, D: 10 Hz Force & Power Data. Colour Bar Represents Size of Amplitude. UI: M1-F-WT3-S-V . . . 374 6.4 Flapping Wing Measurements for 47 mm Wings (WT3); A: Aerodynamic Force Comparison,
B: Power Data for Inertia and Aerodynamic Forces, C: Aerodynamic Power & Force Relation. UI: M1-F-WT3-S-V . . . 375 6.5 Wing Position for Flapping Motion Sequence with Non-Dimensional Time. UI: M1-F-WT4-S-V378 6.6 Wing Position for FR Motion Sequence with Non-Dimensional Time. UI: M1-FR-WT4-S-V 379 6.7 Wing Position for FR with AP Motion Sequence with Non-Dimensional Time. UI:
M1-FRAP-WT4-S-V . . . 380 6.8 Wing Position for FR Motion in Hovering Mode Sequence with Non-Dimensional Time. UI:
M1-FR-WT4-S-H . . . 381 6.9 Wing Position from Ground Effect Base for FR Motion in Hovering Mode, 1-8 Downstroke,
9-15 Upstroke. UI: M1-FRwB-WT4-S-H . . . 382 6.10 Wing Position from Ground Effect Base for FR with AP Motion, 1-8 Downstroke, 9-15
6.11 Wing Kinematics for a Compilation of Arrangements Tested with Model 1; A: Flapping, B: FR with 0 Degree Inclination, C: FRAP with 0 Degree Inclination, D: FR with 90 Degree Inclination, E: AOA Comparison for FR and FRAP Configurations . . . 384 6.12 Various Experimental Layouts; A: Cases F1, FR1 & FRAP1, B: Cases F5 & FRAP2, C:
Case FR3, D: Model at 90degrees, E: Model at 90 degrees w/GE . . . 390 6.13 Various Experimental Layouts; A: Case F2, B: Cases F3, FR2 & FRAP4, C: Cases F4, FR4
& FRAP3, D: Case FR5 . . . 391 6.14 Flapping Wing Measurements for 60 mm Wings (WT4); A: Flapping Only Aero and Inertial
Forces with Stroke Angle, B: Comparison of Flapping Aero Forces, C: Aerodynamic Power & Force Relation, D: Spectrogram for Vertical Axis in Air. Colour Bar Represents Size of Amplitude. UI: M1-F-WT4-S-V & M1-FwB-WT4-S-V . . . 392 6.15 Flapping and Rotation Measurements with Uncertainity Applied . . . 394 6.16 Flapping & Rotation Wing Measurements for 60 mm Wings (WT4); A: Case FR1, B:
Spec-trogram for Vertical Axis in Air, C: Case FR2, D: Case FR3, E: Case FR4, F: Case FR5. Colour Bar Represents Size of Amplitude. UI: M1-FR-WT4-S-V & M1-FRwB-WT4-S-V . . 401 6.17 Flapping & Rotation Wing Measurements for 60 mm Wings (WT4); A: Comparison of Lift
Force, B: Comparison of Thrust Force, C: Comparison of Pitching Moment. UI: M1-FR-WT4-S-V & M1-FRwB-M1-FR-WT4-S-V . . . 402 6.18 Flapping & Rotation Wing Measurements for 60 mm Wings (WT4); A: FR Only Data with
Wing Displacement Kinematics, B: Average Thrust Force for All Cases, C: Average Pitching Moment for All Cases, D: Average Aerodynamic Power & Force Relation. UI:M1-FR-WT4-S-V & M1-FRwB-WT4-UI:M1-FR-WT4-S-V . . . 403 6.19 Flapping & Rotation Wing Measurements for 60 mm Wings (WT4) with Model in Hovering
6.20 Flapping & Rotation Wing Measurements for 60 mm Wings (WT4); A: FR Only (90 Deg) with Wing Displacement Kinematics, B: Average Pitching Moment, Average Lift & Average Power (90 Deg Data), C: Comparison of Vertical & Horizontal Forces at Different Inclinations, D: Comparison of Horizontal & Vertical Forces at Different Inclinations. UI: M1-FR-WT4-S-V, M1-FR-WT4-S-H & M1-FRwB-WT4-S-H . . . 409 6.21 Flapping with Restricted Wing Pitching; A: Schematic of Wing Pitching Motion, B: Wing
Kinematic Motion for Complete Cycle; Circle Represents Leading Edge . . . 410 6.22 Flapping and Rotation with Asymmetric Pitching Measurements for 60 mm Wings (WT4);
A: Case FRAP1, B: Case FRAP2, C: Case FRAP3, D: Case FRAP4, E: Spectrogram for Vertical Axis in Air. Colour Bar Represents Size of Amplitude. UI: M1-FRAP-WT4-S-V & M1-FRAPwB-WT4-S-V . . . 417 6.23 Flapping and Rotation with Asymmetric Pitching Measurements for 60 mm Wings (WT4); A:
FRAP Only with Wing Displacement Kinematics, B: Spectrogram for Vertical Axis in Vacuum Chamber, C: Average Lift Force, D: Average Thrust Force, E: Average Pitching Force, F: Average Thrust Force Based Upon AOA Duration. Colour Bar Represents Size of Amplitude. UI: M1-FRAP-WT4-S-V & M1-FRAPwB-WT4-S-V . . . 418 6.24 Flapping and Rotation with Asymmetric Pitching Measurements for 60 mm Wings (WT4);
A: Comparison of Lift Force, B: Comparison of Thrust Force, C: Comparison of Pitching Moment, D: Aero Power & Thrust Force Relation. UI: M1-FRAP-WT4-S-V & M1-FRAPwB-WT4-S-V . . . 419 6.25 Power Input for Various Wing Motions with Model 1 Inclined at 0 Degrees . . . 420 6.26 Wing Position for Model 2 in Sym Configuration Undergoing Flapping Motion Sequence with
Non-Dimensional Time. UI: M2-F-WT4-S-V . . . 422 6.27 Wing Position for Model 2 in Asym Configuration Undergoing Flapping Motion Sequence with
Non-Dimensional Time. UI: M2-F-WT4-A-V . . . 423 6.28 Wing Position for Model 2 in Asym Configuration Undergoing FR Motion Sequence with
6.29 Wing Kinematics for a Compilation of Arrangements Tested with Model 2; A: Sym Configu-ration with FR Motion, B: Asym ConfiguConfigu-ration with FR Motion, C: Asym ConfiguConfigu-ration with FR Motion with 90 Degree Inclination, D: AOA Comparison for Sym & Asym Configurations, E: AOA Comparison for Asym Configuration in 0 Degree & 90 Degree Inclinations . . . 427 6.30 Flapping Wing Measurements of 60 mm Wings (WT4) for Model 2; A: Symmetric
Configu-ration, B: Asymmetric ConfiguConfigu-ration, C: Comparison of Lift Force and Peak Data, D: Aero Power & Lift Force Relation, E: Spectrogram for Vertical Axis in Air for Asymmetric Config-uration, F: Spectrogram for Vertical Axis in Vacuum Chamber for Asymmetric Configuration. Colour Bar Represents Size of Amplitude. UI: M2-F-WT4-S-V & M2-F-WT4-A-V . . . 430 6.31 Flapping & Rotating Wing Measurements of 60 mm Wings (WT4) for Model 2; A: Symmetric
Configuration Force & Power Data, B: Symmetric Configuration Moment Data, C: Spectro-gram for Vertical Axis in Air for Asymmetric Configuration. Colour Bar Represents Size of Amplitude. UI: M2-FR-WT4-S-V & M2-FR-WT4-A-V . . . 436 6.32 Flapping & Rotating Wing Measurements of 60 mm Wings (WT4) for Model 2; A:
Asym-metric Configuration Force & Power Data, B: AsymAsym-metric Configuration Moment Data, C: Comparison of Lift & Thrust, D: Aero Power & Thrust Force Relation, E: Comparison of Moments. UI: M2-FR-WT4-S-V & M2-FR-WT4-A-V . . . 437 6.33 Flapping & Rotating Wing Measurements of 60 mm Wings (WT4) for Model 2 in Hovering
Position; A: Asymmetric Configuration Force & Power Data, B: Asymmetric Configuration Moment Data. UI: M2-FR-WT4-A-H . . . 439
B.1 Spectrogram Plots for 60 mm Wings (WT4) in FR & FRAP Configurations; A: FR for Fx Axis, B: FR for Ty Axis, C: FRAP for Fx Axis, D: FRAP for Ty Axis, E: FR in Hovering Mode for Fx Axis, F: FR in Hovering Mode for Ty Axis. Colour Bar Represents Size of Amplitude. UI: M1-FR-WT4-S-V, M1-FR-WT4-S-H & M1-FRAP-WT4-S-V . . . 466 B.2 Spectrogram Plots for 60 mm Wings (WT4) in FR & FRAP Configurations During Vacuum
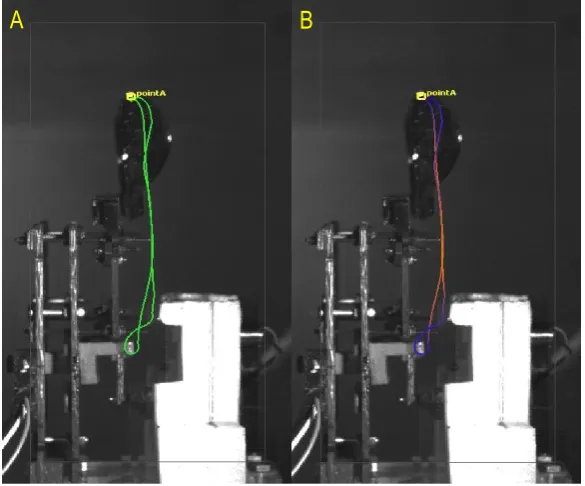
Chamber Tests; A: FR for Fx Axis, B: FR for Ty Axis, C: FRAP for Fx Axis, D: FRAP for Ty Axis, E: FR in Hovering Mode for Fx Axis, F: FR in Hovering Mode for Ty Axis. Colour Bar Represents Size of Amplitude. UI: M1-FR-WT4-S-V, M1-FR-WT4-S-H & M1-FRAP-WT4-S-V . . . 467 B.3 Example of Experimental Images to Capture Wing Motion with Various Arrangements; A:
Flapping Only, B: Flapping with TEwall and GE Boundaries, C: FR Only, D: FR with TEwall and GE Boundaries, E: FR Only in Hovering Mode, F: FR in Hovering Mode with GE Bound-ary, G: Flapping Only in Vacuum Chamber, H: FR Only in Vacuum Chamber . . . 468 B.4 Point Tracking for Flapping Wing and Location Data Output . . . 468
C.1 Fx Vs Lift Limit Cycles; A: Rotation Position D, B: Rotation Position D, C: Rotation Position D, D: Rotation Position C, E: Rotation Position C, F: Rotation Position C . . . 471 C.2 Fx Vs Lift Limit Cycles; A: Rotation Position B, B: Rotation Position B, C: Rotation Position
B, D: Rotation Position A, E: Rotation Position A, F: Rotation Position A . . . 472 C.3 Moments for Rotation Position D and Rotation Position C ; A: Rotation Position D and
Du-ration 3.3s, B: Rotation Position D and DuDu-ration 2.2s, C: Rotation Position D and DuDu-ration 1.1s, D: Rotation Position C and Duration 3.3s, E: Rotation Position C and Duration 2.2s, F: Rotation Position C and Duration 1.1s . . . 473 C.4 Moments for Rotation Position B and Rotation Position A ; A: Rotation Position B and
C.5 Aerodynamic Power for Rotation Position D and Rotation Position C ; A: Rotation Position D and Duration 3.3s, B: Rotation Position D and Duration 2.2s, C: Rotation Position D and Duration 1.1s, D: Rotation Position C and Duration 3.3s, E: Rotation Position C and Duration 2.2s, F: Rotation Position C and Duration 1.1s . . . 475 C.6 Aerodynamic Power for Rotation Position B and Rotation Position A ; A: Rotation Position
B and Duration 3.3s, B: Rotation Position B and Duration 2.2s, C: Rotation Position B and Duration 1.1s, D: Rotation Position A and Duration 3.3s, E: Rotation Position A and Duration 2.2s, F: Rotation Position A and Duration 1.1s . . . 476 C.7 Mesh Around Drosophila Wing for Grid Independence Study; A: Coarse Mesh, B: Medium
Mesh, C: Dense Mesh, D: Hyper Dense Mesh, E: Dense Mesh with Stationary Inner Domain 477 C.8 Mesh on Drosophila Wing for Grid Independence Study; A: Coarse Mesh, B: Medium Mesh,
C: Dense Mesh, D: Dense Mesh with Stationary Inner Domain, E: Hyper Dense Mesh, F: Wing Rotation Location . . . 478 C.9 Two Dimensional Slices of the Grid and Drosophila Wing at the Leading Edge; A: Coarse
Mesh, B: Medium Mesh, C: Dense Mesh, D: Dense Mesh with Stationary Inner Domain, E: Hyper Dense Mesh . . . 479
D.1 Model 1 with Body and 60 mm Wings (WT4) in Flapping Arrangement; A: Front View, B: Side View (Opaque and Transparent), C: Top View, D: Front Isometric View (Opaque and Transparent), E: Back Isometric View (Opaque and Transparent) . . . 482 D.2 Model 1 Support Board and Linkage Mechanism with Connection Lines; A: Top View, B:
Front Isometric View, C: Back Isometric View, D: Side View . . . 483 D.3 Model 1 Complete Linkage Mechanism with Connection Lines; A: Top View, B: Back
Isomet-ric View, C: Side View, D: Front IsometIsomet-ric View . . . 484 D.4 Model 1 Base and Gearbox with Connection Lines; A: Back View, B: Back Isometric View,
City, University of London Northampton Square London EC1V 0HB United Kingdom
T +44 (0)20 7040 5060
THE FOLLOWING PARTS OF THIS THESIS HAVE BEEN REDACTED
FOR COPYRIGHT REASONS:
p. 58, Figure 1.4
p. 59, Figure 1.5 and 1.6
p. 60, Figure 1.7
p. 61-2, Figure 1.9 and 1.10
p. 63, Figure 1.11
p. 64, Figure 1.12 and 1.13
p. 65-7, Figure 1.14-6
p. 70, Figure 1.19
p. 74, Figure 1.23
Dedicated to my Parents,
For their patience, sympathy and continual support in all aspects of my life
&
Dedicated to my Daughter,
Acknowledgements
Firstly, I would like to thank my supervisor, Prof. M. Gavaises for his professional and human support during
the duration of this research project. I am grateful for the opportunity, funding and freedom provided to
pursue my research work and grow as an engineer. It has been an invaluable experience, which has helped
me develop so many skills and formed the foundation for my professional career.
I would also like to thank my second supervisor, Dr. C. Cheung for his support, advice and knowledge in
this field of science. I hope you enjoyed our extensive research conversations as much as I did. Lastly, I am
grateful for the continuous motivation and courage you have given me during these past years.
In addition, I would like to thank Mr. M. Smith for his valuable advice and skills to manufacture the
components required for the experimental work of this project. Furthermore, I would like to thank Mr. R.
Leach and the technical staff for their support. Moreover, I would like to thank Mr. J. Hooker and Mr. T.
Barnes for giving me access to all your tools and workshop to manufacture components for the experiments.
A big thank you to my friends and colleagues in City University research group, for all of the insightful
conversations and support in one way or another.
Last, but not least, I would like to thank my family and friends for their guidance and support in my
personal life. A very warm thank you to my parents, sister, wife and daughter for their patience, loving
Declaration
I hereby declare that the work presented in this thesis is my own unless stated and referenced in the text
accordingly.
City University London
Abstract
Many creatures in nature have evolved the ability to fly and some seem to do so effortlessly with captivating
movement. The flight characteristics of these natural fliers have greatly fascinated biologists and engineers
for a long time that to this day researchers continue to actively work in this field of science with the aim of
one day developing a Flapping Wing Micro Aerial Vehicle (FWMAV) which can replicate the flight of natures
creatures. These types of autonomous robotic vehicles can fulfil tasks which are not suitable for manned
vehicles especially when risks to human safety are present. Flight techniques such as control, stability
and manoeuvrability are flight characteristics which an FWMAV must possess if such a device is employed
for various rescue missions. With this in mind symmetrical and asymmetrical wing motions are studied
experimentally in the current research programme in such a way that the methodology employed for this
type of flight can be implemented into future FWMAVs.
This research study is composed of investigations carried out in various fashions such as design &
develop-ment, experimentally testing and computational evaluations of hovering aerodynamics of an FWMAV with
variable parameters. The design of the first FWMAV, led to the creation of the second model which has
the ability to perform symmetric and asymmetric flapping motions. Both models were tested thoroughly
with various wing motion arrangements to assess the forces and moments generated along with the power
required to actively move the wings through the air. A range of Reynolds numbers were studied within
the experiments, the 47 mm wing (WT3) was flapped from 3 Hz to 10 Hz which meant that the Reynolds
number ranged from 749 to 2498. The 60 mm wing (WT4) was flapping at a freqency of 5 Hz with a range
of different flapping motions, the Reynolds number for this was in the region of 2716. The experiments were
performed on the experimental rig which incorporated a six component force transducer whilst images were
motion tested, stationary rigid boundaries were also positioned in the near vicinity of the wings to study the
effect this has on flight forces and moments, in addition to the power drawn in such scenarios.
Aside from the design and experimental investigations, computational studies were conducted involving a
rectangular wing in hovering mode where the rotational duration and location are varied to determine key
aerodynamic measurements and flow phenomena. The Reynolds number for this analysis was 155 and the
flapping stroke frequency was 0.145 Hz. This extended study was composed of twelve cases to thoroughly
investigate three rotational durations and four locations of wing rotation along the chord. In general,
maximum lift force was achieved when the wing pitched about the spanwise axis at the leading edge whilst
rapidly rotating at its smallest rotational duration. As a result, the maximum aerodynamic power was also
required in this situation. Furthermore, grid quality assessments were carried out to determine the accuracy
of the solution against the type of grid methodology adopted as mesh deformations are experienced in a time
dependent manner. Prior to expanding the CFD study, a drosophila insect wing was simulated in a hovering
mode analysis to evaluate the computational methodology adopted. It was found that the computational data
produced in this thesis had good agreement with experimental and computational results from literature.
Further to this, the 60 mm wing (WT4) was modelled in a flapping only simulation for which the trend of
the curves agreed well between the experimental and computational data.
In general, for the tests where the wings on both sides produce a single motion in the form of flapping only,
the force measurement data followed in a consecutive fashion as the frequency was increased. Likewise, in
relation to the augmenting frequency and force output, the aerodynamic power increased as the flapping
frequency grew. Following this the experimental tests became more complex with the introduction of a
rigid stationary boundary in the proximity of the wings. In this flapping only motion, the boundaries
seemed to augment the aerodynamic forces generated by a maximum of approximately 10 mN (peak-peak)
on average when compared to the base case of flapping only with no boundary present, particularly the TE
wall boundary case which seemed to generate the greatest aerodynamic force of approximately +/-25 mN.
With the addition of passive wing rotation the model could now perform a coupled flapping with rotating
wing motion whilst a single actuator is utilised to drive the mechanical system. Building from the previous
work, stationary boundaries were also exploited for these experiments, where it was found that the peaks
of the lift force measured for both strokes were greater when stationary boundaries were present near the
compared to the base case. As a direct relation to the thrust force data, the same result as aforementioned
was found for pitching moment. However, a consequence for the greater force generation in the presence of
boundaries, is that greater aerodynamic power was required by the mechanical device for the boundary tests
with this coupled wing motion when compared to the base case. The passive wing pitching motion is unique
as it is created via elastic elements attached to the root section of each wing. The flapping stroke produces a
sinusoidal motion through its controlled actuation, whereas the wing pitching motion is dependent on many
factors that determine its motion during a cycle. The Flapping and Rotation with Asymmetric Pitching
(FRAP) experiments seemed to generate more lift force in the downstroke phase with a thrust generation in
the upstroke phase, such a result was found as the wing created a large AOA during the upstroke promoting
thrust generation whilst reducing the vertical force generation in the downwards direction. Similar to previous
tests, when the wings were performing this FRAP motion, the greatest lift force was produced when a wall
was located in the near vicinity of the trailing edge of both wings. For the second model, it was found that
greater thrust was generated in the asymmetrical configuration as opposed to its symmetrical counterpart,
and overall yawing moments were generated during asymmetric wing motions which are essential for lateral
control and manoeuvrability. This result was consistent when the model was positioned to have its stroke
plane in the vertical axis as well as the horizontal axis.
In summary, the research performed during the course of this project produced innovative results in the
form of the creation of two micro air vehicles with a thorough explanation of the development process and
examination under experimental tests. Various parameters were analysed during the experimental tests such
as force, moment, power and wing position measurements. The tests were performed on both models, one of
which has the functionality to perform asymmetrical flapping and successfully generate moments about two
different axes. A unique wing motion which favoured the upward vertical force production was investigated
under various scenarios. The wings keep a fixed angle of attack during the downwards flapping motion and
are allowed to passively rotate during the upstroke motion. Computational simulations were performed to
investigate the hovering fluid dynamics, forces, moments and power required for various chordwise rotational
positions and durations of wing rotation. This investigation aided in understanding the full effects of altering
these parameters under hovering conditions for a rectangular wing. The valuable results found from this
research program provide a better insight into various topics involving micro air vehicles in addition to
Nomenclature
K - Kelvin
Hz - Hertz
N - Newtons
Fx - Force in X direction
Fy - Force in Y direction
Fz - Force in Z direction
Mx - Moment about X axis
My - Moment about Y axis
Mz - Moment about Z axis
ωm - Motor Speed
V - Voltage
W - Watts
DG - Distance Between the Central Gear Locations
TN- Number of Teeth in a Gear
PitchD- Pitch Diameter
Grr - Gear Reduction Ratio
TNL - Number of Teeth in Larger Gear
TNS - Number of Teeth in Smaller Gear
ζ - Wing Rotation Duration
τ - Non-Dimensional Time (based on instantaneous time and time required for a complete period)
χ- Wing Rotation Position Along Chord
ˆ
r- Non-Dimensional Radial Distance (based on position from wing root and wing span)
ˆ
c- Non-Dimensional Chord (based on length of chordwise strip and mean chord)
c - Chord
¯
c- Mean Chord
R - Single Wing Span
r’ - Radial Distance from Wing Root
YLE - Leading Edge Profile
ˆ
YLE - Non-Dimensional Leading Edge Profile (based on distance from mid-axis to LE and mean chord)
f - frequency
q - Dynamic Pressure
Φ - Stroke Amplitude
Ψ - Angle of Attack Amplitude
Θ - Deviation Amplitude
ST - Total Wing Area
AR - Aspect Ratio
VAR - Variance
σSD- Standard Deviation
Rg - Radius of Gyration
Rr- Distance from Rotation Axis to Wing Root
Rt- Distance from Rotation Axis to Wing Tip
αLM- Angle Between Lengths in Linkage Mechanism
βLM - Angle created from Linkage Movement
θLM - Angle Alters with Link Movement
LM - Outer Angle in Neutral Position
Ln - Length
L - Link
FL - Lift Force
FI - Inertial Force
FD- Drag Force
CFL - Lift Coefficient
m - Mass
a - Acceleration
φ(t) - Stroke Angle as a Function of Time
Uref - Velocity
Lref - Length
ν - Kinematic Viscosity
µ- Dynamic Viscosity
ρ- Density
ω - Angular Velocity
v - Velocity
Re - Reynolds Number
Rehover - Reynolds Number for a Hovering Condition
St - Strouhal Number
SBF - Frontal Body Area
LB - Length of Body
¯
τ - Stress Tensor
ha - Linear Stroke amplitude
k - Reduced Frequency
p - Pressure
J - Advanced Ratio
La - Arc Length
LΦ- Length with Reference to Stroke Amplitude
T - Time Taken for a Complete Cycle
ϑ(t) - Deviation Angle as a Function of Time
V - Maximum Translational Velocity
υ(τ) - Translational Velocity as a Function of Non-Dimensional Time
τ acc - Non-Dimensional Time At Onset of Translational Acceleration
∆τ acc- Non-Dimensional Duration of Translational Acceleration
τ dec - Non-Dimensional Time At Onset of Translational Deceleration
∆τ dec - Non-Dimensional Duration of Translational Deceleration
ω rot - Angular Velocity Constant
ω(τ) - Angular Velocity as a Function of Non-Dimensional Time
τ turn- Non-Dimensional Time at Onset of Wing Rotation
τ rot - Non-Dimensional Duration of The Rotational Phase
∆θ - Total Angle of Wing Rotation
ω - Angular Velocity
M xwing - Moment about Wing Base Fixed X Axis
M ywing - Moment about Wing Base Fixed Y Axis
M zwing - Moment about Wing Base Fixed Z Axis
Preq - Power Required
ξ- Measure of Stroke Reversal Duration
γ - Measure of Angle of Attack Reversal Duration
ϕ- Body Rotation about X Axis
Abbreviations
Aero - Aerodynamic
AOA - Angle of Attack
Asym - Asymmetrical
AV - AeroVironment
CAD - Computer Aided Design
CCD - Charge-Coupled Device
CFD - Computational Fluid Dynamics
CG - Centre of Gravity
Ch. - Channel
DARPA - Defence Advanced Research Projects Agency
DC - Direct Current
DOF - Degree of Freedom
DVID - Dynamic Virtual Inner Domain
ESC - Electronic Speed Controller
fps - Frames Per Second
FR - Flapping and Rotation
FRAP - Flapping and Rotation with Asymmetric Pitching
FSI - Fluid Structure Interaction
F/T - Force/Torque
FW - Flapping Wing
FWMAV - Flapping Wing Micro Aerial Vehicle
FWNAV - Flapping Wing Nano Aerial Vehicle
GE - Ground Effect
GUI - Graphical User Interface
HS - High Speed
IFPS - Interface and Power Supply
iso - Isometric
LD - Larger Distance
AP - Asymmetric Pitching
LE - Leading Edge
LEV - Leading Edge Vortex
Li-Po - Lithium Polymer
LW - Light Weight
MAV - Micro Aerial Vehicle
MFI - Micromechanical Flying Insect
NAV - Nano Aerial Vehicle
NI - National Instruments
PIV - Particle Image Velocimetry
PSU - Power Supply Unit
R/C - Radio Control
RSV - Rotational Starting Vortex
SR - Semi-Rigid
SS - Combination of Starting and Stopping Vortex
SVID - Stationary Virtual Inner Domain
Sym - Symmetrical
TE - Trailing Edge
TEV - Trailing Edge Vortex
TTL - Transistor-Transistor Logic
TSV - Translation Starting Vortex
TV - Tip Vortex
RV - Root Vortex
UAV - Unmanned Aerial Vehicle
UDF - User Defined Function
USL - Under-wing Shear Layer
VID - Virtual Inner Domain
WE - Wall Effect
1S - One Side Only
WT - Wing Type
Chapter 1
Introduction
This first chapter presents a brief insight regarding the motivation to research flight mechanics, in-particular
insect flight and MAVs. Following this, a few biological aspects of an insect are described and the applications
of small flying objects. A brief review of various types of MAVs which have been developed by researchers,
engineers and even hobbyists will be presented.
1.1
Motivation
To date, a variety of aerial vehicles of many different sizes have been seen, which are built for specific purposes
and continually improved as researchers pursue their passion and interests to advance existing knowledge in
this field of science. In 1902, the Wright brothers completed the design of their new glider, which included
significant improvements compared to its predecessor. After years of experimental research carried out in
order to determine the flaws of their previous glider design, they designed and built a wind tunnel with a
two blade fan powered by a gasoline engine, where they tested hundreds of different models some of which
were aerofoils, flat-plates, curved plates, rounded leading edges and many others. The findings of their
experimental research were vital to their new design and led to their success. Following their successful
glider design, they commenced a new challenge to develop powered flight. The field of aeronautics has
constant improvements to flight vehicles. Various types of flying machines have been created some of which
are aeroplanes, helicopters, airships, space vehicles, rockets, missiles and so on. Flying vehicles within nature
have evolved over millions of years ago and have recently become a key topic for aerial defence machines as
technology continues to improve in various aspects of engineering. The maximum positive g-forces permitted
in most general aviation aircraft is 4-5 g and select military aircraft withstand 8-10 g. However, many birds
routinely experience positive g-forces in excess of 10 g and up to 14 g (Shyy et al. 2008). Early stages of
flight were inspired by natural flyers in the form of flapping wings from the sketches of Da Vinci, the designs
of flying vehicles were based on flapping wings, years later we witness the rebirth of these flying machines
attempting to mimic bird and insect like wing motion, in the hope to one day fly like these extraordinary
creatures.
For decades, researchers have been fascinated by natures flyers and wondered how these creatures can fly
so effortlessly, efficiently and with such remarkable control characteristics. Biological flyers have several
manoeuvring characteristics, flight control body motions which are difficult to implement in man-made
flyers. They adapt to wind gusts, deform their wings to control speed, change direction and even reduce
their lift. Further to this, birds have the ability to take-off and land from a solid foundation or water. They
are able to bend and spread their wings to position them at a high angle of attack producing a large drag
force (whilst also maintaining sufficient lift compared to its weight at low speed) in order to reduce their
approaching speed, before touching down on land or water. Larger birds such as American eagles with
their large wing area can afford to stop flapping whilst looking for prey and remain airborne for a long
duration simply by taking advantage of the thermal in the air, while smaller birds must flap their wings
continuously in order to fly. As the size of the animal decreases its wing flapping frequency increases where
the smallest insects seem to flap their wings violently at frequencies above 200 Hz, with swift directional
changes displaying manoeuvrability.
In order to progress in this multi-disciplinary field of UAVs and MAVs, technology advancement is a key
factor to succeeding in this area of science. Various fields of engineering are required to understand and
develop such vehicles including aeronautics, CFD, electronics, robotics among others. A highly developed
MAV with a set of stringent mission requirements requires a diverse range of parts which are continually being
developed to improve efficiency, size, weight, manufacturing time, structural strength which all in future will
parts and devices is very challenging but is imperative to the growth of MAVs. Mechanical parts, actuators,
sensors, gyroscopes, cameras, power sources, control circuitry along with other components are all critical
for the development of a complete autonomous MAV.
The need for such small scale aerial vehicles is invaluable, a core reason for the continual evolution is
rescue surveillance. A collapsed building will pose a threat to any human life entering this site, whereas it
would be an ideal environment in which an MAV can be used most effectively. They can also be used in
surveillance missions in hazardous and confined environments. Such devices can be sent in to explore the
area, determine the locations of human lives and even seek out the best route to follow. A MAV equipped
with manoeuvrability skills similar to that of insects and the information captured via its sensors and cameras
would be intricate to all search and rescue teams in all parts of the world. This is just one role a MAV device
can execute, there are many more which such devices are necessary for.
1.2
Nature and Insects
Nature has shown us various flying techniques from gliding to hovering where the latter can only be performed
by insects and smaller birds. Their take-off methods vary from using their legs as a spring mechanism and
leaping into the air to extended runs through water or land to gain enough speed and raise their entire
body above the surface. Hummingbirds are capable of hovering for prolonged periods whilst flapping its
wings in a similar fashion to insects along a horizontal stroke plane, bats are also known to hover but not
like Hummingbirds who share similar hovering characteristics to insects. “Most of the total energy required
for flight is dissipated as heat in the flight musculature. For hovering animals, the remaining mechanical
energy is divided into three components: induced power required to generate lift, profile power necessary to
overcome drag on the wings, and inertial power required to accelerate and decelerate the wings during stroke
reversal” (Dickinson et al. 1995). An animal’s ability to hover are based upon four parameters according to
(Shyy et al. 2008), which are the moment of inertia of its wings, overall size, wing shape and especially the
degree of freedom for wing movement. Hovering requires wing characteristics which exist primarily in small
biological flyers.
This project is based on insect flight due to their size, manoeuvrability, flight characteristics (such as control
features. A highly sought after feature is the insect’s capability to develop its own flow field and raise its
entire body without the need of any forward flow acting on its wings. These characteristics make an insect
an ideal flyer for all indoor and enclosed environment operations.
Insects have the ability to translate along three degrees of freedom and rotate about any of these axes. Its
ability to manoeuvre swiftly is available due to its rotational capabilities such as pitch, roll and yaw about
their respective translational axes. To undergo controlled take-off and landing the insect adopts a similar
method to hovering, where its stroke plane will be close to horizontal and thrust production is controlled,
especially during landing. The stroke plane on either side of the body can be varied, and if the stroke plane
is different on either side then a turning motion can be created (further discussed below). The insect would
be seen to turn away from the side which has the largest stroke plane angle, thus the largest stroke plane
angle will be on the outside of the turn. The lift force production is proportional to the angle of attack of
the wing, thus altering the pitch angle of the wing on one side will produce an unbalanced lift force on both
sides resulting in a rolling moment, insect manoeuvrability will be further elaborated upon below. Moving
the flapping motion position either forwards or backwards achieves a pitching moment as the CG point of
the insect is modified.
It is clear that insect muscles play a large part in the aerial ability of an insect via their controllability,
endurance, strength and co-ordination to perform in such a manner. The level of control and co-ordination
involves immense complexities and in mechanical terms somewhat impossible to create at the size of a fly or
wasp with the current technology available. Along with the wings, the insects body also holds a significant
role to aid insect aerodynamics. During forward flight the insect would attempt to almost streamline its
body via positioning it horizontally, when landing the abdomen section seems to be lowered to assist stability
and increase drag production in order to reduce its approaching speed. Thus, developing an MAV to imitate
an insect in flight and manipulate its fascinating flight characteristics is an incredibly complex task. In
addition, as the insect approaches to land it moves the legs outwards ready for touch down which can also
act to augment drag force and reduce the insect landing speed (an image of a bee alighting on a platform
is shown in Figure 1.1, in which the bee is also carrying pollen). An additional view of the bee alighting
on a platform is shown in Figure 1.2, where it is clearly seen that the wings are stretched out to augment
the production of drag force. “Tiny changes in the timing of separate elements and components of the
magnitude and direction of the resultant forces. It has been shown in hoverflies that a change of 8% in the
timing of the wing edge rotation, relative to the timing of the flap, increased the amount of lift generated
Figure 1.1: Bee Alighting Sequence Side View Whilst Carrying Pollen (Goodman 2003)
An insect needs to generate enough aerodynamic power to raise its entire body weight and remain aloft.
This aerodynamic power must be produced during its complete flapping wing motion of down and upstrokes.
However, the inertial power creation is quite contrasting to the preceding, as positive power would be needed
for the first half stroke as this phase involves accelerating the wing from rest. The second half stroke would
require decelerating the wing as it will come to rest at the end of the stroke. At the start of a flapping motion
inertia is of a maximum value, this decreases towards the midstroke where the acceleration has reached a
value of zero. Following on, the wing continues to move in its prescribed path whilst the acceleration is
now of opposite sign. “ The energy yielded by this deceleration could be used to minimise the cost of flight
in one of two ways. The flies could decelerate their wings by stretching elastic elements within the thorax.
This work could then be recovered during the next half stroke and provide energy to accelerate the wings.
Alternatively, the work of deceleration could be used directly as a source of aerodynamic power during the
second half of each stroke. Any inertial energy stored in elastic elements is unavailable as an immediate
source of aerodynamic power” (Dickinson et al. 1995).
The wings of any animal which has the ability to fly must withstand considerable aerodynamic forces and
moments which are produced by its wings during flight. Any reduction of these forces and moments due
to wing loading would affect its flight performance and efficiency. Insects wings are constructed of a thin
membrane reinforced with cuticular veins. These veins provide a structured surface with flexibility and the
capability to change the shape of the wing to adapt under various conditions of aerodynamic and inertial
loading. A birds wing is much larger made up of a skeletal structure, muscles and feathers. Due to this
it has a better resistance to damage compared to insects wings. The root section of the birds wing has
the highest thickness and camber where both reduce towards the tip of the wing. The birds wing can
be streamlined where the Re of the wing is approximately of the order of 105. The wing camber can be
transformed to develop favourable aerodynamics via the muscles or passively by aero-elastic motion of the
feathers, in addition camber can also be modified actively to some extent.
Among the animal flight group gliding and soaring can only be performed by birds, the larger the bird, the
better its ability to glide and soar. Animals usually flap their wings in order to produce thrust and lift.
Upon gliding the bird can produce lift only, no thrust is produced as there is no flapping motion. Thrust
can be generated by gliding through a slightly downward angle whilst moving forwards through the air,
the animal. “A wandering albatross, with a wing span of over 3 m, has a reported lift-to-drag ratio of 19
whereas the fruit fly, which has a span of 6 mm, has a ratio of 1.8” (Alexander 2002). Another option to
continue flying without excess wing motion would be to soar, where the bird would maintain its altitude or
even ascend by using rising air currents. “Biological flyers also tilt their flapping stroke plane: down and
forward on the downstroke and up and backward on the upstroke. To fly faster, biological flyers make the
stroke more vertical by increasing the up-and-down amplitude of the movements. When biological flyers
decrease their speed, they tend to flap their wings more horizontally, similar to the way helicopters change
their rotors” (Shyy et al. 2008). Relevant data of a variety of insect species is shown in Table 1.1, the data
is tabulated to provide an insight of the large range of masses, flapping frequencies and total wing areas