Single Trial Classification of EEG in Predicting Intention and Direction of Wrist
Movement: Translation Toward Development of Four-Class Brain Computer
Interface System Based on a Single Limb
Syahrull Hi Fi Syam, Heba Lakany, BA Conway
Department of Biomedical Engineering University of Strathclyde Glasgow, United Kingdom
email: {jamil.syahrull-fi-syam-bin-ahmad, heba.lakany, b.a.conway}@strath.ac.uk
Abstract— Brain-computer interfaces (BCI) are paradigms that offer an alternative communication channel between neural activity generated in the brain and the users’ external environment. The aim of this paper is to investigate the feasibility of designing and developing a multiclass BCI system based on a single limb movement due to the factor, high dimensional control channels would expand the capacity of BCI application (multidimensional control of neuroprosthesis). This paper also proposes a method to identify the optimal frequency band and recording channel to achieve the best
classification result. Twenty eight surface
electroencephalography (EEG) electrodes are used to record brain activity from eleven subjects whilst imagining and performing right wrist burst point-to-point movement towards multiple directions using a high density montage with 10-10 electrode placement locations focusing on motor cortex areas. Two types of spatial filters namely Common average reference (CAR) and Laplacian (LAP) filter have been implemented and results are compared to enhance the EEG signal. Features are extracted from the filtered signals using event related spectral perturbation (ERSP) and power spectrum. Feature vectors are
classified by k-nearest neighbour (k-NN) and quadratic
discriminant analysis (QDA) classifiers. The results indicate that the majority of the optimum classification results are obtained from features extracted from contralateral electrodes in the gamma band. Based on a single trial, the average of the classification accuracy using LAP filter and k-NN classifier across the subjects in predicting intention and direction of movement is 68% and 62% for motor imagery and motor performance respectively; which is significantly higher than chance. The classification result from the majority of subjects shows that, it is possible and achievable to develop multiclass BCI systems based on a single limb.
Keywords - Brain computer interface (BCI) ; wrist movement; motor imagery; Electroencephalography (EEG); intention of movement.
I. INTRODUCTION
A Brain Computer Interface (BCI) system applies and decodes the brain signature obtained from an electroencephalogram (EEG) signal and translates this
information into a usable signal such as command signals to control and/or communicate with augmentative and assistive devices [1]. Implementation of a BCI system in assisting neurally impaired patients in controlling an orthosis device [2], operating functional electrical stimulation (FES) [3] or operating spelling device [4] have evidently proven that a BCI system can potentially provide alternative communication methods for the neurally impaired community in particular locked in patients.
Despite of recent achievements, most existing BCI systems are still under development and constrained by limitations. For instance, the current BCI system faces a challenge when it comes to equip a system with multiple independent control channels [5] due to the low dimensional control. BCI systems with low dimensional control only manage to recognise a limited number of mental tasks as control command [6]. Most current BCI systems are based on two-class [27].
There a number of approaches to overcome the multi-dimensional control problem; one such approach is by using a combination of mental tasks that involve motor imagery of more than one limb, e.g., left hand, right hand, left foot and right foot [7]. Although this approach increases the control dimensionality, but it could be challenging to neurally impaired patients as they have limited access/control over their limbs and their brain signatures are affected by deafferentation and cortical reorganisation of brain regions which depend on the duration, level and type of disease [8].
The primary goal of this study is to explore the feasibility of designing and developing a four-class BCI system based on the movement of a single limb; namely the movement of the right wrist. The wrist movements are burst point-to-point centre-out movements comprising of extension (toward direction 3 o’clock), flexion (toward direction 9 o’clock), ulnar (toward direction 6 o’clock) and radial (toward direction 12 o’clock). This study also investigates the optimum frequency band and recording channels across the participating subjects that contribute to the highest
The rest of the paper is structured as follow: Section II describes the implemented experiment protocol and data analysis procedure. Sections III presents the results of the experiment and section IV elaborates the discussion on presented results. The paper end with a conclusion of the findings in section V.
II. METHODS
The set-up of the experiment, data acquisition and the data analysis will be explained in this session.
A. Experimental Setup
Surface EEG signals were recorded from 11 subjects (9 males). All subjects had no history of neurologic disease and with 20/20 vision or corrected vision. Subjects were postgraduate students of the University of Strathclyde with average age of 28.91 years. All subjects have given their informed consent.
The experimental procedure was approved by the Departmental Ethics Committee of the Biomedical Engineering Department of the University of Strathclyde.
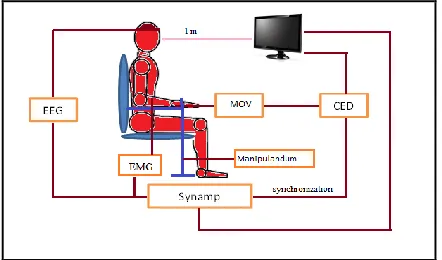
Each subject was comfortably seated on a wheelchair facing a LCD monitor at a distance of 1 meter from the screen. As it can be seen in Figure 1 that a manipulandum placed on the right side of the wheelchair, which allows the movement of the wrist in multi-direction. During the data recording process, subjects were required to hold the manipulandum and attempt, perform and imagine (kinesthetic imagery) performing right wrist burst, point to point center out movement towards four directions (3, 6 , 9 and 12 o'clock) triggered by a visual cue showing the target direction on the monitor. On reaching the target position, subjects had to hold the manipulandum for as long as the cue remained visible on the screen and later reposition the manipulandum to the neutral position (0) according to the cue. While in the neutral position, subjects were instructed to stay calm and relaxed.
[image:2.612.66.287.575.705.2]The participating subjects manage to complete all trials for motor imagery and motor performance. Each experiment comprised of trials of both motor imagery and motor performance towards four different directions, establishing 50 repetitions per direction.
Figure 1. Experimental Recording Set Up
Figure 1 shows the implemented set up during recording session. Subject is seated on the wheelchair and made to face a LCD monitor screen at distance of 1 m with a manipulandum attached to him on his right side. Neuroscan Synamp system was used for EEG and EMG signal recording. Movement signal was recorded from manipulandum using Cambridge Electronic Design 1401 (CED). All systems were synchronized during recording process.
B. Data Recording Set Up
EEG, surface electromyography (sEMG) and movement signals were recorded simultaneously during the trials. EEG signal was recorded using 28 electrodes (earlobe reference) placed in a high density montage on the scalp according to 10-10 system and the EMG signal was recorded from flexor carpi radialis, extensor carpi ulnaris, extensor carpi radialis brevis and extensor carpi radialis longus muscles. The sEMG signal was recorded in order to make sure that there is no movement during motor imagery experiments. Both EEG and sEMG were recorded using Curry Neuroimaging Suite 7.0.8 XSB software with NeuroScanTM Synamps2 at a sampling frequency of 2 KHz.
The movement signal was recorded using two precision servo potentiometers that are attached to the manipulandum in order to detect the onset and the direction of movement. It was recorded by Spike2 software through CED 1401 (Cambridge Electronic Design, United Kingdom) at a sampling frequency of 100Hz.
C. Data Preprocessing
The recorded data from motor imagery and motor performance experiments were processed offline using MATLAB. EEG was epoched using EEGLAB toolbox version 12 [9] based on type of experiments (motor imagery and motor performance) and categorised according to the direction toward 3, 6, 9 and 12 o’clock. For instance, in the motor performance data, the EEG signal was epoched 3 seconds before and 3 seconds after the onset of movement whereas, for the motor imagery, the EEG signal was epoched 3 seconds before and 3 seconds after the visual cue presentation.
The epoched EEG was filtered by a notch filter to remove any 50 Hz power line interference [10] and a high pass filter with cutoff 0.5 Hz in order to extract EEG component signal such as delta/δ (1-4 Hz), theta/θ (5-7 Hz), alpha/α (8-12 Hz), beta/β (13-30 Hz) and gamma/γ (31+ Hz) [11]. Common average reference (CAR) [12] and Laplacian (LAP) [13] spatial filtering methods to improve localisation were applied before any further processing of the data.
D. Features Extraction and Classification
Event Related Desynchronisation (ERD)/Event Related Synchronization (ERS) which visualizes the entire spectrum in the form of baseline-normalised spectrogram. ERD refer to the decrease in synchronisation of firing neuron that cause a decrease of power in specific frequency band and can be identified by a decrease in signal amplitude. On the other hand, ERS is characterised by an increase of power in specific frequency band due to the increased in synchronisation of firing neuron and can be identified by increase in signal amplitude. ERSP is computed where each epoch was divided into a number of overlapping windows and spectral power is calculated for each window. The calculated spectral power was then normalized (divided with the baseline spectra calculated from the EEG immediately before each event) and averaged over all the trials. This whole process was done using EEGLAB software version 12 [14] [15]. Power Spectrum indicates the distribution level of the signal power for each of the frequency and latency. The Power Spectrum in the δ-, θ-, α-, β- and γ- bands from the ERSP was computed using code adapted from the EEGLAB version 12.
Features were extracted based on the type of response, either predicting the intention of movement or the direction of movement. For the former response, we identify the subject’s intention to move by distinguishing whether the subject is static or moving his/her right wrist. For the latter response, we try to predict the direction of the movement in addition to the intention of movement.
Predicting the intention of movement required identifying features extracted during both motor imagery and the motor performance for all four directions. Features were extracted from a 500ms window before onset of wrist movement (t=0). On the other hand, for motor imagery, features were extracted from a 500ms window after cue presentation (t=0) [16].
Conversely predicting intention and direction of movement required further analysis which involved statistical testing. In order to determine whether a statistically significant difference exists in the extracted features between the four directions, analysis of variance (ANOVA) has been implemented [17]. Repeated measure of ANOVA was applied across the four directions through ERSP at each time and frequency point with p value was set at 0.05. The Power Spectrum from the ERSP with p-value <0.05 was concatenated to form the feature vectors.
To reduce the dimensionality of the feature vectors, Principal component analysis (PCA) has been used [18]. The principal components that represent 90% (PCA is set to 90% in order to get a balance between features dimension, computational time, complexity of classification process and computation demands) variance of the original data formed the new reduced dimension feature vector for the classification. The new features vectors were randomly split into training and testing data sets [19]. The training and testing datasets were randomly selected using the MATLAB function k fold cross validation (where k=10 was chosen) [20] and fed to the classifier as input. We used two different classifiers for comparison and verification: k-Nearest
Neighbours (k-NN) (where k=7) [21] and quadratic discriminant analysis (QDA) classifiers [22].
III. RESULTS
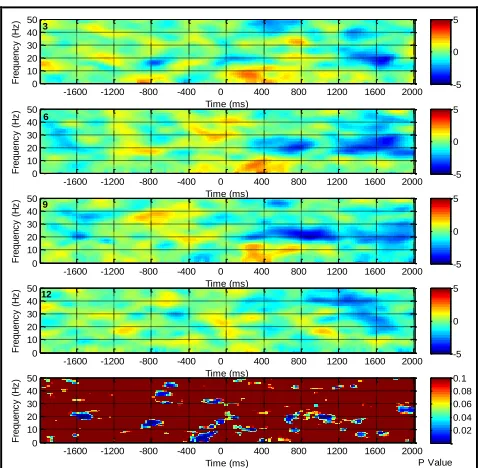
A. Results of Event Related Spectral Perturbation (ERSP) Figures 2 and 3 show a typical ERSP results of subject S1 for both motor imagery and motor performance respectively. The top four panels represent the average ERSP maps for all four directions and the ANOVA result for the electrode C3 using CAR. Although both of the figures using CAR, still they demonstrated different mapping results.
For instance, in Figure 2, ERD was detected approximately 300ms post visual cue presentation (t=0) and this is illustrated by the presence of a blue region in all four directions. ERD is evidently detected in the β- (in all four directions 3, 6, 9 and 12 o'clock) and the γ- (in all four directions 3, 6, 9 and 12 o'clock) band.
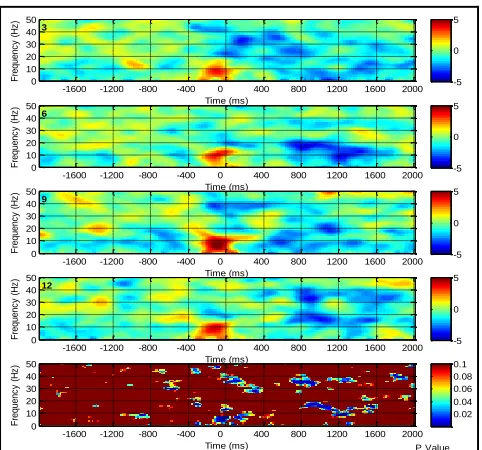
On the other hand, in Figure 3, the appearance of ERD is detected approximately 400ms preceding onset of movement (t=0) in the β- (in directions 3, 6, 9 and 12 o'clock) and in the γ- (directions 3 and 9 o'clock) band. In this study, the detection of the ERD prior to onset of movement indicates the intention of movement (planning phase).
3 Time (ms) F re q u e n c y ( H z )
-1600 -1200 -800 -400 0 400 800 1200 1600 2000 0 10 20 30 40 50 -5 0 5 6 Time (ms) F re q u e n c y ( H z )
-1600 -1200 -800 -400 0 400 800 1200 1600 2000 0 10 20 30 40 50 -5 0 5 9 Time (ms) F re q u e n c y ( H z )
-1600 -1200 -800 -400 0 400 800 1200 1600 2000 0 10 20 30 40 50 -5 0 5 12 Time (ms) F re q u e n c y ( H z )
-1600 -1200 -800 -400 0 400 800 1200 1600 2000 0 10 20 30 40 50 -5 0 5 P Value Time (ms) F re q u e n c y ( H z )
-1600 -1200 -800 -400 0 400 800 1200 1600 2000 0 10 20 30 40 50 0.02 0.04 0.06 0.08 0.1
Figure 2. ERSP and p value of channel C3 for detection of motor imagery using CAR Method.
[image:3.612.317.556.350.584.2]3
Time (ms)
F
re
q
u
e
n
c
y
(
H
z
)
-1600 -1200 -800 -400 0 400 800 1200 1600 2000 0
10 20 30 40 50
-5 0 5
6
Time (ms)
F
re
q
u
e
n
c
y
(
H
z
)
-1600 -1200 -800 -400 0 400 800 1200 1600 2000 0
10 20 30 40 50
-5 0 5
9
Time (ms)
F
re
q
u
e
n
c
y
(
H
z
)
-1600 -1200 -800 -400 0 400 800 1200 1600 2000 0
10 20 30 40 50
-5 0 5
12
Time (ms)
F
re
q
u
e
n
c
y
(
H
z
)
-1600 -1200 -800 -400 0 400 800 1200 1600 2000 0
10 20 30 40 50
-5 0 5
P Value Time (ms)
F
re
q
u
e
n
c
y
(
H
z
)
-1600 -1200 -800 -400 0 400 800 1200 1600 2000 0
10 20 30 40 50
0.02 0.04 0.06 0.08 0.1
Figure 3. ERSP and p value of channel C3 for detection intention of movement using CAR Method.
Referring to Figure 3, vertical axes represent the frequency of signal and horizontal axes represent the time. Top four represent the ERSP for direction towards 3, 6, 9 and 12 o’clock respectively (blue shows ERD and red shows ERS) and the bottom one represent p value (blue indicate significance area in ERSP among four directions). t=0 signifies the display of the visual cue.
Even though the mapping results of ERSP of four directions are different between the Figures 2 and 3, both figures share a similarity when it comes to the ANOVA results. The ANOVA results that is presented by the p-value (p<0.5 for the blue region) indicate that there are significant differences in the ERSP among four directions.
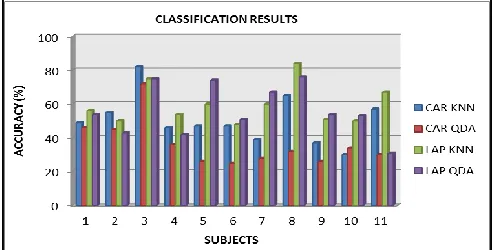
B. Predicting Intention and Direction of Movement The classification results in predicting intention and direction of movement for both of motor imagery and motor performance are based on single trial classification and presented in Figures 4 and 5, respectively. Tables 1 and 2 show the detail of the results for each figure including the frequency band (b) and channel (Ch) associated with the maximum classification accuracy for motor imagery and motor performance respectively.
Figure 4 and Table 1 present the results of predicting intention and direction of movement for the motor imagery scenario using k-NN and QDA classifier for both spatial filters, namely CAR and LPA. The classification results lie between 35% - 95% using a combination of CAR filtering and a k-NN classifier (36% of the maximum classification results are contributed to features in the γ band and 64% are associated with contralateral electrodes) and lie between 40% - 80% using the QDA classifier (27% of the maximum classification results are contributed to both δ and γ band, and 73% of it are recorded from the contralateral electrodes).
On the other hand, the classification results of LAP filtering combined with classifiers k-NN and QDA dwell within the range of 38% - 96% (54% of the maximum classification results are contributed by γ band, and 73% of it recorded from contralateral electrodes) and 41% - 76% (45% of the maximum classification results are contributed by γ band, and 55% of it recorded from ipsilateral electrodes) respectively.
Distribution of the classification results show that, only subject three give a consistence and high classification result for both spatial filters (CAR and LAP) using k-NN and QDA classifier. Moreover, it also indicates that LAP has higher average classification accuracy compared to CAR using both of the classifier namely k-NN and QDA.
Figure 4. Classification results in predicting intention and direction of movement for motor imagery.
Apart from that, LAP and CAR have same thing in common, that is k-NN classifier offer higher average classification over QDA. Besides that, the highest classification accuracy contributed by the high density electrodes highlight the importance of the high density montage used.
TABLE I. FREQUENCY BAND AND CHANNEL ASSOCIATED WITH CLASSIFICATION RESULTS IN PREDICTING INTENTION AND DIRECTION OF MOVEMENT
S
CAR LAP
k-NN QDA k-NN QDA
b ch % b ch % b ch % b ch %
S1 γ FC4 90 δ CZ 61 γ CFC1 89 α CFC3 70
S2 θ C4 61 β C4 58 γ CP4 38 γ CP4 61
S3 γ CFC4 83 γ CZ 80 γ CFC1 96 β C4 76
S4 β FC3 62 δ FC3 64 δ FC4 54 α CFC5 50
S5 α C3 49 θ C3 40 θ CCP5 65 γ FC2 41
S6 α FC5 37 α FC5 42 γ FC4 71 γ FC4 76
S7 α CFC3 55 α FC1 54 γ FC1 73 θ CP3 76
S8 β C5 64 δ CFC3 41 θ CCP5 67 δ CCP5 68
S9 δ CFC4 45 γ CCP5 45 α CP4 47 γ C4 64
S10 γ CP5 35 γ CFC4 43 β C5 49 γ FC5 55
S11 γ FC3 95 β FC1 41 γ CFC3 94 β CP2 46
[image:4.612.56.297.77.302.2] [image:4.612.314.561.245.369.2] [image:4.612.313.562.500.675.2]results are contributed by γ band and 82% of it recorded from contralateral electrodes) and 25% - 72% when using QDA classifier (46% of the maximum classification results are contributed by β band and 91% of it recorded from contralateral electrodes).
On the other hand, classification results of LAP filtering when using k-NN and QDA classifiers within the range of 48% - 84% (55% of the maximum classification results are contributed by γ band, and 100% of it recorded from contralateral electrodes) and 31% - 76% (46% of the maximum classification results are contributed by β band and 64% of it recorded from contralateral electrodes) respectively.
[image:5.612.53.300.234.359.2]Figure 5. Classification results in predicting intention and direction of movement for motor performance.
TABLE II. FREQUENCY BAND AND CHANNEL ASSOCIATED WITH CLASSIFICATION RESULTS IN PREDICTING INTENTION AND DIRECTION OF MOVEMENT FOR MOTOR PERFORMANCE
S
CAR LAP
k-NN QDA k-NN QDA
b ch % b ch % b ch % b ch %
S1 γ FC4 49 β CPZ 46 γ CCP5 56 β CCP2 54
S2 γ FC5 55 δ FC5 45 α C3 50 δ FC5 43
S3 δ FC5 82 γ C1 72 γ FC5 75 γ FC4 75
S4 γ CP1 46 β C1 36 γ C1 54 γ CCP1 42
S5 γ C3 47 β FC5 26 δ CCP5 60 β CP3 74
S6 δ FC5 47 β CP5 25 γ CFC5 48 β CP3 51
S7 γ C5 39 θ CFC3 28 γ CP3 60 δ FC1 67
S8 β CFC5 65 α CCP3 32 β CCP5 84 γ CP2 76
S9 γ C4 37 δ CP5 26 γ C5 51 β FC5 54
S10 δ FC1 30 β CP5 34 γ CP3 50 β FC5 53
S11 β CFC5 57 δ C3 30 δ CFC5 67 δ CP4 31
Dissemination of the classification result demonstrate that, subject three give a consistence and high classification result for both spatial filters (CAR and LAP) using k-NN and QDA classifier. Additionally LAP has higher average classification accuracy compared to CAR using both of the classifier namely k-NN and QDA. Subsequently for both spatial filters (CAR and LAP) k-NN classifier has higher average classification accuracy compared to QDA.
IV. DISCUSSION
Based on the classification’s result criteria, this study demonstrates that the proposed methodology and features extraction approach are capable of increasing and providing multiple control signals using single limb. It is undeniable that, detecting and discriminating the motor imagery and/or motor performance within the same limb is a challenging task. This is because of the motor tasks actives regions have very close representations on the motor cortex area [23] [24].
Although it is difficult - but not impossible, Liao et al. [25] managed to distinguish right hand finger movements (thumb, index, middle, ring and little) using power spectral changes as features. Thus, we apply centre out right wrist movement (flexion, extension, ulnar and radial) and power spectrum as features with the hypothesis that there is a difference in distribution of power spectrum among the four different directions. The hypothesis is tested using ANOVA and the results showed that there is significance difference with p value < 0.05 among the different directions.
The classification results from motor imagery and motor performance experiments indicate that, the maximum classification electrodes dominantly from contralateral electrodes. This is because movement related neural activity is lateralized where a significance occurrence of ERD over contralateral side whereas a significance occurrence of ERS over ipsilateral side of the brain during planned and terminated movements respectively [26]. Apart from that, the maximum classification electrode can be either the same or the nearest neighbour of that electrode when classified by different classifier. This is would be an advantage for the BCI design because, improper placement of BCI cap would not have much effect to the BCI system itself.
V. CONCLUSION
In this paper, we have demonstrated the feasibility of developing a single trial four class BCI systems based on a motor performance of a single limb, namely the wrist moving in four different directions using a single trial. This is evidently supported by detecting ERD and ERS in both of motor imagery and motor performance for all four directions extracted from ERSP maps. Additionally, the p values estimated from ANOVA test verify that there is significant difference of the extracted features among the four directions.
Moreover, the classification results of predicting intention of movement for both of motor imagery and motor performance emphasised that, the majority of the maximum classification accuracy are recorded from contralateral electrodes and from γ band features.
contralateral electrodes. The majority of the maximum classifications are associated with features from the γ band.
The findings from this study highlight the importance of using high density montage electrodes placement and shows with experimental evidence that LAP is superior to CAR in terms of source localisation.
REFERENCES
[1] J. R.Wolpaw, N. Birbaumer, D.J. McFarland, G. Pfurtscheller, and T. M. Vaughan. "Brain–computer interfaces for communication and control." Clinical neurophysiology 113, no. 6, pp. 767-791, 2002.
[2] G. Pfurtscheller, C. Guger, G. Müller, G. Krausz, and C. Neuper. "Brain oscillations control hand orthosis in a tetraplegic." Neuroscience letters 292, no. 3, pp. 211-214, 2000.
[3] G. Pfurtscheller, G. R. Müller, J. Pfurtscheller, H. J. Gerner, and R Rupp. "‘Thought’–control of functional electrical stimulation to restore hand grasp in a patient with tetraplegia." Neuroscience letters 351, no. 1, pp. 33-36, 2003.
[4] N. Birbaumer. "The thought translation device (TTD) for completely paralyzed patients." IEEE Transactions on Rehabilitation Engineering 8, no. 2, 2000.
[5] J. N. Mak, and J. R. Wolpaw. "Clinical applications of brain-computer interfaces: current state and future prospects." Biomedical Engineering, IEEE Reviews in 2, pp. 187-199, 2009.
[6] X. Yong and C. Menon. "EEG Classification of Different Imaginary Movements within the Same Limb." PloS one 10, no. 4, 2015.
[7] G. Pfurtscheller and C Neuper. "Motor imagery and direct brain-computer communication." Proceedings of the IEEE 89, no. 7, pp. 1123-1134, 2001.
[8] K. J. Kokotilo, J. J. Eng, and A. Curt. "Reorganization and preservation of motor control of the brain in spinal cord injury: a systematic review." Journal of neurotrauma 26, no. 11, pp. 2113-2126, 2009.
[9] A. Delorme and S. Makeig. "EEGLAB: an open source toolbox for analysis of single-trial EEG dynamics including independent component analysis." Journal of neuroscience methods 134, no. 1, pp. 9-21, 2004.
[10] M. Ferdjallahand R. E. Barr. "Adaptive digital notch filter design on the unit circle for the removal of powerline noise from biomedical signals." Biomedical Engineering, IEEE Transactions on 41, no. 6, pp. 529-536, 1994.
[11] C.-S. Huang, C-L Lin, L-W. Ko, S-Y. Liu, T-P. Su, and C.-T. Lin. "Knowledge-based identification of sleep stages based on two forehead electroencephalogram channels." Frontiers in neuroscience 8, 2014.
[12] D. J. McFarland, L. M. McCane, S. V. David, and J. R. Wolpaw. "Spatial filter selection for EEG-based communication." Electroencephalography and clinical Neurophysiology 103, no. 3, pp. 386-394, 1997.
[13] J. Lu, D. J. McFarland, and J. R. Wolpaw. "Adaptive Laplacian filtering for sensorimotor rhythm-based brain–
computer interfaces." Journal of neural engineering 10, no. 1, 2013.
[14] A. Delorme and S. Makeig, “EEGlab: An Open Source Toolbox For Analysis Of Single-Trial EEG Dynamics Including Independent Component Analysis,” J Neurosci Methods, 134, pp. 9-21, 2004,
[15] R. Grandchamp and A. Delorme, "Single-trial normalization for event-related spectral decomposition reduces sensitivity to noisy trials." Frontiers in psychology 2, pp. 1-14, 2011. [16] H. Lakany and B. A. Conway, “Classification of Wrist
Movements using EEG-based Wavelets Features.,” Conf. Proc. IEEE Eng. Med. Biol. Soc., vol. 5, pp. 5404–5407, 2005.
[17] G. Valsan, "Brain computer interface using detection of movement intention." PhD diss., University of Strathclyde, 2007.
[18] A. Bashashati, M. Fatourechi, R. K. Ward, and G. E. Birch. "A survey of signal processing algorithms in brain–computer interfaces based on electrical brain signals." Journal of Neural engineering 4, no. 2, pp. R32-R57, 2007.
[19] S. Bhattacharyya, A. Khasnobish, S. Chatterjee, A. Konar, and D. N. Tibarewala, “Performance analysis of LDA, QDA and KNN algorithms in left-right limb movement classification from EEG data,” Int. Conf. Syst. Med. Biol. ICSMB 2010 - Proc., no. December, pp. 126–131, 2010. [20] D. J. Leamy, J. Kocijan, K. Domijan, J. Duffin, R. A. Roche,
S. Commins, R. Collins, and T. E. Ward. "An exploration of EEG features during recovery following stroke-implications for BCI-mediated neurorehabilitation therapy." J Neuroeng Rehabil 11, no. 1, 2014.
[21] I. Dokare and N. Kant, “Performance Analysis of SVM, k-NN and BPNN Classifiers for Motor Imagery,” vol. 10, no. 1, ,pp. 19–23, 2014.
[22] C.-L. Obed, J. M. Ramirez, V. Alarcon-Aquino, M. Baker, D. D'Croz-Baron, and P. Gomez-Gil. "A motor imagery BCI experiment using wavelet analysis and spatial patterns feature extraction." In Engineering Applications (WEA), Workshop on, pp. 1-6, 2012.
[23] J. N. Sanes, J. P. Donoghue, V. Thangaraj, R. R. Edelman, and S. Warach. "Shared neural substrates controlling hand movements in human motor cortex." Science 268, no. 5218, pp. 1775-1777, 1995.
[24] E. B. Plow, P. Arora, M. A. Pline, M. T. Binenstock, and J. R. Carey. "Within-limb somatotopy in primary motor cortex– revealed using fMRI." Cortex 46, no. 3, pp. 310-321, 2010. [25] K Liao, R. Xiao, J. Gonzalez, and L. Ding. "Decoding
individual finger movements from one hand using human EEG signals.", 2014.
[26] C.S. Nam, J. Yongwoong, Y-J Kim, I Lee, and K. Park. "Movement imagery-related lateralization of event-related (de)synchronization (ERD/ERS): Motor-imagery duration effects." Clinical Neurophysiology 122, no. 3, pp. 567-577, 2011.
[27] T. Hoang, D. Tran, K. Truong, P. Nguyen, T.V. Van, X. Huang, D. Sharma. Experiments on Synchronous Nonlinear Features for 2-Class NIRS-Based Motor Imagery Problem. In 4th International Conference on Biomedical Engineering in Vietnam, pp. 8-12, 2013.