Decontaminate Feature for Tracking: Adaptive Tracking via
Evolutionary Feature Subset
Qiaoyuan Liua, Yuru Wang*a, Minghao Yina, Jinchang Renb, Ruizhi Lia
aNortheast Normal University, Changchun, P.R.China, 130117
bDept. of Electronic and Electrical Engineering, University of Strathclyde, Glasgow, U.K.
Abstract. Although various visual tracking algorithms have been proposed in the last 2-3 decades, it remains a challenging problem for effective tracking with fast motion, deformation, occlusion et al. Under complex tracking conditions, most tracking models are not discriminative and adaptive enough. When the combined feature vectors are inputted to the visual models, this may lead to redundancy caused low efficiency and ambiguity caused poor perfor-mance. In this paper, an effective tracking algorithm is proposed to decontaminate features for each video sequence adaptively, where the visual modeling is treated as an optimization problem from the perspective of evolution. Every feature vector is compared to a biological individual and then decontaminated via classical evolutionary algorithms. With the optimized subsets of features, “Curse of Dimensionality” has been avoided whilst the accuracy of the visual model has been improved. The proposed algorithm has been tested on several publicly available datasets with various tracking challenges and benchmarked with a number of state-of-the-art approaches. The comprehensive experiments have demonstrated the efficacy of the proposed methodology.
Keywords:Visual Tracking, Feature Subset, Decontaminate, Evolutionary algorithm.
*Yuru Wang, [email protected]
1 Introduction
Visual tracking aims to estimate the path of a target in an image sequence, given its initial location only. This technology is widely used in many applications[1][2]. The generic modes of visual tracking always extract the feature of the input image at first, then determine the target region by classification or matching methods. The features can provide a representation model of the target. Based on the model, the tracker is able to discriminate the target from its background in every frame. Since the discriminative ability of a visual model is one of the key factors to tracker’s performance, an exact representation model could lead to a high accuracy for a tracker.
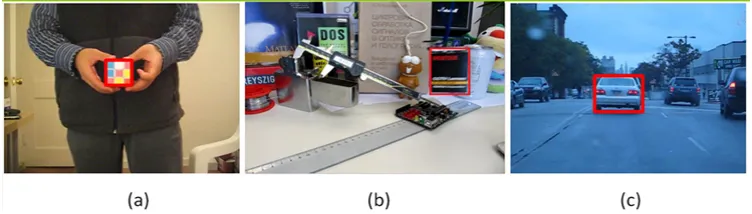
The targets various a lot under different visual conditions. For example, intuitively observing the magic cube shown in Fig.1(a), it can be distinguished easily due to the color difference to its background. In comparison, the texture features show more discriminative ability in Fig.1(b), and the edge features play an important role in Fig.1(c). However the tracker with specific features employed can only get good results on the specified video. That is to say, if color feature is employed, Fig.1(a) can surely be tracked well, however at the same time Fig.1(c) may meet a failure. Therefore the features used for tracking must be adaptive with the sequences’ specific salient characteristic.
Fig 1The salient features in different video examples.
learning and detecting over translated image patches in 2015, and standard histogram of gradients (HOG) [10] feature was employed in his Kernelized Correlation Filters (KCF) model. Zhang [11] realized a (Real-Time Compressive Tracking) CT method, in which the extracted Haar-like [12] features were compressed with a sparse measurement matrix for the appearance model. With better performance, the feature integration model is becoming more welcomed than the single feature based model in recent years. The typical work include the weighted sum model [13], hierarchical model [14], the HMM model [15], the Gaussian mixture model [16] and the pyramid model [17]. The idea of integration has also been realized in the Deep Learning framework: a STCT method [18] extracted an effective feature map via convolutional networks, the networks are trained from a large scale image classification dataset for tracking.
It has been tested that the feature integration models are superior to single feature based models, because it can comprehensively consider the characteristic in video sequences. For example, when color and texture features are employed together, the tracker can perform well on the videos in which both of these features are dominant. In contrast, the trackers only employ color features could not perform well on the sequences in which the texture feature is dominant.
However, due to diversity of video sequences, which kind of feature is absolutely dominant in tracking can not be determined easily. It is very likely to be feature A and feature B constitute the characteristics of video together. So can it be half of feature A and half of feature B? Absolutely not, perhaps 20 percent of A and 80 percent of B, or 45 percent of A and 55 percent of B, it depends. Different videos may need different proportions on feature construction, thus an adaptive representation model is needed. There is a saying that give what you needed is better than give you all, so we need to tailor useful information to specific video sequence. In this way lots of noise or redundant information in integration model could be decontaminated, the computation load could be alleviated and “Curse of Dimension” could be avoided. Moreover, the complexity of appearance model which constrains its further application to visual tracking could be decreased.
To the best of our knowledge, there are few researchers paying their efforts on tracking with selected information. A similar work with this idea is the method of Grabner etc. [19] in 2006, they selected the best weak classifiers corresponding to the features in their Adaboost framework. This method received a great improvement on tracking results in the early 21th century. The success mainly relied on the adaptiveness of the boosting. Different from this method, selecting feature is treated as an optimization problem in our algorithm, the features are decontaminated directly before assigning them to the classifiers.
[image:2.612.118.494.73.180.2]em-ployed in selecting the optimal feature subset. Moreover, in order to keep adaptiveness of the visual model on a given feature subset over the whole sequence, we update the model parameters and feature pool in a Sequential Monte Carlo framework. Instead of generative models that focus on the target matching, we realized our research in a discriminative framework of ensemble.
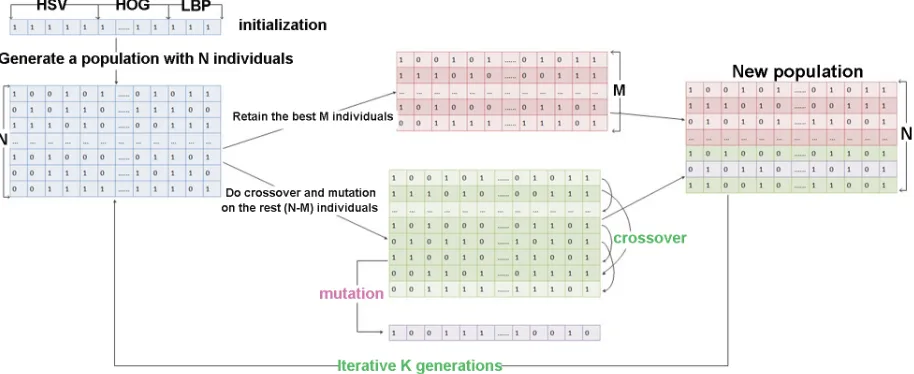
The overall framework of the proposed tracker is shown in Fig.2. Specifically, a best string is obtained using Evolutionary Algorithm at the first frame (shown in the right column): decon-taminate the features extracted into feature subsets using binary codes, in which the binary codes are optimized iteratively by Evolutionary Algorithm. The binary string represent the best features expression. Pass the binary string to all the follow-up frames, equal to let the tracker work with the most suitable features, train the classifiers with features in higher quality the tracking accuracy is sure to be enhanced. To illustrate the universality of our method, the most basic evolutionary al-gorithm Genetic Alal-gorithm [20] is utilized as an example to obtain an optimal feature subset from the feature pool. The final solution is generated iteratively by evaluating the qualities of feature subsets using the objective function, which is defined to analysis distribution between interesting region and ground truth bounding box.
The proposed method has been tested on the widely used benchmark datasets OTB2015[21] and VOT2016[22]. Extensively experiments and discussion has been performed on representative video sequences, which cover various tracking challenges. Compared with several state-of-the-art trackers, our tracker is demonstrated to perform with better or at least comparable results.
This paper is organized as follows: We first describe the process of decontaminating features for tracking in Section 2. The detailed methodology of model updating is described in Section 3. In Section 4, the overall framework of our tracker is described. Section 5 illustrates results and discussion.
Fig 2Overview of the proposed decontaminating feature based tracker.
2 Decontaminate Features for Tracking
2.1 Feature Pool
[image:3.612.71.544.420.571.2]Fig 3Approximate the optional solution by the binary evolutionary algorithm.
portions of the object are also selected by divide the bounding box into the number of4×4,2× 2patches evenly. At the highest level, the whole bounding box is considered as one patch.
In the initial procedure, widely used features including 64-bins Hue-Saturation-Value (HSV) color/gray-scale histogram, standard histogram of gradients (HOG) and Local Binary Patterns (LBP) are extracted in the patches of four scales to form a feature combination. There exist inef-fective features that are less dominant in discriminating, which are regarded as noise or redundant information. The combination with redundant information could not only effect describing the characteristic of every video sequence adaptively, but also increase the computation load and have a negative impact on tracking result. Our task is to tailor feature to every specific video adaptively and provide a subset with better discriminative ability for tracking.
2.2 Decontaminate Feature via Evolutionary Algorithm
In this section, we will fully introduce the method of optimizing the binary coded feature vector with evolutionary algorithm, and its solution processes.
2.2.1 Evolutionary Method for Optimization
[image:4.612.80.537.78.265.2]Every feature subset is represented as a binary string as shown in Fig.3, it is seen as an individ-ual in the population. At each iteration step,N binary stringsB = (b0, b1, ..., bm−1)are generated
randomly,bi = {0,1}(in which 0 represents remove this feature from feature vector and 1
repre-sents retain). For each individual, the objective function will return a fitness value which estimates the discriminative ability of the feature subset. Maximize or minimize objective value J in the following selection, crossover and mutation steps, a best string is to be obtained by optimizing the initial strings:
Selection: Fitness values are obtained by evaluating every individuals with objective function. Sort the corresponding fitness values, our algorithm retains the best M individuals as elite and leaves them to the next generation.
Crossover: For the rest (N-M) individuals, do a randomly mutual crossover according to a fixed probability. Two new individuals will be obtained in every crossover processing. Evaluate the new individuals with the objective function again, if the new individual is worse then retain the old one, otherwise replace the old with the new one.
Mutation: Choose an individual randomly from the (N-M) individuals, find the mutation point in this string according to a mutation probability and invert it. Similar to the crossover, replace the old individual with new one in better quality, otherwise discard the new string. Thus a new population is formed with the new (N-M) individuals and the elite individuals.
Iterative execute the above process for K generations until a best solution convergence, which represents the best feature subset for tracking.
2.2.2 Objective Function
As the core of optimization algorithm, objective function represents the optimization direction. With an appropriate objective function, it is sure to obtain an optimized feature subset for visual model.
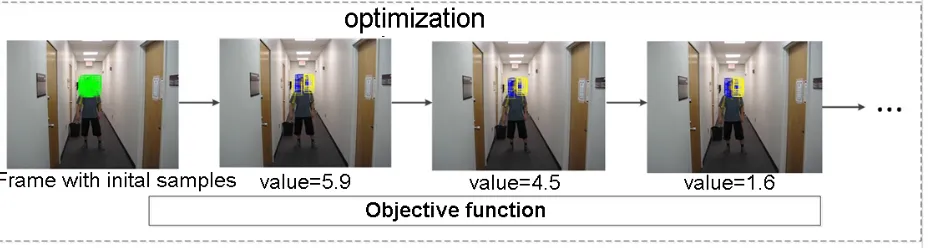
Fig 4 Schematic diagram of objective function optimization, in which the green bounding boxes in the first picture
represent samples generated randomly, the blue ones in the following pictures represent the best samples, and the yellow ones represent the worst.
[image:5.612.76.540.451.575.2]belong to the target region according to the objective function. In order to prove the feasibility of the optimization algorithm in decontaminating feature, two objective functions are designed to evaluate the feature subsets from different perspectives. Fig.4 shows the random samples and the process of optimization with the objective function, specifically the second objective function is took as an example.
Object Function J1: Each feasible solution (random binary string) corresponds to a random
combination of the feature vectors. Based on the initial features extracted from image samples and ground truth, simplified feature vectors are obtained according to the random combination strategy. Then calculate all the average distances di, i ∈ 1...N between the simplified feature
vector of samples and the simplified feature vector of ground truth bounding box according to the following formulation, specifically the ground truth of the first frame is given in benchmark for comparison:
di =n−1 n
∑
f=1
√ ds2
f −dgf2, i= 1...N (1)
where n is the size of feature vector. dsf is the f-th element of this sample feature, dgf is the f-th element of the ground truth feature. Sort the distances in descending order and select the samples farthest and nearest to ground-truth to obtain worst and best mean valuedw,dbin following
equation, in whichNwandNbare the numbers of the worst and best samples respectively.
dw =Nw−1 N
∑
N−Nw
di, db =Nb−1 Nb
∑
1
diNb (2)
Finally, the objective value is defined as:
J1 =dw−db (3)
We assume that a larger objective value represents a stronger discriminative ability of the fea-ture subset.
Object FunctionJ2: This function is designed according to the ideal of the linear discriminant
analysis(LDA)[27]: it is also based on random samples. The similarity is calculated by dot product the simplified features extracted from every random sample and ground-truth. Select the best and worst random samples to build two clusters A = {Ai|i= 1...Nb} , B = {Bi|i= 1...Nw}
according to similarity, in whichNb andNware the numbers of best and worst samples,AiandBi
are samples’ locations in corresponding cluster respectively. Then calculate the objective valueJ2
in following equation:
J2 =
Sw Sb
(4)
whereSw is within-class scatter, andSb is between-class scatter. Sw is calculated by the sum
the covariances of selected samples in two clusters.
Sw =cov(A) +cov(B) (5)
Sb is the Euclidean distance between the best mean center locationA¯and worst mean center
subset is.
Sb =
√
¯
A2−B¯2 (6)
In the above evolutionary algorithm, all the features are binary coded and optimized in the way of biological evolution. After the evolution, apply the optimal solution to the feature combination, it will be decontaminated with the character of optimal discriminative ability and efficiency.
3 Model Updating
A tracker often has to adapt to significant changes in tracking scenarios. Therefore a fixed visual model on a given feature subset may not sufficient to keep adaptiveness over the whole sequence. In order to improve the adaptability, we proposed to update the tracking parameters in a Sequential Monte Carlo (SMC) framework.
Know that the discriminative model possesses better robustness, we realized the above visual model in an ensemble tracking framework with hybrid classifiers. Every detection region is divid-ed into a pyramid with patches in four scales as mentiondivid-ed in section 2.1. Each image patch is corresponding to a weak classifier, the smaller patches in regular sizen×n are assigned to LDM classifiers, the larger patches in other sizes are assigned to SVM classifiers. Scale-adaptive hybrid weak classifiers are weighted combined as a strong one. And the final results are output from the strong classifier. You can find details in our previous work[28].
In the tracking process, the features of detection region would undergo great changes. To improve adaptiveness and generality of the tracker, both the weight vectors and the pool of weak classifiers are updated by frame to evolve the model.
The sequentially arriving flow of weight vectorVt over the whole video sequence is seen as a
state-evolving procedure. From a Bayesian point of view, its updating is estimated by obtaining its posterior distribution.
Given a sequence and a corresponding sequence of observations, the goal is to find a max posterior distribution. The Monte Carlo method provides a possible solution to this problem . Particle Filter (PF)[29] is a recursive Bayesian filter that belongs to the SMC methods.
According to the classical PF, at timet−1, the posterior probability distributionp(vt−1|Zt−1)
is usually approximated by using a finite number (N) of weightedwi
t−1 samplesp(vt−1|Zt−1) ≈
{wit−1, vti−1}Ni=1. In our methods, N is set to 500 specially. Then, the posterior distributionp(vt|Zt)
can be approximated by using some weighted samples as
p(vt|Zt)≈cp(Zt|vt) N
∑
i=1
wti−1p(vti−1|Zti−1) (7)
Because it is difficult to draw samples from the posterior distribution, the important sampling method is usually performed by a proposal distribution. Samples are drawn from a proposal density
qas
vit∼q(vti),∑
i
wit−1p(vti|vit−1). (8)
The sample weight is usually recursively updated as
The weight of each weak classifier is updated based not only on the observation at the current frame but also on its consistency with the adjacent frames. In such a way, abrupt changes will be avoided and reliable updating is realized.
4 Overview of the Adaptive Tracker
Above all, in order to decontaminate the redundant information from the feature pool, we propose an adaptive visual model. An optimal feature subset is selected using evolutionary algorithm, the adaptiveness is kept by modeling the parameters in a SMC framework. This adaptive visual model is realized in an ensemble tracking framework. The overall algorithm is shown in Algorithm 1.
Algorithm 1Framework of our tracking method.
Input:Video framesI1, I2..., It; Target statex0 at the first frame.
Output:Target statesx1;x2;...;xt ifframet=1then
Initialize target statex0 according to the ground-truth data;
Decontaminate feature with optimization method according to the ground-truth data, obtain optimal binary string which represents the best feature subset.
Provide the feature subset to classifiers for training.
end if
ifframet >1then
Obtain the set of all scanning windows in this frame asS(t);
For each input datax∈S(t), representxin multi-scale method and extract features according
to the optimal binary string.
Employ hybrid classifiers to patches in different scales.
Ensemble the weak classifiers as a strong classifier with weight combined.
Update the weight of weak classifier and pool of weak classifier under SMC framework.
end if
Fig 5The curves of the parameter settings on tracking performance.
5 Results and Discussion
[image:8.612.84.535.503.626.2]There are few benchmarks for visual tracking proposed[21,22]. Considering the fairness, the effectiveness of our tracking method is demonstrated by quantitative and qualitative analysis not only on the widely used dataset OTB2015[21] with various challenges, including illumination vari-ation, scale varivari-ation, occlusion, deformvari-ation, in-plane rotvari-ation, out-of-plane rotvari-ation, background clutters, and low resolution but also on rich VOT2016 datasets[22] which cover many represen-tative datasets, such as ALOV+++[30], non-tracking datasets, Computer Vision Online, Professor Bob Fishers Image Database and some other representative datasets. Similar to popular track-ers proposed in [21] visual cues including HSV, HOG and LBP are employed, the feature pool construction is already sufficient to analyse the effect of feature decontamination.
5.1 Evaluation methodology
We employ five widely used metrics for evaluation: Average Center Location Error (ACLE), Av-erage Overlap Ratio (AOR), success rate, precision plots and avAv-erage expected overlap.
The metric of ACLE [31] is the average Euclidean distance between center of predicted and ground truth bounding box. AOR according to the Pascal VOC criteria [32] is the overlap ratio between result output and ground truth bounding box. ACLE and AOR can evaluate the tracking method from the aspect of each video sequence frame to frame which is more intuitive. Specially, larger AOR represents better performance, and smaller ACLE represents better performance.
The success rate and precision plot follow the evaluation protocols in [33]. The ratio of suc-cessfully tracked frames is measured by a set of thresholds, where bounding box overlap ratio and center location error are employed in success rate and precision plot, respectively. We rank the tracking methods based on Area Under Curve(AUC) for success rate plot and center location er-ror at 20 pixels for precision plot. The success plot and precision plot that consider all results of different visual sequences can provide a more comprehensive comparison.
The average expected overlap is the average overlap ratio between bounding box and the ground truth similar with AOR. For a full treatment of this metric, readers are encouraged to read [22].
5.2 Parameters Discussion
We study the parameter settings on the tracking performance. Overall, the controlling parameters include the number of iterations, the encoding ratio, the crossover and mutation probabilities in the GA. Since the video sequences “boy” covers most tracking challenges such as “scale variation”, “motion blur”, “fast motion”, ‘in plane rotation”, “out of plane rotation”, all the parameters are tested on this certain video for analysis. For each parameter, we test its influence in its definition domain when the others are fixed. The curves in Fig. 5 presents the influence of the parameters settings on the tracking performance.
The genetic algorithm starts from an initial solution, and converges to an optimal one after a number of iterations. When other parameters (crossover and mutation probabilities) are fixed, number of iterations determines the precision of the optimal solution. We test number of iterations from 10 to 60. And from the curves shown in Fig.5(a), we can see that the tracking performance, especially the AOR curves is not sensitive to the number of iterations. Overall, it is fixed to 40 in all experiments.
Fig 6Average success plot and precision plot on OTB2015.
[image:10.612.153.455.76.338.2]AOR metric shows less sensitiveness to these two parameters. However a big difference is shown between the ACLE curves. Specifically, the tracker reaches the minimum error when the crossover probability is around 0.6 and the mutation probability is 0.01. That means frequent crossover or mutation will lead to premature convergence. Therefore, these two parameters are set to 0.55 and 0.01.
Table 1Tracking sequences used in our experiments Video sequences Nubmer of frames Main challenges
Boy 602 Scale Variation,Motion Blur,Fast Motion,In-Plane Rotation, Out-of-Plane Rotation
Basketball 725 Illumination Variation,Occlusion,Deformation,Out-of-Plane Rotation,Background Clutters
Car4 659 Illumination Variation,Scale Variation
Coke 291 Illumination Variation,Occlusion,Fast Motion,In-Plane Rotation,Out-of-Plane Rotation,Background Clutters
Couple 140 Scale Variation,Deformation,Fast Motion,Out-of-Plane Rotation,Background Clutters
Deer 71 Motion Blur,Fast Motion,In-Plane Rotation,Background Clutters,Low Resolution
Football1 81 In-Plane Rotation,Out-of-Plane Rotation,Background Clutters
Girl 500 Scale Variation,Occlusion,In-Plane Rotation,Out-of-Plane Rotation
Walking2 500 Scale Variation,Occlusion,Low Resolution
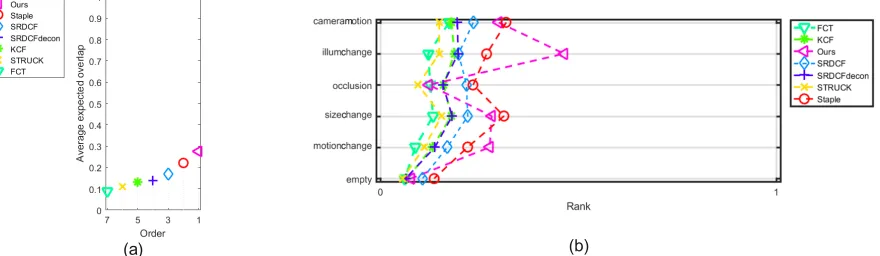
[image:10.612.97.515.477.707.2]Fig 7Average expected overlap plot on VOT2016(a). Performance rank between our method and other state-of-the-art
methods under different visual challenges(b).
5.3 Comparison with State-of-the-Art Methods
Our method is compared with ten state-of-the-art publicly available visual trackers, including MIL [34], VTD[35], Struck [36], SCM [37], TLD[31], LSHT [38], FCT [39], KCF [9], Staple [40] and SRDCFdecon [41] on dataset OTB2015. The overall performance on OPE and SRE evaluation is shown in Fig. 6. According to the plots, we can see that the proposed approach achieves the best precision in both OPE and SRE. For success rate, ours is the best for OPE and the second best in SRE.
Besides, we also compared our method with six representative tracking methods on datasets VOT2016, including Staple [40], SRDCF[42], SRDCFdecon [41], KCF [9], FCT [39] and Struck [36](The reason for the lack of several methods is that these methods didn’t provide results for VOT datasets). The overall performance on average expected overlap evaluation and the performance rank between our method and other state-of-the-art approaches under different visual challenges are shown in Fig. 7. As seen, our method reaches a higher average expected overlap ratio and on-average ranks the first under various visual challenges, especially in coping with illumination changes.
Since in both datasets, our method performs with better or at least comparable results, to evalu-ate intuitively, we select ten video sequences from the OTB2015 benchmark dataset. The selected sequences cover various attributes in tracking challenges are shown in Table 1, the AOR and ACLE results compared with six representative tracking methods are reported in Table 2 and Table. 3. The proposed tracker with two different objective functions Ours (J1) and Ours (J2) (described in
formula(3) and (4), which represent two different algorithms used to implement optimization) are listed in tables specifically. In addition, to better validate the effect of the decontamination step, the proposed method is also compared with the method without optimization step (Ours(baseline)) in the same tracking framework. As higher AOR value and lower ACLE value represent better performance, conclude from data in tables we can see that the method optimized withJ1objective
function can achieve a higher AOR value, and the method optimized with J2 objective function
can achieve a lower ACLE value. However compared to the tracking method without optimization step, the performance of which with both these two objective functions have been enhanced a lot.
[image:11.612.101.541.92.220.2]Fig 8Tracking results comparison of the tested videos on some key frames, where the tracking results are represented
as a bounding box. Different color represents different tracker.
is qualified to provide the accurate locations of the target.
[image:12.612.119.494.69.599.2]Fig 9Tracking results comparison of the tested videos on some key frames, where the tracking results are represented as a bounding box. Different color represents different tracker.
Table 2Tracking results on AOR, where DFT(J1) and DFT(J2) are the data for the proposed tracking employ different
object functions shown in formula (2) and (4)
AOR LSHT FCT KCF Staple SRDCFdecon Ours (baseline)
Ours (J1)
Ours (J2)
[image:13.612.107.506.511.690.2]Table 3 Tracking results on ACLE, where DFT(J1) and DFT(J2) are the data for the proposed tracking employ
different object functions shown in formula (2) and (4)
ACLE LSHT FCT KCF Staple SRDCFdecon Ours (baseline)
Ours (J1)
Ours (J2)
BOY 15.67 6.07 1.97 2.54 1.5 1.16 1.06 1.03 Basketball 70.64 77.4 5.02 11.52 18.35 16.51 7.66 12.55 Car4 87.71 37.7 9.58 12.1 1.56 17.07 3.17 3.23 Coke 35.59 12 12.67 9.36 13.35 7.6778 5.93 5.05 Couple 64.33 31.9 45 4.3 3.3 3.077 2.58 2.49 Deer 41.33 4.4 11.6 10.5 2.7 3.86 2.49 3.66 Football1 5.92 16.4 3.25 2.3 6.04 2.363 1.69 1.55 Girl 24.45 13 8.39 7.9 2.3 11.77 9.85 8.44 Walking2 2.79 23.5 6.66 1.8 0.88 3.46 1.09 1.09 Bird2 17.15 45.82 7.67 - 8.32 9.69 7.88 6.16 Average 36.56 26.8 11.18 6.9 5.83 7.66 4.34 4.52
background, fast motion, occlusion, deformation and so on. The success of our method mainly due to two factors: the first one is that the features used in the tracking process are different be-tween video sequences, and every feature subset is corresponding to the character of current video sequences. With high discriminative visual model, the accuracy of tracker is sure to be enhanced. The second factor is: SMC based framework is employed to update tracking parameters and fea-ture pool, target deformation and abrupt changes are able to be handled in the tracking process. As a result, the stability and adaptability of the tracking are well guaranteed.
6 Conclusion
In this paper, a novel scheme is proposed to improve the adaptability and robustness of visual models. Specifically, the visual modeling is converted into an optimization problem, where the optimal solution is determined by applying the classical evolutionary algorithm. By applying the determined adaptive visual model for specific video sequence, it helps to provide a new view for the visual modeling problem. The Genetic Algorithm is employed as an example due to its strong generalization capability, other evolutionary algorithms such as Artificial immune algorithm, Sim-ulated annealing algorithm can also be employed. Although in our experiments only color, edge and texture features are employed, more visual cues such as motion and Haar-like features can also be added. For future work, we will integrate more features and other existing evolutionary algorithms to further improve the performance of the proposed trackers.
7 Acknowledgement
References
1 S. Ali and M. Shah, “Floor fields for tracking in high density crowd scenes,” in European Conference on Computer Vision, 1–14 (2008).
2 D. A. Forsyth and J. Ponce, “Computer vision: A modern approach,”14(1), 133149 (2002). 3 F. S. F. M. W. J. V. D. Danelljan, Martin Khan, “Adaptive color attributes for real-time
visu-al tracking,” inIEEE Conference on Computer Vision and Pattern Recognition, 1090–1097 (2014).
4 P. Zhao, H. Zhu, H. Li,et al., “A directional-edge-based real-time object tracking system em-ploying multiple candidate-location generation,”IEEE Transactions on Circuits and Systems for Video Technology23(3), 503–517 (2013).
5 A. R. Zamir, A. Dehghan, and M. Shah, “Gmcp-tracker: Global multi-object tracking using generalized minimum clique graphs,” (2012).
6 S. Zhang, H. Yao, X. Sun,et al., “Sparse coding based visual tracking: Review and experi-mental comparison,”Pattern Recognition46(7), 1772–1788 (2013).
7 G. Yuan, M. Xue, P. Zhou,et al.,PCA-based adaptive particle filter for tracking(2010). 8 R. Ramezani, P. Angelov, and X. Zhou, “A fast approach to novelty detection in video streams
using recursive density estimation,” inIntelligent Systems, 2008. International IEEE Confer-ence, 14–2 – 14–7 (2008).
9 J. F. Henriques, C. Rui, P. Martins, et al., “High-speed tracking with kernelized correlation filters,” IEEE Transactions on Pattern Analysis and Machine Intelligence 37(3), 583–596 (2015).
10 N. Dalal and B. Triggs, “Histograms of oriented gradients for human detection,”IEEE Com-puter Society Conference on ComCom-puter Vision and Pattern Recognition. IEEE ComCom-puter So-ciety Conference on Computer Vision and Pattern Recognition1(12), 886–893 (2005). 11 K. Zhang, L. Zhang, and M. H. Yang, “Real-time compressive tracking,” inEuropean
Con-ference on Computer Vision, 864–877 (2012).
12 R. Lienhart and J. Maydt, “An extended set of haar-like features for rapid object detection,”
1, I–900–I–903 vol.1 (2002).
13 M. Spengler and B. Schiele, “Towards robust multi-cue integration for visual tracking,” Ma-chine Vision and Applications14(1), 50–58 (2003).
14 P. Perez, J. Vermaak, and A. Blake, “Data fusion for visual tracking with particles,” Proceed-ings of the IEEE92(3), 495–513 (2004).
15 H. Wang, D. Suter, K. Schindler, et al., “Adaptive object tracking based on an effective appearance filter,” IEEE Transactions on Pattern Analysis and Machine Intelligence 29(9), 1661–1667 (2007).
16 Y. Wu and T. S. Huang, “Robust visual tracking by integrating multiple cues based on co-inference learning,”International Journal of Computer Vision58(1), 55–71 (2004).
17 Q. Bai, Z. Wu, S. Sclaroff,et al., “Randomized ensemble tracking,”Conference on Computer Vision and Pattern Recognition., 2040–2047 (2013).
19 H. Grabner, M. Grabner, and H. Bischof, “Real-time tracking via on-line boosting,” inBritish Machine Vision Conference 2006, Edinburgh, Uk, September, 47–56 (2006).
20 D. E. Goldberg,Genetic algorithms in search, optimization, and machine learning, Addison-Wesley Pub. Co., (1989).
21 Y. Wu, J. Lim, and M. H. Yang, “Object tracking benchmark,”IEEE Transactions on Pattern Analysis and Machine Intelligence37(9), 1834–48 (2015).
22 M. Kristan, A. Leonardis, J. Matas,et al., The Visual Object Tracking VOT2016 Challenge Results, Springer International Publishing (2016).
23 T. Darrell and K. L. Grauman, “Matching sets of features for efficient retrieval and recogni-tion,”Massachusetts Institute of Technology(2006).
24 D. B. Fogel,Evolutionary algorithms in theory and practice, Oxford Univ. Pr (1998).
25 S. Das and P. N. Suganthan, “Differential evolution: A survey of the state-of-the-art,”IEEE Transactions on Evolutionary Computation15(1), 4–31 (2011).
26 H. Tang, S. Xue, and C. Fan, “Differential evolution strategy for structural system identifica-tion,”Computers and Structures86(2122), 2004–2012 (2008).
27 R. A. F. S. F.R.S., “The use of multiple measurements in taxonomic problems,” Annals of Eugenics7(2), 179188 (1936).
28 M. Y. S. W. Yuru Wang, Qiaoyuan Liu, “Large margin classifier-based ensemble tracking,”
Journal of Electronic Imaging25(4), 043006 (2016).
29 A. Doucet, S. Godsill, and C. Andrieu, “On sequential monte carlo sampling methods for bayesian filtering,”Statistics and Computing10(3), 197–208 (2003).
30 A. W. Smeulders, D. M. Chu, R. Cucchiara, et al., “Visual tracking: An experimental survey.,” IEEE Transactions on Pattern Analysis and Machine Intelligence 36(7), 1442–68 (2014).
31 K. Z., “Tracking-learning-detection,” IEEE Transactions on Pattern Analysis and Machine Intelligence34(7), 1409–1422 (2012).
32 E. M., “The pascal visual object classes (voc) challenge,”International Journal of Computer Vision88(2), 303–338 (2010).
33 Y. M. H. Wu Y, Lim J, “Online object tracking: A benchmark,”IEEE Conference on Com-puter Vision and Pattern Recognition, 2411–2418 (2013).
34 B. S. Babenko B, Yang M H, “Visual tracking with online multiple instance learning,” Com-puter Vision and Pattern Recognition, 983–990 (2009).
35 J. Kwon and K. M. Lee, “Visual tracking decomposition,” inIEEE Conference on Computer Vision and Pattern Recognition, 1269–1276 (2010).
36 T. P. H. S. Hare S, Saffari A, “Struck: Structured output tracking with kernels,”International Conference on Computer Vision., 263–270 (2011).
37 Z. W, “Robust object tracking via sparsity-based collaborative model,”IEEE Conference on Computer Vision and Pattern Recognition, 1838–1845 (2012).
39 K. Zhang, L. Zhang, and M. H. Yang, “Fast compressive tracking.,” IEEE Transactions on Pattern Analysis and Machine Intelligence36(10), 2002–15 (2014).
40 L. Bertinetto, J. Valmadre, and Golodetz, “Staple:complementary learners for real-time track-ing,”The IEEE Conference on Computer Vision and Pattern Recognition(2016).
41 K. F. S. e. a. Danelljan M, Hager G, “Adaptive decontamination of the training set: A unified formulation for discriminative visual tracking,” IEEE Conference on Computer Vision and Pattern Recognition(2016).
42 M. Danelljan, G. Hager, F. S. Khan, et al., “Learning spatially regularized correlation fil-ters for visual tracking,” inIEEE International Conference on Computer Vision, 4310–4318 (2016).
Yuru Wang received PhD degree in Department of Computer Science and Technology from Harbin Institute of Technology, China in 2010. Her current research interests include computer visions and pattern recognition
Qiaoyuan Liureceived the bachelors degree in Department of Computer Science and Technology from the Northeast University, Shenyang, China, in 2014. Currently, she is pursing the M.S. degree in Department of Computer Science and Technology from Northeast Normal University, Changchun, China. Her current research interests is visual tracking.
Minghao Yinreceived PhD degree in College of Computer Science and Technology, Jilin Univer-sity, China in 2008. His current research interests mainly include automated planning, automated reasoning, semantic web and approximate reasoning.
Biographies and photographs of the other authors are not available.
List of Figures
1 The salient features in different video examples.
2 Overview of the proposed decontaminating feature based tracker.
3 Approximate the optional solution by the binary evolutionary algorithm.
4 Schematic diagram of objective function optimization, in which the green bounding boxes in the first picture represent samples generated randomly, the blue ones in the following pictures represent the best samples, and the yellow ones represent the worst. 5 The curves of the parameter settings on tracking performance.
6 Average success plot and precision plot on OTB2015.
7 Average expected overlap plot on VOT2016(a). Performance rank between our method and other state-of-the-art methods under different visual challenges(b).
8 Tracking results comparison of the tested videos on some key frames, where the tracking results are represented as a bounding box. Different color represents different tracker. 9 Tracking results comparison of the tested videos on some key frames, where the tracking results are represented as a bounding box. Different color represents different tracker.
List of Tables
1 Tracking sequences used in our experiments
2 Tracking results on AOR, where DFT(J1) and DFT(J2) are the data for the proposed tracking employ different object functions shown in formula (2) and (4)