Hydrodynamic coefficients of oscillating flat plates
at 0
:
15
6
KC
6
3
:
15
XinliangTian1,2•LongbinTao3•XinLi1,2•Jianmin Yang1,2
Abstract This article presents an experimental investiga-tion on the hydrodynamic coefficients of oscillating flat plates. The plates are forced to oscillate harmonically in still water. The range of Keulegan–Carpenter number (KC¼2pa=D, where a is the single amplitude of oscilla-tion and D is the equivalent diameter of the plate) is 0:156KC63:15. The hydrodynamic forces acting on the plates are measured and the hydrodynamic coefficients including added mass and damping coefficients are calcu-lated using the Morison’s equation. The influences of the thickness ratio, shape, edge corner radius, perforation ratio and hole size on the hydrodynamic coefficients of a single plate are analyzed and presented. For the twin- and triplet-plate configurations, the spacing effects are also evaluated.
Keywords Flat plateOscillatory flowAdded mass
Damping
1 Introduction
Floating offshore structures at sea may experience motion responses due to the incident wave forces. The amplitude of heave motion is a particular concern for engineers, because large heave motion may cause damages in risers,
drilling pipes and onboard equipments. There are two ways to minimize the heave motion responses, either adjusting the natural heave period of the platform and making it out of the wave frequency region to avoid resonance, or increasing the heave damping of the system. For the deepwater Spar platform, heave plates are usually installed at the bottom of the platforms and have been demonstrated to be effective devices to improve the heave motion per-formance [2]. This is because the heave plates significantly increase the effective heave added mass of the platform, and the natural period of the heave motion is increased and moved further out of the wave-period region. Furthermore, the heave plates enhance the vortex shedding pattern and increase the damping of the system. Therefore, the added mass and damping are considered as the main parameters characterizing the hydrodynamic performance of the heave plates.
For a rigid body oscillating in a fluid at rest or a fixed body in an oscillatory flow, Keulegan–Carpenter number (KC) and the Reynolds number are, respectively, defined as
KC¼2pa
D ð1Þ
Re¼UmaxD
m ð2Þ
whereDis the characteristic dimension of the body, e.g., diameter for a circular disk,ais the single amplitude of the oscillation,Umaxis the maximum velocity of the oscillation and taken as Umax¼ ðKCÞD=T, T is the period of the oscillation andmis the kinematic viscosity of the fluid. The frequency numberbgiven by the ratio ofReandKCis also used in this study, so that
b¼ Re
KC¼
D2
mT ð3Þ
& Xin Li
1 State Key Laboratory of Ocean Engineering, Shanghai Jiao
Tong University, Shanghai 200240, China
2 Collaborative Innovation Center for Advanced Ship and
Deep-Sea Exploration, Shanghai 200240, China
3 School of Marine Science and Technology, Newcastle
Many experimental (see, e.g., [3,5,6,9,13,17,18]) and numerical (see,e.g., [4, 7, 8, 11, 12, 14–16, 19]) investi-gations on the hydrodynamic performance of heave plates have been conducted in the past two decades. The added mass and damping of the heave plates are dependent on bothKCandb. The effects of geometric configurations are also investigated, e.g., the size of the plates [17], the dis-tances between multiple plates [6, 7, 14], the thickness [3, 6, 15–17], the porosity [6, 8, 13] and the edge taper angles [11]. The effect of the plate shape have not been considered.
It is noted that the previous studies were mainly focused on the cases at low KC numbers, i.e., KC61:2. The hydrodynamic characteristics of the oscillating flat plates at higher KC number are required to be addressed. In the present study, we carried out a forced oscillation test for the flat plates at 0:156KC63:15 using a self-developed motion mechanism. The range of KC is decided by the upper and lower limits of the present experimental setup for reliable measurement. The effects of thickness ratios, shapes, edge corner radii, perforation ratio and perforated hole size as well as the spacing between multiple plates on the hydrodynamic coefficients of plates are also investigated.
2 Experimental apparatus
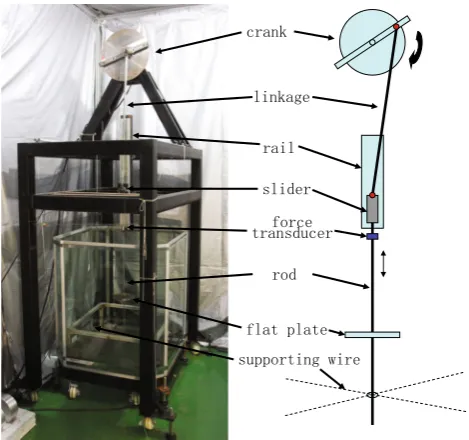
The experiments were carried out in the State Key Labo-ratory of Ocean Engineering in Shanghai Jiao Tong University. Figure1 shows the physical photo and the schematic diagram of the test facility which was carefully
designed for the oscillation tests. The main dimension of the test facility is 1.5 m long, 1.1 m wide and 3.0 m high. The facility consists of the main frame, the motion mech-anism and the observation water tank.
The main frame is made of steel with sufficient stiffness and weight, ensuring that structural vibration is eliminated during the oscillation test. As shown in Fig. 1, the crank-slider mechanism is used to generate the one-dimensional oscillatory motion. The crank is driven by a servo motor. The period of oscillation is determined by the rotation speed of the crank and the oscillation amplitude is deter-mined by the radius of the crank.
The rail and the supporting lines ensure that the rod and heave plate oscillate in through the center of the plate. Therefore, one-dimensional oscillation could be generated with various amplitudes and periods. The linkage is as long as 1.2 m and the maximal radius of the crank is 0.1 m, ensuring that the oscillation motion of the plate is approximately harmonic.
The axial force on the rod is measured by a ten-sion/compression type load cell. The rated capacity of the load cell is 200 N and the nonlinearity of the load cell is within 0:5%of the rated output. The rod may also provide damping forces to the system due to its interactions with the water and the supporting lines. Oscillation tests without plate show that the damping force provided by the rod is very small compared with the damping force provided by the plate; therefore, the effect of the rod on the damping of the system is neglected. The motion of the heave plate is recorded with a laser displacement sensor. The accuracy of the displacement sensor is within 0.01 mm. The sampling frequency of the measurement is 100 Hz. As the synchro-nization of the motion and force measurements is crucial to the added mass and damping results, the phase lag between the motion and force signals are measured carefully before the formal oscillation tests. The phase lag is kept within 0.01 s, which is no more than 2 % of the period of the oscillation motion.
The main dimensions of the water tank are 1 m long, 1 m wide and 1.1 m deep. The depth of the water is 1 m and the mean position of the plate is at 0.5 m below the water surface. The ratio of the dimension of the tank and the diameter of plates is about five which is close to the value in the configurations used by [3] and [13]. For the oscillation tests with large amplitudes, the influences of the free surface should be carefully considered. According to the experimental results by [6], the influence of immersion depth of the plate could be negligible when the immersion depth was larger than one diameter of the plate. In the present study, the minimal distance between the plate and free surface was more than two times of the diameter of the plate. Furthermore, there was no evident free surface elevation in any test. Thus, the effects of the
[image:2.595.53.288.476.696.2]walls and free surface on the measured results could be neglected.
3 Plate models
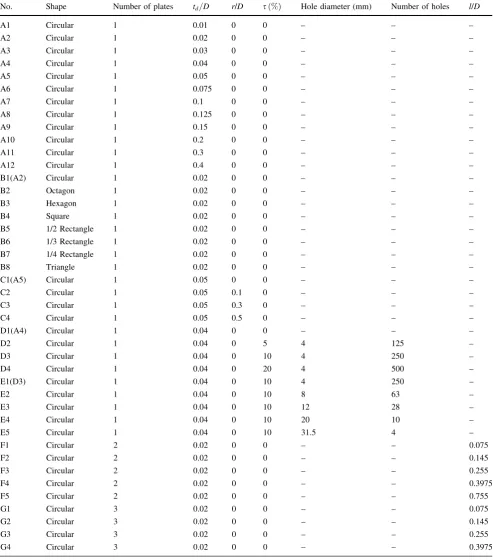
The influences of the thickness ratio, shape, edge corner radius, perforation ratio, hole size and the spacing between multiple plates on the hydrodynamic coefficients of oscil-lating plates are considered. It is not practical to do the test for all the different combinations of the considered factors. Therefore, seven individual sets of comparison test are designed for investigating the influences of the seven dif-ferent factors, respectively. A circular flat plate model with a diameter of 200 mm is used as a basic plate shape for comparing. Table1 shows the parameters for the plate models used for the oscillation test.
The sets A–E are designed for evaluating the influences of thickness ratio, plate shape, edge corner radius, perforation ratio and hole size, respectively. Additionally, to investigate the spacing effect of the multiple plates, the sets F and G are designed for the twin- and triplet-plate tests, respectively. In Table1,tdrefers to the thickness of the plates andrrefers to the radius of the edge rounding off.srefers to the perforation ratio of the disk.lrefers to the distance between multiple plates. All of the plate models used in this study are of the same area ofA¼314:2 cm2, i.e., corresponding to the area of a circular plate with the diameter of 200 mm. For the non-circular plates (B2–B8), the characteristic diameter is
cal-culated asD¼pffiffiffiffiffiffiffiffiffiffiffi4A=p¼200 mm. The rectangular plate models B5–B7 are the plates of different width/length ratios. For instance, the plate ‘‘1/2-rectangle’’ refers to the rectan-gular plate with a width/length ratio of 1:2. The perforation ratio is defined as the ratio between the perforated area and the area of the solid plate. To minimize the measurement error, the plate model should be as light as possible but with sufficient stiffness. In this study, the plate models of td=D0:04 are made of steel, and the rest of the plate models are made of aluminum.
Figure2shows the photos of the plate models. The plate model A2 is used in model tests for multiple plates. In this study, twin- and triplet-plate configurations are considered for investigating the spacing effects, see the multiple-plate models in Fig.3.
4 Test matrix
The matrix for the single plate test is shown in Table2, where U and refer to the cases carried out and not,
respectively. 37 runs of oscillation tests are conducted for each single plate model and theKC number ranges from
0.15 to 3.15. For eachKCnumber, two or three oscillation frequencies are selected, i.e.,f ¼1, 1.5 and 2 Hz, respec-tively. Thus, the corresponding frequency number is b¼ ð48Þ 104. The choice of these parameters ensures that the measured force is within the optimal working region of the load transducer, and also ensures that there is no evident water surface elevation during the tests. Each test runs at least 30 cycles, and at least 15 cycles in the ‘‘steady state’’ will be used for the data processing.
5 Hydrodynamic force coefficients
Disregarding the friction between the supporting wires and the rod, the motion equation of the rod and the plate model could be written as
M€z¼FhydþFrodþFbycMg ð4Þ
where M is the total mass of the plate and rod; €z is the acceleration of plate which is calculated by second derivative of the plate motionz;gis the acceleration of gravity;Fhydis the hydrodynamic force acting on the plate and rod;Frodis the force measured by the force transducer installed at the top end of the rod;Fbycis the buoyancy of the plate and the rod. It is noted thatFrod could be written as the sum of the static component (Fs
rod) and the dynamic component (Fdrod), i.e.,
Frod ¼Frods þF
d
rod.Fbyccould also be written as the sum of the static component (Fbycs ) and the dynamic component
(Fd
byc), i.e.,Fbyc¼FsbycþF d byc.F
d
bycaccounts for the varia-tion of the buoyancy during oscillavaria-tion.Fbycd could be
cal-culated as Fd
byc¼ qgArodz, where Arod is the area of the cross section of the rod. Therefore, according to Eq.4, the hydrodynamic forceFhydis calculated as
Fhyd¼M€zFrodFbycþMg ð5Þ
¼M€z ðFsrodþFrodd Þ ðFbycs qgArodzÞ þMg ð6Þ
In the static state (the disk is submerged in water but without oscillation), the force measured at the top of the rod (Fsrod) equals to the difference between the gravity (Mg) and buoyancy (Fbycs ) of the rod and plate. Therefore, we have
MgFs
rodFsbyc¼0. Equation6could be rewritten as
Fhyd¼M€zFrodd þqgArodz ð7Þ
FdðtÞ ¼Cd 1 2q
pD2
4 z_jz_j ð8Þ
whereCd is the drag coefficient andz_is the velocity of the plate. Since the plate is forced to oscillate sinusoidally, the
drag coefficient and added mass coefficient (Ca) are cal-culated using Fourier analysis, respectively, as [10]
Cd¼
3x qpD2U2
max
Z T
0
[image:4.595.51.545.74.635.2]FhydðtÞcosðxtÞdt ð9Þ
Table 1 Parameters of the flat plate models
No. Shape Number of plates td=D r/D sð%Þ Hole diameter (mm) Number of holes l/D
A1 Circular 1 0.01 0 0 – – –
A2 Circular 1 0.02 0 0 – – –
A3 Circular 1 0.03 0 0 – – –
A4 Circular 1 0.04 0 0 – – –
A5 Circular 1 0.05 0 0 – – –
A6 Circular 1 0.075 0 0 – – –
A7 Circular 1 0.1 0 0 – – –
A8 Circular 1 0.125 0 0 – – –
A9 Circular 1 0.15 0 0 – – –
A10 Circular 1 0.2 0 0 – – –
A11 Circular 1 0.3 0 0 – – –
A12 Circular 1 0.4 0 0 – – –
B1(A2) Circular 1 0.02 0 0 – – –
B2 Octagon 1 0.02 0 0 – – –
B3 Hexagon 1 0.02 0 0 – – –
B4 Square 1 0.02 0 0 – – –
B5 1/2 Rectangle 1 0.02 0 0 – – –
B6 1/3 Rectangle 1 0.02 0 0 – – –
B7 1/4 Rectangle 1 0.02 0 0 – – –
B8 Triangle 1 0.02 0 0 – – –
C1(A5) Circular 1 0.05 0 0 – – –
C2 Circular 1 0.05 0.1 0 – – –
C3 Circular 1 0.05 0.3 0 – – –
C4 Circular 1 0.05 0.5 0 – – –
D1(A4) Circular 1 0.04 0 0 – – –
D2 Circular 1 0.04 0 5 4 125 –
D3 Circular 1 0.04 0 10 4 250 –
D4 Circular 1 0.04 0 20 4 500 –
E1(D3) Circular 1 0.04 0 10 4 250 –
E2 Circular 1 0.04 0 10 8 63 –
E3 Circular 1 0.04 0 10 12 28 –
E4 Circular 1 0.04 0 10 20 10 –
E5 Circular 1 0.04 0 10 31.5 4 –
F1 Circular 2 0.02 0 0 – – 0.075
F2 Circular 2 0.02 0 0 – – 0.145
F3 Circular 2 0.02 0 0 – – 0.255
F4 Circular 2 0.02 0 0 – – 0.3975
F5 Circular 2 0.02 0 0 – – 0.755
G1 Circular 3 0.02 0 0 – – 0.075
G2 Circular 3 0.02 0 0 – – 0.145
G3 Circular 3 0.02 0 0 – – 0.255
Fig. 2 Photo of the flat plate models
Fig. 3 Photo of the
[image:5.595.180.546.57.508.2]Ca¼ 1 pq8Umax
Z T
0
FhydðtÞsinðxtÞdt ð10Þ
wherexis the circular frequency and taken asx¼2p=T, Cais the added mass coefficient,8is the immersed volume of the plate, taken as8 ¼ ð1=4ÞpD2t
d, andqis the density of the fluid.
The hydrodynamic drag force can also be expressed using an equivalent linear damping coefficientBas
FdðtÞ ¼Bz_ ð11Þ
The two coefficientsBandCdcan be related to each other by the equivalent linearization of the quadratic damping using Fourier decomposition [10], thus
B¼1
3mqbDðKCÞCd ð12Þ
For the convenience of comparing the results with previous studies, the added mass and the damping coefficients are further nondimensionalised against the theoretical ideal fluid added mass, m0¼ ð1=3ÞqD3. Thus, the added mass and damping coefficients are rewritten, respectively, as
A0¼Cam
m0 ð13Þ
B0¼ B
2m0x¼
ðKCÞCd
4p ð14Þ
wheremis the displacement mass of the disk,m¼q8.
6 Results and discussions
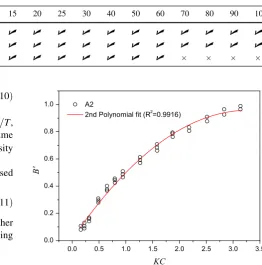
The characteristics of damping and added mass of the plates could be represented by eitherCd andCa orB0 and A0, respectively. B0 and A0 are used in this study for the convenience of comparing the results with [3] and [13]. For each heave plate, 37 tests are conducted and 37 sets ofA0 andB0 results are obtained, respectively. As the effect of frequency (b) on the hydrodynamic results is actually weak [3], the results ofA0 andB0 are only plotted againstKCin this study. Because there are many data points in each comparable test set, it is not feasible to plot all the data points of different plates together. Therefore, to provide a clear comparison of the results of different plates, the results for each plate are fitted using a quadratic
polynomial regression, see Fig.4 as an example. The coefficient of determination denoted asR2is introduced to evaluate how well data fit the regression line. The value of R2 ranges from 0 to 1. An R2 of 1 indicates that the regression line perfectly fits the data, while an R2 of 0 indicates that the line does not fit the data at all. The values ofR2for the different plates are all above 0.96, indicating a favorable representation of the experimental results. The original data points are available online as the electronic supplementary material.
6.1 Comparison with the literatures
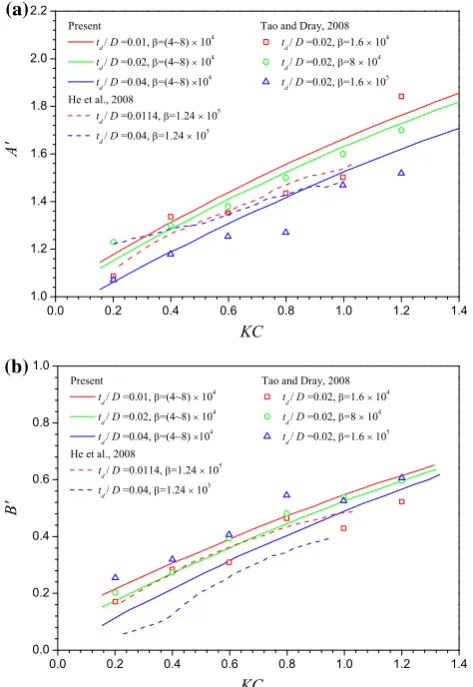
To validate the present experimental setup and measure-ments, the added mass and damping coefficients of the plates A1, A2 and A4 are compared with the experimental results by [3] and [13], see Fig.5. It should be noted that, as there lack cases with exactly the same parameters from different studies, only some of the most similar cases are selected for comparison.
[image:6.595.276.539.70.336.2]As shown in Fig.5a, a relative large scatter is observed in the results of the added mass coefficients from different experimental studies. However, the monotonous relation betweenA0andKCis clearly indicated in each case. For the plate of td=D¼0:02, the added mass coefficient obtained from the present test atb¼ ð48Þ 104agrees well with
Table 2 List of the oscillation
amplitude and frequency combinations
f a(mm)
(Hz) 5 7 10 15 20 25 30 40 50 60 70 80 90 100
1 U U U U U U U U U U U U U
1.5 U U U U U U U U U U U U U U
2 U U U U U U U U U U
Fig. 4 Quadratic polynomial regression of the damping coefficient
the results by [13] at b¼8104. Compared with the results of the added mass coefficient by [3], the results of the present study is generally higher for the plate oftd=D¼ 0:01 and is generally lower for the plate oftd=D¼0:04. As shown in Fig.5b, a good agreement is observed in the damping coefficients between the present study and [13]. Compared with the results by [3], for the plates with sim-ilar/same thickness ratio, the damping coefficients obtained in the present study are higher. As we know, for the lightly damped system, the inertia force dominates the total force experienced by the system. Therefore, it is difficult to identify the damping force in the total force measured. Different experimental configurations often give different damping results. There are several reasons that may affect the damping coefficient. First of all, the phase lag between displacement and force signals is essential for the calcu-lation of the damping coefficient, as indicated in Eqs.9and 10. On the other hand, experimental investigations by [1] demonstrate that the damping of the submerged oscillating plate may be affected by the free surface. Thus, the
influences of free surface should be carefully checked. However, it is noted that both the present study and the study by [3] have successfully revealed the trend that the damping coefficient decreases as the plate thickness of the plate increases for the thin plates.
For the thin plate oscillating perpendicular to its plane in a fluid, the force acting on the disk is dominated by the pressure drag (form drag) rather than the friction drag. On the other hand, the flow separation point is always fixed at the plate tips. Thus, it has been widely recognized that the effect of frequency (or Reynolds number) on this problem is very weak. However, it is noted in Fig.5 that the added mass and damping coefficients in the work of [13] have shown some discrepancies between the results at different frequencies. As we know, for a given oscillating amplitude, the total force acting on the disk is approximately propor-tional to the square of frequency, i.e.,F_f2. In the work of [13], the considered oscillating frequency ranges from 0.1 Hz to 1 Hz, it implies that the magnitude of the force acting on the disk at the low frequency (0.1 Hz) is about two orders smaller than that at the high frequency (1 Hz). That means the load cell must keep a very good accuracy in a very wide measurement range. It is normally not easy to achieve this. Based on our experience, the optimal working range of the load cell used in the present study is suggested to be within 30–70% of the maximal measurement range of the load cell. In the present study, the abandon of the test case at f =1 Hz, a = 5 mm (see Table2) is because the magnitude of the measured force is very small with respect to the measure-ment range of the load cell.
6.2 Influences of thickness ratio
Figure6 shows the variations of the added mass (A0) and damping coefficient (B0) of the plates with different thickness ratios with respect toKC. The range of thickness ratio (td=D) considered here is from 0.01 to 0.4. As shown in Fig.6a, for all the considered thickness ratios, A0 increases asKCincreases. The influences of thickness ratio onA0is more significant in the highKCregion than that in the lowKCregion. Figure6b shows the results ofB0for the plates with different thickness ratios. As shown in Fig. 6b, the damping coefficientB0increases asKCincreases for all the considered thickness ratios. The thinnest plate A1 among the 12 plates provides the highest value of B0. Similar to the feature ofA0, the influences of thickness ratio onB0is more significant in the highKCregion than that in the low KC region. [15] investigated the flow regimes around an oscillating plate with a sharp edge based on the axis-symmetric numerical simulations, and three vortex shedding patterns, i.e., independent, interactive and uni-directional, are observed. The mechanism of the flow (a)
(b)
Fig. 5 Comparison of theaadded mass andbdamping coefficients
[image:7.595.52.289.60.404.2]regime is found to be dependent on the thickness ratio of the disk andKCnumber. As shown in Fig.6, a large range of thickness ratio is investigated here; therefore, it is not easy to obtain a representative conclusion on the influence of thickness ratio on the added mass and damping coeffi-cient of plates. It is noted that the results ofA0for the plates A1–A8 follow one similar trend while the results ofA0for the rest plates follow the other similar trend. For the damping coefficientB0, the results of plates A1–A6 follow one similar trend while the results for the rest plates follow the other similar trend. Therefore, it appears that the variation features ofA0andB0with respect toKCshould be discussed, respectively, for the ‘‘thick’’ and ‘‘thin’’ plates. Based on the experimental results shown in Fig.6, the critical value of the thickness ratio for defining the ‘‘thick’’ and ‘‘thin’’ plates is between 0.05 and 0.075. Generally, for the ‘‘thin’’ plates, A0 decreases as the thickness ratio increases; for the ‘‘thick’’ plates, A0 increases as the thickness ratio increases. The ‘‘thick’’ plates provide more added mass in the region of KC.0:5 while the ‘‘thin’’
plates provide more added mass in the region ofKCJ0:5. As shown in Fig. 6b, for the ‘‘thin’’ plates,B0decreases as the thickness ratio increases; for the ‘‘thick’’ plates, the influence of thickness ratio on B0 is not significant. It is noted that the plate A1 which is the thinnest plate in the 12 test plates provides the maximum damping. This is con-sistent with the finding by [16] that the thinner plate could provide more damping.
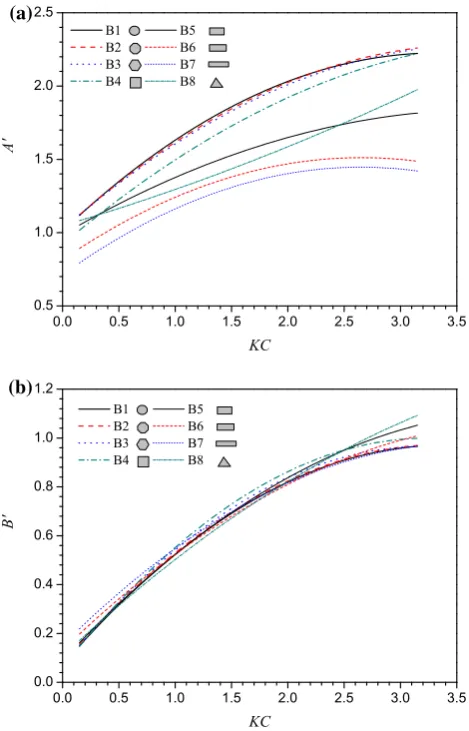
6.3 Influences of plate shape
Figure7 shows the variations of the added mass (A0) and damping coefficient (B0) of the plates with different shapes with respect to KC. For visual convenience, the geometry of the plates (plates B1–B8 in Table1) is included in Fig.7. Eight typical plate shapes are considered here, i.e., circular (B1), octagon (B2), hexagon (B3), square (B4), triangle (B8) and three rectangle plates with different width/length ratios (B5–7). As shown in Fig.7a, except the rectangle plates B6 and B7,A0for the rest plates increases (a)
(b)
Fig. 6 Results of theaadded mass andbdamping coefficients of the
plates with different thickness ratios
(a)
(b)
Fig. 7 Results of theaadded mass andbdamping coefficients of the
[image:8.595.52.288.57.424.2] [image:8.595.308.543.58.424.2]as KC increases. It appears that the results of A0 for the circular (B1), octagon (B2) and hexagon (B3) plates are very close, whileA0for the rest plates is lower than that for the plates B1–B3. For the rectangle plates,A0decreases as the width/length ratio of the plate decreases. It is concluded that the fully filled shapes like circular, octagon and hexagon could provide more added mass than the less filled shapes. As shown in Fig.7b,B0of the plates with different shapes are very close in the region ofKC.2:5. It appears that the influence of shape on the damping coefficient is not as significant as that on the added mass.
6.4 Influences of edge corner
Figure8 shows the results of the added mass coefficient (A0) and damping coefficient (B0) of the plates with dif-ferent edge corners with respect to KC. Here, the plate models are the circular plate with a thickness of 10 mm and a diameter of 200 mm, giving a thickness ratio of 0.05. According to the discussion in Sect.6.2, the plates are the
‘‘thin’’ plates. Apart from the sharp edge plate C1, the edges of rest three plates C2–C4 are rounded with different radii, i.e., r¼1;3;5 mm, respectively. As shown in Fig.8a, the effect of corner radius onA0is significant, i.e., the plate with sharper edges provide more added mass. As shown in Fig.8b, for the cases atKC\1, the influence of edge corners on B0 is not significant; for the cases at KC[1, the sharper the plate edge is, the higherB0 is.
6.5 Influences of porosity
In this section, the influences of porosity on the hydrody-namic coefficients of the plates are considered. Here, we evaluate two parameters, i.e., the porosity ratio and the perforated hole size.
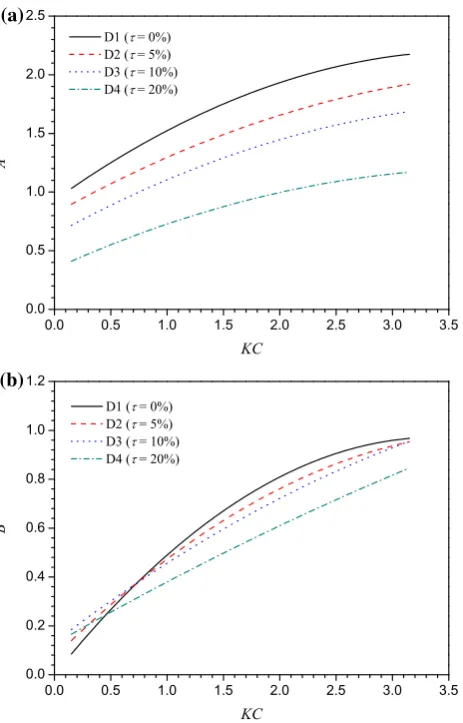
6.5.1 Influences of porosity ratio
Figure9 shows the results of the added mass coefficient (A0) and damping coefficient (B0) of the plates with (a)
(b)
Fig. 8 Results of theaadded mass andbdamping coefficients of the
plates with different edge corner radii
(a)
(b)
Fig. 9 Results of the a added mass and b damping coefficients
[image:9.595.51.288.52.418.2] [image:9.595.312.544.57.419.2]different porosity ratios at different KC. As shown in Fig.9a, A0 decreases significantly as the porosity ratio increases. The added mass coefficient for the plate with 20% porosity is about 40%–60% lower than that for the solid plate. As shown in Fig.9b, for the cases at low KC numbers, i.e.KC.0:6, the perforated plates appear to provide more damping compared with the solid plate, and the perforated plate with medium porosity (around 10%) would provide the highest damping. However, for the cases atKCJ0:75, the solid plate provides more damping.
It is noted that the results of A0 and B0 in Fig.9 are calculated using the nominal area (A) of the perforated plates, rather than the actual area. In Fig.10, the force coefficients are recalculated using the actual area of the plates. As shown in Fig.10a, even based on the actual area of the plate, the added mass coefficient still decreases as the porosity ratio of the plate increases. However, as shown in Fig.10b, for the damping coefficient calculated based on the actual area of the plate, the damping coefficient increases as the porosity ratio increases for a givenKC.
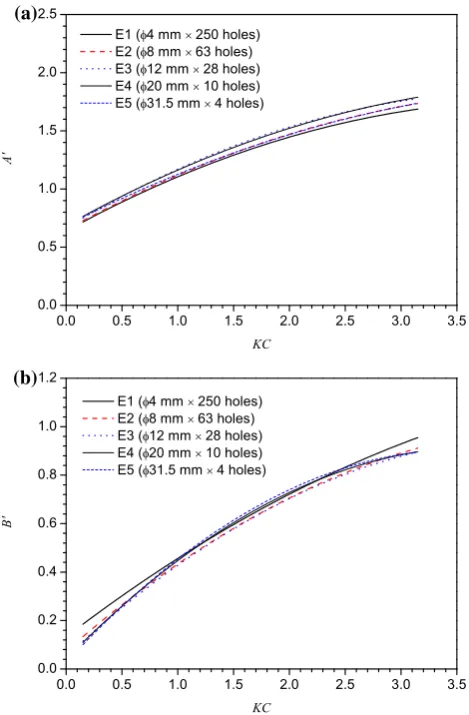
6.5.2 Influences of perforated hole size
Figure11 shows the results of the added mass coefficient (A0) and damping coefficient (B0) of the plates with dif-ferent perforated hole sizes. The five plate models con-sidered here are of the same porosity ratio 10%. As shown in Fig.11, the influences of perforated hole size on the added mass and damping coefficients are not significant. It appears that the added mass coefficient of a perforated plate is mainly dominated by the porosity ratio rather than the hole size.
6.6 Influences of plate spacing
In this section, we consider the configuration of multiple plates arranged in axial alignment. In this case, the hydro-dynamic coefficients may be influenced by the spacing between the plates, which is denoted as l. Limited by the capacity of the test facilities, the twin-plate and triplet-plate configurations are considered here, respectively. The (a)
[image:10.595.53.287.57.416.2](b)
Fig. 10 Results of the a added mass and b damping coefficients
calculated using on the real area of the plates
(a)
(b)
Fig. 11 Results of theaadded mass andbdamping coefficients of
[image:10.595.308.543.58.416.2]influences oflon the added mass and damping coefficients of the plates are investigated.
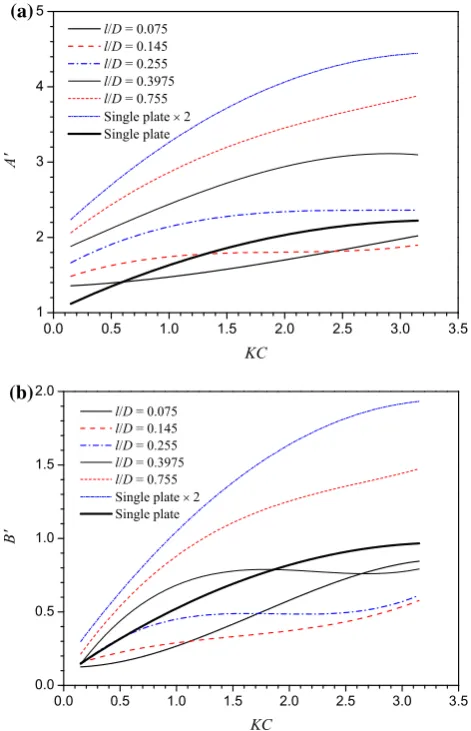
6.6.1 Twin-plate configurations
Figure12shows the influences of the spacing between twin plates on the added mass coefficient (A0) and damping coefficient (B0) at different KC numbers. For the conve-nience of comparing the hydrodynamic coefficients of twin plates with those of a single plate, the results of the single plate is also plotted in Fig.12. Moreover, the line denoted by ‘‘Single plate2’’ in Fig.12represents the results of the single plate magnified by a factor of two. As shown in Fig.12a, A0 of the twin plates increases asKC increases. However, compared with the single plate, the added mass coefficient of the twin plate is not doubled. It is strange to find that, when the spacing is very small (e.g., l=D¼0:075;0:145), the added mass coefficient of twin
plates at a largeKCnumber is lower than that of the single plate. This is because the hydrodynamic characteristics of the twin plates with very small spacing is similar to those of a thick plate. It has been concluded in Fig. 6a that, in largeKCnumber regions,A0of a ‘‘thick plate’’ is generally lower than that of a ‘‘thin plate’’. As shown in Fig.12a, as l increases, the twin plates are no longer be treated as a ‘‘thick plate’’. The influences of the thickness ratio start to give way to the influences of the plate–plate interactions. The added mass of twin plates appears to increase as the spacing between the plates increases. It is noted that for the spacing as large as l=D¼0:755, the deduction effect of multi-plate interactions still exists, even though A0 of the twin plates has been significantly increased compared with the single plate. As shown in Fig.12b, the influences of lonB0for the twin-plate configuration is similar to that on A0. The damping coefficient of twin plates at small spacings is close to that of a single thick plate. For the large spacing configurations, the suppression effect of the multiple plates decreases as the spacing increases. It is interesting to note that, compared with the case l=D¼0:145,B0 of the con-figuration l=D¼0:075 is lower in the region ofKC\1:2 and higher in the region ofKC[1:2. This is because that, in the low KC region, the interaction between multiple plates is relatively weak and the damping coefficient of twin plates increases as the spacing increases. However, as KCincreases, the hydrodynamic characteristics of the twin plates become approximately equivalent to that of a single thick plate. Therefore, the smaller the spacing l is, the larger the damping coefficient B0is.
6.6.2 Triplet-plate configurations
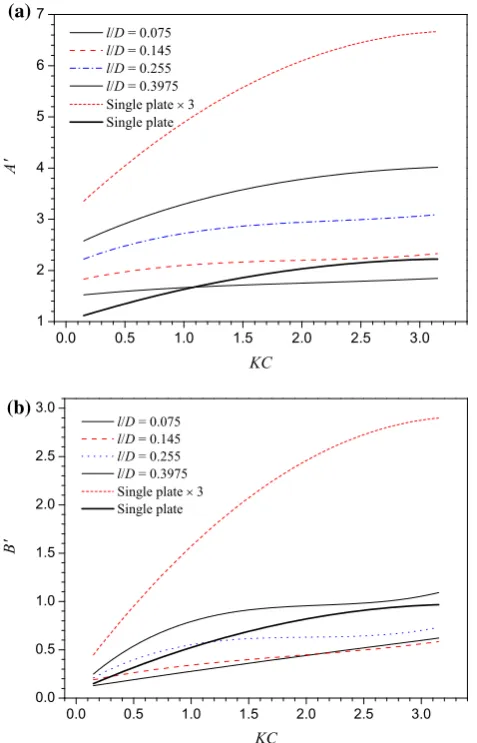
Figure13 shows the influences of the spacing between triplet plates on the added mass coefficient (A0) and damping coefficient (B0) at differentKC numbers. Similar to Fig.12 for the twin-plate configuration, the results of the single plate are also shown in Fig.13. Moreover, the line denoted by ‘‘Single plate ’’ 3 in Fig.13 represents the results of the single plate magnified by a factor of three. Due to the limitation of the test tank size, the maximum spacing for the triple plates is l=D¼0:3975. As shown in Fig. 13a, for the small spacing configuration (l=D¼0:075), the result of A0 is lower than that of a single plate in the low KC region, and is higher that of a single plate in the highKCregion. Similarly, as shown in Fig.13a, B0 of the triplet plates at small l configurations is lower than that of a single plate. Moreover, as l in-creases, the interaction between the triplet plates becomes weaker, the added mass and damping coefficients of the triplet plates increases.
(a)
[image:11.595.52.288.59.425.2](b)
Fig. 12 Results of theaadded mass andbdamping coefficients of
7 Conclusions
The hydrodynamic characteristics of an isolated plate with different geometries are investigated with a forced oscil-lation test. TheKCnumber considered here is in the range of 0:156KC63:15. The influences of thickness ratio, shape, edge corner, porosity ratio and the perforated hole size on the added mass (A0) and damping (B0) coefficients of the plate are evaluated. Moreover, the influences of the spacing between multiple plates are also investigated with the twin-plate and triplet-plate configurations, respectively. The main conclusions are drawn as follows:
– The variation features ofA0andB0 with respect toKC should be discussed, respectively, for the ‘‘thick’’ and ‘‘thin’’ plates. The critical value of the thickness ratio for defining the ‘‘thick’’ and ‘‘thin’’ plates is between 0.05 and 0.075. For the ‘‘thin’’ plates,A0 decreases as
the thickness ratio increases; for the ‘‘thick’’ plates,A0 increases as the thickness ratio increases. The ‘‘thick’’ plates provide more added mass in the region of KC.0:5 while the ‘‘thin’’ plates provide more added mass in the region ofKCJ0:5. For the ‘‘thin’’ plates,B0 decreases as the thickness ratio increases; for the ‘‘thick’’ plates, the influence of thickness ratio onB0is not significant.
– The nearly fully filled shapes like circular, octagon and hexagon could provide more added mass than the less filled shapes. The influence of shape on the damping coefficient is not as significant as that on the added mass.
– A0 and B0 are influenced by the edge corner of the plates. The plate with sharp edges could provide more added mass and damping than the plates with round corners.
– The added mass of the plate decreases with the porosity of the plate. The medium porosity (around 10%) could provide more damping when KC.0:6, and the solid plate provides more damping when KC[0:75. The damping coefficient calculated based on the actual area of plate increases as the porosity increases for a given KC. For a given porosity ratio, the influences of the perforated hole size onA0andB0 are not significant. – The added mass and damping of the multiple-plate
configurations are significantly influenced by the spac-ing between the plates. The configuration of the plates with a small spacing is approximately equivalent to the case of a single thick plate. For the configurations with a large spacing, the interaction between multiple plates becomes weaker as the spacing increases.
In summary, the influences of various geometry factors on the hydrodynamic characteristics of oscillating plates are investigated via a forced oscillation test. The conclusions drawn here and the data presented in this paper are of significance for the engineering applications of flat plates. However, it should be noted that the tests in this study were carried out only for the isolated plates. In engineering applications, the hydrodynamic coefficients of heave plates may also be influenced by some other factors, such as the large structural components near the heave plate and free surface effect. Therefore, in case of the heave plate installed close to the column of platform or free surface, the experimental data presented in this study are not applicable. Additional investigations should be carried out to evaluate the influence of these factors.
Acknowledgments This work was supported by the Shanghai Yang
Fan Program (Grant No. 15YF1406100), the National Natural Sci-ence Foundation of China (Grant No. 51509152) and the Newton Research Collaboration Programme (Grant No. NRCP/1415/211). (a)
[image:12.595.52.291.59.431.2](b)
Fig. 13 Results of theaadded mass andbdamping coefficients of
References
1. An S, Faltinsen OM (2013) An experimental and numerical study of heave added mass and damping of horizontally submerged and perforated rectangular plates. J Fluids Struct 39:87–101 2. Downie M, Graham J, Hall C, Incecik A, Nygaard I (2000) An
experimental investigation of motion control devices for truss spars. Mar Struct 13:75–90
3. He H,Troesch AW, Perlin M (2008) Hydrodynamics of damping plates at small KC numbers, In:IUTAM Symposium on Fluid-Structure Interaction in Ocean Engineering, Springer. pp. 93–104 4. Holmes S, Bhat S, Beynet P, Sablok A, Prislin I (2001) Heave plate design with computational fluid dynamics. J Offshore Mech Arct Eng. 123:22–28
5. Lake M, He H, Troesch A, Perlin M, Thiagarajan K (2000) Hydrodynamic coefficient estimation for TLP and Spar struc-tures. J Offshore Mech Arct Eng 122:118–124
6. Li J, Liu S, Zhao M, Teng B (2013) Experimental investigation of the hydrodynamic characteristics of heave plates using forced oscillation. Ocean Eng 66:82–91
7. Magee A, Sablok A, Maher J, Halkyard J, Finn L, Datta I (2000) Heave plate effectiveness in the performance of truss Spars. Proceedings of the ETCE/OMAE2000 Joint Conference. ASME, New Orleans, LA, USA, pp 1–11
8. Molin B (2001) On the added mass and damping of periodic arrays of fully or partially porous disks. J Fluids Struct 15:275–290
9. Prislin, I., Blevins, R., Halkyard, J.,1998. Viscous damping and added mass of solid square plates, in:Proceedings of the 17th International Conference on Offshore Mechanics and Arctic Engineering, ASME,Lisbon, Portugal
10. Sarpkaya T, Isaacson M (1981) Mechanics of wave forces on offshore structures. vol. 96. Van Nostrand Reinhold Company, New York
11. Shen W, Tang Y, Liu L (2012) Research on the hydrodynamic characteristics of heave plate structure with different form edges of a spar platform. China Ocean Eng 26:177–184
12. Tao L, Cai S (2004) Heave motion suppression of a spar with a heave plate. Ocean Eng 31:669–692
13. Tao L, Dray D (2008) Hydrodynamic performance of solid and porous heave plates. Ocean Eng 35:1006–1014
14. Tao L, Molin B, Scolan Y, Thiagarajan K (2007) Spacing effects on hydrodynamics of heave plates on offshore structures. J Fluids Struct 23:1119–1136
15. Tao L, Thiagarajan K (2003a) Low KC flow regimes of oscil-lating sharp edges I. Vortex shedding observation. Appl Ocean Res 25:21–35
16. Tao L, Thiagarajan K (2003b) Low KC flow regimes of oscil-lating sharp edges II. Hydrodynamic forces. Appl Ocean Res 25:53–62
17. Thiagarajan K, Datta I, Ran A, Tao L, Halkyard J (2002) Influ-ence of heave plate geometry on the heave response of classic spars. In: Proceedings of the 21st International Conference on Offshore Mechanics and Arctic Engineering, ASME, Oslo, Norway
18. Thiagarajan K, Troesch A (1998) Effects of appendages and small currents on the hydrodynamic heave damping of TLP columns. J Offshore Mech Arct Eng 120:37–42