Rochester Institute of Technology
RIT Scholar Works
Theses Thesis/Dissertation Collections
5-1-2012
The Development of nanomaterials for high
performance lithium ion battery anodes
Roberta DiLeo
Follow this and additional works at:http://scholarworks.rit.edu/theses
This Dissertation is brought to you for free and open access by the Thesis/Dissertation Collections at RIT Scholar Works. It has been accepted for inclusion in Theses by an authorized administrator of RIT Scholar Works. For more information, please contactritscholarworks@rit.edu.
Recommended Citation
i
THE DEVELOPMENT OF NANOMATERIALS FOR HIGH
PERFORMANCE LITHIUM ION BATTERY ANODES
By
ROBERTA A. DILEO
A DISSERTATION
Submitted in partial fulfillment of the requirements For the degree of Doctor of Philosophy
in
Microsystems Engineering at the
Rochester Institute of Technology
May 2012
Author: _________________________________________________________________
Microsystems Engineering Program
Certified by: _____________________________________________________________
Dr. Brian J. Landi Assistant Professor of Chemical and Biomedical Engineering
Approved by: ____________________________________________________________
Bruce W. Smith, Ph.D. Director of Microsystems Engineering Program
Certified by: _____________________________________________________________
ii
NOTICE OF COPYRIGHT
© 2012
Roberta A. DiLeo
REPRODUCTION PERMISSION STATEMENT
Permission Granted
TITLE:
“The Development of Nanomaterials for High Performance Lithium Ion Battery Anodes”
I, Roberta A. DiLeo, hereby grant permission to the Wallace Library of the Rochester Institute of Technology to reproduce my dissertation in whole or in part. Any reproduction will not be for commercial use or profit.
iii
The Development of Nanomaterials for High Performance Lithium
Ion Battery Anodes
By
Roberta A. DiLeo
Submitted by Roberta A. DiLeo in partial fulfillment of the requirements for the degree of Doctor of Philosophy in Microsystems Engineering and accepted on behalf of the Rochester Institute of Technology by the dissertation committee.
We, the undersigned members of the Faculty of the Rochester Institute of Technology, certify that we have advised and/or supervised the candidate on the work described in this dissertation. We further certify that we have reviewed the dissertation manuscript and approve it in partial fulfillment of the requirements of the degree of Doctor of Philosophy in Microsystems Engineering.
Approved by:
Dr. Brian J. Landi
(Committee Chair and Dissertation Advisor) Date
Dr. Ryne P. Raffaelle
Dr. Denis Cormier
Dr. Seth Hubbard
Dr. Alan Raisanen
Dr. Esther Takeuchi
MICROSYSTEMS ENGINEERING PROGRAM ROCHESTER INSTITUTE OF TECHNOLOGY
iv
ABSTRACT
Kate Gleason College of Engineering
Rochester Institute of Technology
Degree Doctor of Philosophy Program Microsystems Engineering__
Name of Candidate ____Roberta A. DiLeo_________________________________
Title The Development of Nanomaterials for High Performance Lithium Ion Battery Anodes
Many industries spanning macro to micro applications need advanced energy storage capabilities and Li+
batteries are the prevalent technology to meet those demands. High Li+ capacity semiconductor materials
(e.g. Si, Ge) in concert with carbon nanotubes (CNTs) have been investigated as alternative materials for
Li+ batteries. Nanomaterials offer many advantages to high performance batteries by increasing storage
capacities, Li+ diffusion, and more adequately accommodating volumetric expansion that occurs in
cycling. Silicon and Ge are known to have very high Li+ storage capacities of 4200 and 1600 mAh/g,
respectively, and can be used in combination with CNTs to form free-standing anodes. The proper incorporation of semiconductor materials onto and throughout a CNT network through thin film, solution processing, and gas-phase processing techniques, has been studied to develop ultra-high capacity free-standing electrodes. Given the free-free-standing nature, the removal of binders and metal foil current collectors contributes to an increased electrode energy density over conventional composites on metal substrates. The CNT and semiconductor materials have been characterized in coin and pouch cells upon identifying the synthesis parameters and processing steps to be optimized for several of the incorporation techniques. Anodes fabricated through PVD techniques realize capacities over 800 mAh/g and a predicted >50% increase in energy density over conventional graphite anodes. The use of thin film Ti
contacts on high energy Ge-SWCNT anodes demonstrates a 5-fold improvement in Li+ capacity at 1C
extraction rates, a drastic improvement in the anode power capabilities. Pairing these electrodes with a
high power cathode LiFePO4 can lead to a 60% improvement in power and energy density. A
3-dimensional network of Ge nanoparticles (Ge-NPs), Si and CNTs demonstrates capacities of 1000 and 2000 mAh/g with modest cycling capabilities up to 1C and first cycle coulombic efficiencies of 88%. The performance of these novel anodes in full cells with commercially available cathodes realized electrode-pair energy densities over 300 Wh/kg, while current technologies have energy densities of 150
– 200 Wh/kg. This work demonstrates the combination of high Li+
capacity Si and Ge with highly conductive CNTs in a balanced high energy and high power anode for lithium ion batteries with a 2x improvement in cell energy density.
Abstract Approval: Committee Chair _______________________________________
Program Director _______________________________________
v
ACKNOWLEDGMENTS
I would like to acknowledge the sponsored research programs in support of my research funded at the NanoPower Research Laboratories (NPRL) by Lockheed Martin, the Department of Energy (DE- FG36-08 GO88110), and the United States Government. Also, I would like to specifically acknowledge the PhD fellowship funded through the US Department of Education, Graduate Assistance in Areas of National Need (GAANN) Program, Professor Bruce Smith, and RIT Microsystems Engineering [Grant Number P200A090225].
I would like to thank the following committee members for their support during this work:
Dr.Ryne Raffaelle Dr. Seth Hubbard Dr. Denis Cormier
Dr. Alan Raisaenen Dr. Esther Takeuchi
I wish to thank my colleagues for their contribution toward the efforts of my work:
NPRL Staff & Students Dr. Cory Cress
Mr. Chris Schauerman Mr. Matt Ganter
Ms. Sarah Frisco Ms. Melissa Thone SMFL Staff
I have a wealth of gratitude for my adviser Dr. Brian Landi who counseled me for eight years in the ways of having arête in my pursuit of research. His motivation and
perspective have been tremendous examples and I am thankful for his diligent mentoring of a person, not just a graduate student.
vi
TABLE OF CONTENTS
I. INTRODUCTION ... 1
A. LITHIUM ION BATTERIES &STORAGE MECHANISM ... 1
B. LITHIUM ION BATTERY COMPONENTS ... 3
C. OPPORTUNITIES IN LITHIUM ION BATTERIES ... 11
II. APPROACH TO HIGH POWER & HIGH ENERGY DENSITY ANODES ... 12
A. HIGH CAPACITY SEMICONDUCTOR MATERIALS ... 12
B. NANOMATERIALS ... 12
C. FREE-STANDING ELECTRODES ... 13
D. DISSERTATION OVERVIEW ... 15
III. EXPERIMENTAL PROCEDURES ... 20
A. CARBON NANOTUBE SYNTHESIS ... 20
B. CHARACTERIZATION TECHNIQUES ... 23
C. EXPERIMENTAL METHODS ... 24
IV. THIN FILM EVAPORATION ... 29
V. LOW RESISTANCE CONTACTING ... 38
VI. SOLUTION PROCESSING ... 55
VII. GAS-PHASE PROCESSING ... 63
A. CVDNANOPARTICLE SYNTHESIS ... 63
B. LOW PRESSURE CVD ... 72
C. PLASMA ENHANCED CVD ... 79
VIII. ANODE SUMMARY ... 84
IX. FULL CELL IMPLEMENTATION ... 86
A. FIRST CYCLE LOSS,SURFACE AREA, AND COULOMBIC EFFICIENCY CONSIDERATIONS ... 86
B. ELECTRODE STABILITY: ELECTROCHEMICAL AND MECHANICAL ... 95
C. FULL CELL CALCULATIONS ... 98
D. FULL CELL DEMONSTRATIONS ... 103
X. CONCLUSIONS ... 112
APPENDIX A: NICKEL CONTACTING ON HYBRID ANODES... 116
APPENDIX B: GERMANIUM THIN FILM ON GE-NP:SWCNT ANODES... 118
vii
LIST OF FIGURES
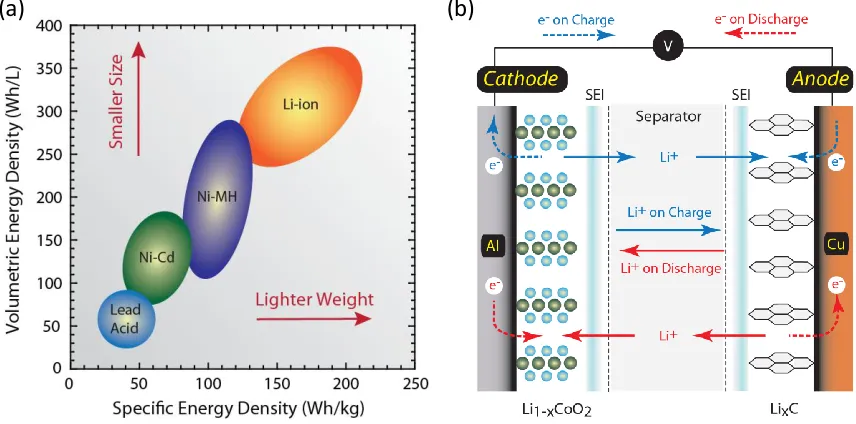
Figure 1 (a) Volumetric and specific energy density of many conventional electrochemical storage chemistries. Lithium ion batteries outperform other battery chemistries from both a volumetric and specific energy density perspective. (b) Schematic of the storage and charge/discharge mechanisms in a conventional lithium ion battery comprised of a metal oxide cathode vs. graphitic anode. Charge is indicated by blue arrows and discharge is indicated by red arrows for the electrons and the ions [3]. ... 1 Figure 2 (a) Diagram depicting the lithium ion capacity and electrochemical reduction
potentials with respect to lithium metal for conventional cathode materials (blue axis) and anode materials (red axis). The cathode materials are color coordinated by chemistry type; metal oxides (blue), phosphates (red) and orthosilicates (orange) [3]. Scanning electron micrographs of germanium thin films on copper (b) before cycling and (c) after eight cycles. The thin film shows cracking and delaminating after eight cycles. ... 5 Figure 3 (a) First cycle voltage profile of SWCNT electrodes vs. lithium metal. A
material comparison shows significantly higher reversible capacity for the purified electrode. The modification of the electrolyte shows an increased reversible capacity with the use of DEC over DMC. The regions of reversible and irreversible capacity are indicated by the gray and yellow shaded regions, respectively [3]. A schematic of (b) an electrode as the SEI layer forms (c) and continues to grow over prolonged cycling to form a thick film. ... 9 Figure 4 Schematic of cathodes paired with (a) conventional MCMB anodes on copper,
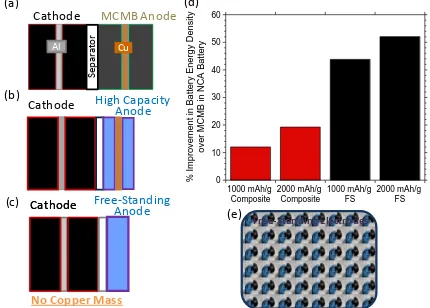
(b) high capacity anode materials on copper, and (c) high capacity materials in a free-standing anode. (d) Percent improvement in energy density over state of the art technologies replacing MCMB with high capacity materials and replacing a composite on copper with a free-standing anode, all paired with a LiNiCoAlO2. (e) Free-standing carbon nanotube anode. ... 14 Figure 5 Schematic representations of the different deposition or incorporation techniques
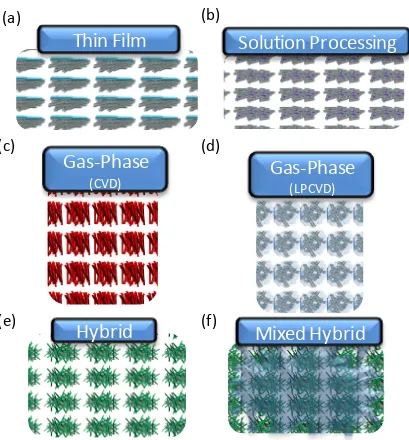
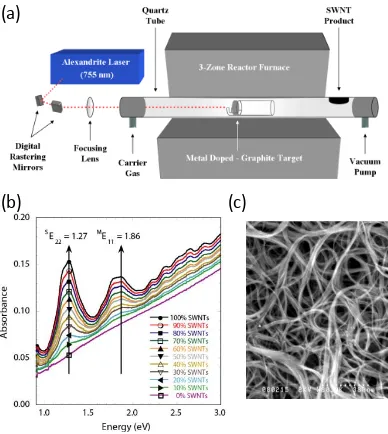
used for this work: (a) thin film deposition of semiconductor mateirlas through evaporation creating a bi-layer structure, (b) in situ solution processing to form semiconductor particles within a network, (c) gas-phase synthesis of semiconductor nanoparticles through a CVD process, (d) semiconductor materials deposited through a CVD process to cover the surface and partially penetrate the network, (e) fabrication of hybrid structures by mixing post-synthesized nanoparticles within electrode network, and (f) a mixed hybrid which combines the hybrid of (e) with the CVD step of (d) creating a 3-D network that has surface coverage of semiconductor materials... 18 Figure 6 (a) Schematic of the laser vaporization reactor with the metal doped graphite
viii
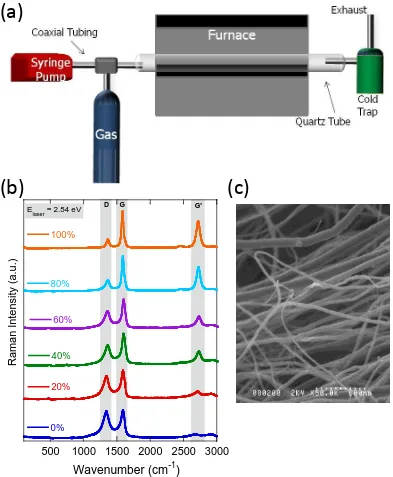
constructed sample set demonstrate the capability to assess purity through a simple spectroscopy technique. (c) Scanning electron microscopy image of purified SWCNTs at 80,000x. ... 21 Figure 7 (a) Schematic of the chemical vapor deposition reactor with the coaxial injection
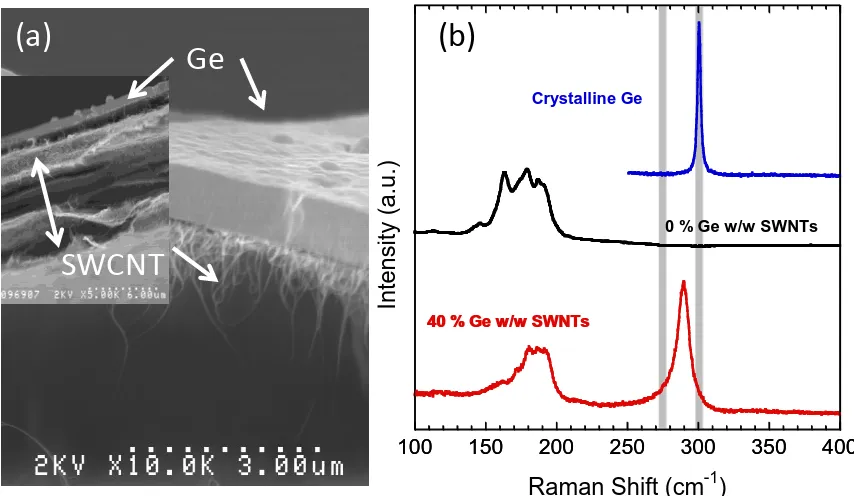
tip and syringe pump. (b) Raman spectroscopy curves of a constructed sample set of MWCNTs and carbonaceous impurities, used in a calibration curve to assess purity of MWCNTs. (c) SEM image of as-produced MWCNTS as 50,000x. ... 22 Figure 8 (a) Scanning electron micrograph of Ge-SWCNT anode at 10,000x. (b) Raman
spectra for crystalline germanium (blue), pure SWCNT electrode (black), 40 % w/w Ge-SWCNT electrode (red). The peak at 290 cm-1 in the 40 % w/w Ge-SWCNT spectrum is indicative of semi-crystalline germanium. Gray bars indicate 275 cm-1 and 300 cm-1 which are the characteristic peaks for amorphous and crystalline germanium, respectively. ... 30 Figure 9 Extraction (solid) and insertion (black) voltage profiles for the first cycle of the
(a) pure SWCNT electrode (solid line); (b) 10% w/w Ge-SWCNT electrode; (c) 20% w/w Ge-SWCNT electrode; and (d) 40 % w/w Ge-SWCNT electrode (dashed line). The electrochemical cycling was at a constant current of 74 mA/g with a 1 M LiPF6 EC:PC:DEC electrolyte mixture. ... 31 Figure 10 (a) First cycle extraction profiles for the series of Ge-SWCNT electrodes, 0 –
40 % w/w. The electrochemical testing was at a constant current of 74 mA/g. (b) Extraction capacities at 1.5 V for Ge-SWCNT anodes and predicted values of capacities for higher weight loadings of germanium... 32 Figure 11 Electrochemical cycling extraction capacities for first 10 cycles of the series of
electrodes at 74 mA/g. ... 34 Figure 12 First cycle voltage profile for full batteries. MCMB, SWCNT, and Ge-SWCNT anodes are paired with LiCoO2 cathodes and cycled at C/10 with respect to the anode. The green curve for the MCMB anode is the reduced useable capacity for the anode accounting for the mass of the metal foil current collector. The Ge-SWCNT anode demonstrates a energy density of 1600 Wh/kg versus 670 Wh/kg for the MCMB anode. ... 35 Figure 13 Modeling results for battery specific and volumetric energy densities for
MCMB batteries, the 40% Ge-SWCNT anode batteries, and theoretical values for an 80% Ge-SWCNT anode paired with LiCoO2, LiFePO4, and LiNiCoAlO2 cathodes.37 Figure 14 (a) First cycle insertion and extraction voltage profile for SWCNT electrodes
on a stainless steel cell (blue, 1,) titanium coated cell (green, 3,), and a nickel coated cell (red, 2,) at a current of 74 mA/g. (b) Cycling for the SWCNT electrodes on metalized coin cell cans at 74, 186, 372, 744, and 1860 mA/g. ... 39 Figure 15 Scanning electron micrographs at 20,000 x magnification of a) the interface
ix
the (b) 100 nm SWCNT-Ni electrode, and the (d) 100 nm SWCNT- Ti electrode. (e) The first cycle extraction for a SWCNT electrode (blue, 1), the 100 nm SWCNT-Ni electrode (green, 2), and the 100 nm SWCNT-Ti electrode (black, 3) at a current of 74 mA/g with a standard electrolyte of 1 M LiPF6 EC:PC:DEC. The capacity is a function of SWCNT mass only. ... 40 Figure 16 Scanning electron micrographs at 20,000 x magnification of (a) the interface
between coated and uncoated carbon nanotubes for the 500 nm SWCNT-Ti electrode and (b) SWCNT-Ti completely coated with titanium; (b) first cycle extraction for the total free-standing electrode mass for a SWCNT electrode (blue, 1), the SWCNT-Ni electrode (green, 2), and the SWCNT-Ti electrodes at thicknesses of 100 nm (black, 4) and 500 nm (red, 3) at a current of 74 mA/g with a standard electrolyte of 1 M LiPF6 EC:PC:DEC; and (c) the extraction for cycle 10 of the total free-standing electrode mass, at 74 mA/g... 43 Figure 17 (a) Lithium ion capacity as a function of cycle number for the SWCNT
electrode (orange,), the SWCNT-Ni (blue,), the SWCNT-Ti electrodes (100 nm - black,; 500 nm - red,), and a MCMB anode (green,) for five charge/discharge currents (74, 186, 372, 744, and 1860 mA/g) at 10 cycles for each current. (b) Maximum lithium ion capacity for each of the electrodes at a constant current with dashed-trend lines for figure clarity. ... 44 Figure 18 (a) The first cycle extraction for a SWCNT electrode (red) and a Ge-SWCNT electrode with a Ti thin film (blue) at a current of 74 mA/g with a standard electrolyte of 1 M LiPF6 EC:PC:DEC. (b) The differential change in capacity (dC/dV) as a function of voltage from 5 mV – 3 V; the axes are rotated to emphasize the correlation with the extraction voltage profile in (a). ... 46 Figure 19 (a) Lithium ion capacity as a function of cycle number for the Ge-SWCNT
electrodes without (red,) and with (blue,) titanium for five charge/discharge currents (74, 186, 372, 744, 1860 mA/g) at 10 cycles for each current. (b) Maximum lithium ion capacity for each of the electrodes at a constant current with dashed-trend lines for figure clarity. ... 47 Figure 20 Ragone plot with the calculations from the numerical model for the MCMB
anode (black,) and a Ge-SWCNT-Ti anode (red,) paired with a LiFePO4 cathode. The green and blue bands illustrate the typical range of values for two commercial lithium ion battery designs from A123 and Saft, respectively. Dashed lines for 0.1, 1, and 10 C rates are shown in gray. ... 50 Figure 21 Schematic for the energy levels of semiconducting and metallic SWCNTs, and
x
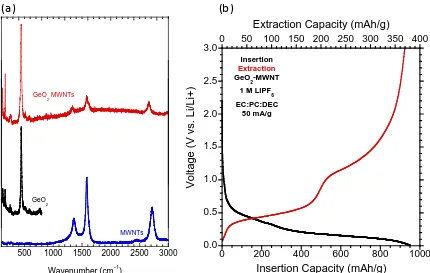
armchair nanotube (blue line) is from [88]. The metallic SWCNT pseudo gap data points and trendline (blue,) are from STM measurements [89]. The Ti and Ni work function values were obtained from the CRC Handbook of Chemistry and Physics. The value for stainless steel is from [87] and TiC from [94]. The hatched band extending from 1.1 – 1.5 nm depicts the diameter range of SWCNTs used for this work. ... 54 Figure 22 (a) Raman spectra from 100 – 3000 cm-1 for as-produced MWCNTs (blue),
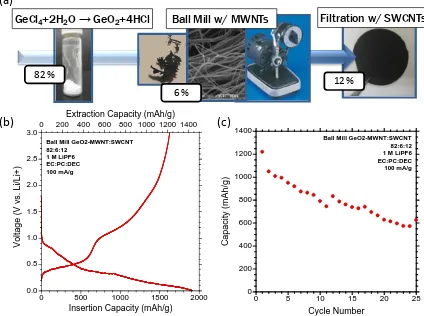
synthesized GeO2 particles (black), and the electrode fabricated from the mixture of the two constituents (red). (b) First cycle insertion (black) and extraction (red) for the GeO2-MWCNT electrode vs. Li at 50 mA/g. ... 57 Figure 23 (a) The fabrication of the electrode is depicted in images and chemical
formulas. The white GeO2 powder is synthesized according to the labeled reaction; followed by a ball-milling step with MWCNTs and then sonicated in a solvent with SWCNTs and filtered to form a free-standing paper. The respective mass ratio of each component is listed. (b) The first cycle insertion and extraction for the GeO2-MWCNT-SWCNT electrode vs. Li at 100 mA/g. (c) Cycling of the GeO2:MWCNT:SWCNT electrode at 100 mA/g, showing significant fade. ... 60 Figure 24 SEM Images of (a) Lithium-naphthalide reacted with GeCl4 in the presence of
SWCNTs at 130,000x, (b) and 25,000x; (c) Lithium-phenanthrene reacted with GeCl4 in the presence of SWCNTs at 15,000x, and (d) Lithium-naphthalide reacted with GeCl4 in the presence of MWCNTs at 15,000x. (e) First cycle extraction profiles for SWCNT electrodes in the presence of pyrene, lithium-naphthalide, and lithium-phenanthrene reacted with GeCl4 and MWCNT electrodes in the presence of lithium-naphthalide. (f) Cycling comparing the thin-film Ge-SWCNT electrodes from electron-beam evaporation to Li-Naphthalide-GeCl4-SWCNTs electrodes, which shows more stable cycling for a normalized capacity. . 61 Figure 25 SEM micrographs of carbon coated Ge-NPs at (a) 10,000 x and (b) 50,000 x
magnification and Ge-NP:SWCNT hybrid electrode at (c) 10,000 x and (d) 50,000 x magnification. ... 64 Figure 26 (a) XRD spectra using a Cu source and (b) Raman spectra using a 1.96 eV
excitation energy for the Ge-NP:SWCNT hybrid, the Ge-NPs, and commercially available Ge as a reference. ... 65 Figure 27 Electrochemical testing at 50 mA g-1 for the (a) insertion and (b) extraction of
xi
Figure 29 Electrode specific capacity of Ge-NP:SWCNT-Ti hybrid electrodes at two weight loadings, 75:15:10 (squares) and 80:10:10 (circles), at constant currents during insertion and extraction of 50, 100, 200, 500, 1000, and 2000 mA g-1. The first two cycles from 5 mV – 3 V and the subsequent cycles from 5 mV – 1 V. ... 70 Figure 30 (a) Discharge voltage profiles for a full cell composed of LiFePO4 cathode
opposite a (75:15:10) Ge-NP:SWCNT-Ti anode with a 1.2 M LiPF6 EC:EMC electrolyte at C/10 charge and C/10, C/5 and 1C discharge. (b) Cycling of the full cell for a selection of charge/discharge rates from C/10 to 1C. ... 71 Figure 31 Scanning electron microscope images of (a) SWCNTs and silicon deposited on
SWCNTs through LPCVD for (b) 5 minutes, (c) 15 minutes, and (d) 30 minutes at 25,000x magnification. ... 72 Figure 32 First cycle extraction voltage profiles for a series of Si-SWCNT electrodes.
The silicon was deposited through LPCVD for 5, 15, 20, 30, and 60 minutes. ... 74 Figure 33 Scanning electron microscope images of (a) germanium nanoparticles, (b) Ge-NP:SWCNT electrode, and (c) Si:Ge-Ge-NP:SWCNT electrode, showing the electrode surface morphology as the germanium and silicon are added to the SWCNT electrodes. ... 75 Figure 34 Raman spectra from 100-600 wavenumbers with 1.96 eV excitation energy for
SWCNTs, Si-SWCNTs, and Si-Ge-NP:SWCNTs. The pertinent bands are shaded in gray: SWCNT radial breathing mode at 150-200 cm-1, the germanium peak at 300 cm-1, and amorphous to crystalline silicon from 450 – 520 cm-1. ... 76 Figure 35 Second cycle extraction voltage profiles for a Si-SWCNT, a Ge-NP:SWCNT,
and a Si-Ge-NP:SWCNT electrode showing the varying extraction plateaus for the different electrodes. ... 78 Figure 36 Rate capability extraction voltage profiles up to 1.5 V for a Si-Ge-NP:SWCNT:Ti electrode, 28:67:12:3 weight loading. The first two conditioning cycles at 50 mA/g are followed by cycles with a constant insertion current of 100 mA/g as the extraction current is increased: 100, 200, 500, 1000, and 2000 mA/g. . 79 Figure 37 Representative SEM images of Si-Ge-SWCNT electrodes with the silicon
deposited by PECVD with a deposition of (a) 100 seconds, (b) 300 seconds, and (c) 500 seconds. (d) Raman spectra for the three electrodes show the progression of the silicon peak near 500 cm-1 growing to be the dominant peak as deposition time is increased to the extent at 500 seconds that more crystalline grains appear. ... 80 Figure 38 First and second cycle extraction voltage profile for three silicon weight
loadings, based on deposition time of 100, 300, and 500 seconds, on Ge-NP:SWCNT electrodes deposited through PECVD. The insertion and extraction current was 50 mA/g for all the electrodes. ... 82 Figure 39 Cycling capacities for the PECVD Si-Ge-NP:SWCNT electrode series at
xii
the first two cycles at 50 mA/g. The cut-off voltage was lowered from 3 to 1.5 V after the first two cycles. ... 83 Figure 40 Extraction curves for Si-SWCNTs vs. Li+ with 1.2 M LiPF6 EC:EMC
electrolyte (LPCVD technique) at 50, 100, 200, 500, 1000, and 2000 mA/g with cycling parameters of (a) insertion to 5 mV with matching insertion and extraction rates; (b) insertion to 50 mV with matching insertion and extraction rates; (c) insertion to 5 mV holding the insertion rate constant at 100 mA/g with varied extraction rates; (d) insertion to 50 mV holding the insertion rate constant at 100 mA/g after the first two cycles with varied extraction rates. ... 87 Figure 41 Insertion and extraction curves for a MCMB composite anode. The insertion
rate is varied from C/5 to 2C as the extraction rate is held at 2C; the extraction capacity degrades from 330 mAh/g at an insertion rate of C/5 to less than 50 mAh/g at an insertion rate of 2C. ... 89 Figure 42 First charge up to 4.3 V and discharge to 3.0 V for lithium-compensated
SWCNT anodes paired with NCA cathodes, and the corresponding current. (a) 1.5x and (b) 2x lithium associated with the SEI loss added to the anode with a constant voltage step to 50 % of the initial current results in a coulombic efficiency of 73 % and 80 %, respectively. ... 91 Figure 43 First charge to 4.3 V and discharge to 3.0 V for a lithium compensated
SWCNT anode paired with a NCA cathode. The corresponding current is on the second y-axis and the respective anode and cathode capacity is given on the x2-axis and the x1-axis, respectively. The cell has 2x excess lithium compensation with a constant voltage step to 10 % of the initial current, resulting in a first cycle coulombic efficiency of 83 %. ... 92 Figure 44 First cycle insertion and extraction for a SWCNT electrode with a coulombic
efficiency of 18 % and a Si-SWCNT electrode with a coulombic efficiency of 90 %. ... 93 Figure 45 First cycle insertion and extraction up to 5 V for (a) MWCNTs at 50 mA/g and
(b) SWCNTs at 74 mA/g. ... 96 Figure 46 First cycle insertion and extraction up to 5 V for Nanointegris carbon
nanotubes; purified, and type-separated metallic and semiconducting at 74 mA/g. . 97 Figure 47 DMA strength testing of conventional composites on copper, CNT electrodes
from Nanocomp and lithiated Nanocomp CNTs. The stress vs. strain curve indicates that lithiated CNT electrodes are comparable in strength to composites on copper and the untreated CNT electrodes are even stronger than the composite anodes. ... 98 Figure 48 Full cell energy density improvements calculated from a simple model for
xiii
Figure 49 Full cell discharge for a cell comprised of (a) LiFePO4 vs. Si-SWCNT in a 1 M LiPF6 EC:PC:DEC electrolyte and (b) NCA vs. Si-SWCNT in a 1.2 M LiPF6 EC:EMC electrolyte and capacity is with respect to the anode mass. ... 105 Figure 50 Full cell discharge for a cell comprised of (a) LiFePO4 vs. Ge-NP:SWCNT:Ti
overlaid with LiFePO4 vs. Si-Ge-NP:SWCNT:Ti in a 1.2 M LiPF6 EC:EMC electrolyte and (b) NCA vs. Si-Ge-NP:SWCNT:Ti electrodes with three different weight loadings ([9:78:12:1], [15:77:7:1], [10:80:8:2]) in a 1.2 M LiPF6 EC:EMC electrolyte where capacity is with respect to the anode mass. ... 107 Figure 51 Full cell discharge for a cell comprised of NCA vs. Si-Ge-NP:SWCNT:Ti with
the silicon deposited through PECVD methods. The discharge curves are for the first two cycles at a slow rate, 0.06C, and for two increasing discharge rates, 0.12C and 0.24C. ... 108 Figure 52 Electrode energy density for a selection of anodes paired with NCA cathode
based upon experimental electrochemical data. The full cells were capacity matched with 5-10 % excess cathode to probe the full capacity of the anodes. The energy densities compare LPCVD silicon cells with LPCVD hybrids, PECVD hybrids, and a control MCMB anode of various weight loadings... 111 Figure 53 SEM image of a 100 nm Ni contact on a Ge-NP:SWCNT anode at 50,000x
magnification. ... 116 Figure 54 (a) First cycle insertion and extraction and second cycle extraction for a Ge-NP:SWCNT anode with a 100 nm Ni contact at a constant current of 50 mA/g. (b) Cycling of a Ge-NP:SWCNT:Ni anode at 50 mA/g for the first two cycles up to 3 V and insertion at 100 mA/g up to 1.5 V with extraction currents of 100, 200, 500, 1000, and 2000 mA/g. ... 117 Figure 55 SEM images of 150 nm of electron-beam evaporated germanium on a Ge-NP:SWCNT anode at (a) 15,000x and (b) 50,000x magnification ... 118 Figure 56 (a) First cycle insertion and extraction at 50 mA/g of a Ge:Ge-NP:SWCNT
xiv
LIST OF TABLES
Table 1 Summary of the anode electrochemical performance (capacity, rate capability at 1C, coulombic efficiency, and cyclability) for the various materials and fabrication techniques ... 85 Table 2 Surface area and coulombic efficiencies for different electrode types suggesting
that surface area reduction contributes to an increase in coulombic efficiency for free-standing anodes. ... 94 Table 3 Material properties for the cathode chemistries used in the full battery pack
model calculations; density, voltage vs. Li/Li+, and specific capacity from published experimental results [6, 8] ... 99 Table 4 Volumetric energy density calculations for micropower batteries using high
1
I. INTRODUCTION
A. Lithium Ion Batteries & Storage Mechanism
The ever growing demand of the portable electronics industry, the electric vehicle
market, and storage for alternative energy sources has put energy storage devices at the
forefront of technological investigations [1, 2]. While there may be many ways to store
the intermittent power that is from alternative energy resources, the demands and
direction of progress of the portable electronic and electric vehicle industries relies
heavily on electrochemical storage devices, both batteries and supercapacitors. This
dependence on electrochemical storage devices and the need to shift toward higher
energy density and low mass devices has specifically focused research attention on
Figure 1 (a) Volumetric and specific energy density of many conventional
electrochemical storage chemistries. Lithium ion batteries outperform other battery chemistries from both a volumetric and specific energy density perspective. (b) Schematic of the storage and charge/discharge mechanisms in a conventional lithium ion battery comprised of a metal oxide cathode vs. graphitic anode. Charge is indicated by blue arrows and discharge is indicated by red arrows for the
electrons and the ions [3].
[image:16.612.122.550.370.582.2]2
lithium ion batteries. Figure 1a shows the performance of lithium ion batteries over
typical state-of-the-art (SOA) nickel-cadmium and nickel-metal hydride batteries, with
respect to specific energy density; this is attributed to the cells’ lighter weight and smaller
size for a given storage capacity because of the high storage capacity of the active
materials in comparison to other battery electrode chemistries [4].
Lithium ion batteries are rechargeable batteries that shuttle ions between the
cathode and anode on charge and between the anode and cathode on discharge, while the
current flows across the external load. Lithium ion electrodes are conventionally
intercalation materials where the lithium ions reside in between the layers and spaces in
the lattice structures of the host material. A material’s propensity to accept lithium ions
within its structure determines its storage capacity and viability as an electrode material.
Theoretical cell voltages can be estimated by the active materials for a given cell
composition, specifically the standard electrode potentials, where the oxidation potential
is the negative value of the reduction potential. The standard cell potential is the
difference between the anode oxidation potential and the cathode reduction potential.
The capacity of a cell is also determined by the active materials within the cell and is
expressed as a quantity of electricity involved in the reaction, designated as
ampere-hours. For example:
LiCoO2 +C6 LixC6 _ Li(1-x)CoO2
7.29 g/Ah + 2.68 g/Ah = 9.97 g/Ah or 100 Ah/kg
The theoretical energy of the cell in watthours is the product of the cell voltage and the
capacity in ampere-hours. However, the energy density of a cell is drastically reduced
3
Electrolyte, current collectors, separators, containers, and terminals are all necessary parts
of a battery that add weight but do not contribute to the energy output, thus lowering the
overall battery energy density [4, 5].
B. Lithium Ion Battery Components
The main constituents of lithium ion batteries are the cathode, the anode, and the
electrolyte/separator. The cathode is the positive electrode that is reduced during the
reaction, and the lithium ions are stored within the cathode when the cell is discharged.
Transition metal oxides have traditionally been the material of choice for cathodes used
in high energy density applications. The cathode Li CoO2, which today has a specific
energy of 165 Wh/kg and an open circuit voltage of 4.1 V, has more than doubled in
energy density since its adoption. However there is still focused interest to identify and
develop materials that increase the energy density further, while improving rate
capability and safety (a cause for concern with LiCoO2). There are several key qualities
of any good cathode material, namely, the cathode must allow for significant and stable
reversible intercalation of lithium ions; demonstrate low electron energy and site energy
for Li-ions; electrode potential should vary little with Li+ content; demonstrate fast
diffusion of electrons and Li+; stable over operating voltage range; low cost; lack of
toxicity; ease of synthesis and reproducibility; and favorable interface formed at contact
with electrolyte [4].
Different cathode chemistries, depicted in Figure 2a, have been investigated to
address many of these contributing factors, each offering unique advantages, but also
exposing possible drawbacks. Manganese oxide chemistries, LiNiO2, LiMnO2, and
4
capacity, as compared to the lithiated cobalt-oxide chemistry, is one disadvantage [6].
Vanadium oxide chemistries can exist in a variety of phases and have been used as
electrode materials as well. While they have high capacities, their voltages are typically
lower than the transition metal oxides, making them suitable for only certain applications
[4, 7]. In addition, novel phosphate chemistries have been developed and found suitable
for applications demanding higher power capabilities; LiMnPO4 and LiCoPO4 exhibit
higher open circuit voltages over metal oxide chemistries, in the range of 4.1 – 4.9 V [6].
In particular, LiFePO4 meets many of the criteria for effective cathode materials,
specifically its ability to cycle well at high current rates, its stability against overcharge
making it a much safer material, and its reduced production costs [8]. Another class of
materials currently under investigation for use in cathodes is fluorophosphates because of
their theoretically high cell potential. Compounds such as LiVPO4F have shown
promising results to act as storage materials and offer yet another cathode chemistry [8].
Finally, because of the successful results with the polyanionic phosphate materials,
silicates have also recently been studied as electrode materials with the general
composition of Li2MSiO4, where M is a transition metal [8, 9]. However, overall
silicates tend to be less electronically conductive and demonstrate a lower potential; so
any major scale-up of these materials would require doping of the particles or composite
forms with conductive additives.
The anode is the negative electrode that is oxidized during the battery discharge
reaction and where the lithium ions are stored when the cell is fully charged. The
evolution of lithium ion batteries from lithium batteries came about primarily from the
5
pure lithium metal. The low voltage versus lithium of a variety of carbonaceous
materials led to the investigation and use of graphite, carbon fibers, and meso carbon
microbeads (MCMB) as the active material in commercial anodes. Graphite materials
tend to be efficient intercalation materials, and the mechanism of storage that results in
the stoichiometry of LiC6 and a theoretical storage capacity of 372 mAh/g in these
materials is well understood [4, 5]. Additionally, carbon anodes have been an excellent
initial choice because of their high storage capacity, low cost, long cycle life, small
volume change of < 9 % upon lithiation, and negative reduction-oxidation
Figure 2 (a) Diagram depicting the lithium ion capacity and electrochemical reduction potentials with respect to lithium metal for conventional cathode materials (blue axis) and anode materials (red axis). The cathode materials are color coordinated by chemistry type; metal oxides (blue), phosphates (red) and orthosilicates (orange) [3]. Scanning electron micrographs of germanium thin films on copper (b) before cycling and (c) after eight cycles. The thin film shows cracking and delaminating after eight cycles.
After 8 cycles 50 um
50 um
(a)
(b)
[image:20.612.110.541.285.576.2]6
potential versus the cathode. In regards to lithium alloys, Group III, IV, and V elements
have been examined because of their ability to store lithium at low voltages (Figure 2a).
LiAl and LiSn systems were initially investigated and followed shortly by silicon because
it shows the highest possible gravimetric capacity over 4000 mAh/g [10]. Despite the
potential for high voltage batteries and large gravimetric capacities with these anode
materials there is limited large scale commercial use of these alloy materials. The
primary reason is because a large volumetric expansion is associated with each of these
elements upon lithiation ranging from 100 to 400 % depending on the specific material.
With an expansion that great during lithiation, the electrode easily cracks and delaminates
from the current collector rendering the battery ineffective, which can be seen in the
delaminating film in Figure 2b. Ongoing investigations into overcoming this problem
have lead to a variety of alternative anode fabrication methods including: high binder
content, thin film deposition, nano-sized particles, and alloy-carbon composites [11-13].
Each of these techniques is effective to some extent in mitigating the cracking and failure
that occurs due to expansion upon lithiation; cycle life has been extended to over
hundreds of cycles with retention of > 80 % initial capacity. However, problems still
arise with continuing electrolyte decomposition and the inability to fabricate a thick film
to make a commercially viable anode with an appropriate energy density. The drawbacks
associated with lithium alloys as anode materials have kept them as ideals with high
theoretical storage capacity but limited their use in applications. Ongoing studies to
mitigate these mechanical issues and employ their high energy, capacity, and safety
7
materials in composite structures with polymers or carbons to compensate for the lack of
film integrity [14].
The electrolyte and separator combination within a lithium ion battery is a key
component which requires some important considerations for optimal battery
performance. The ionic conductivity of the electrolyte should be high to reduce internal
cell resistance. In addition the stability of the electrolyte is an important factor in two
ways; 1) a high chemical stability prevents decomposition of the electrolyte on highly
reducing anodes or oxidizing cathodes, and 2) a large voltage window of electrochemical
stability as determined by the voltage difference between the cathode and anode
(typically > 4 V). Furthermore a low melting point and a high boiling point can provide
adequate conductivity and enhance the battery safety by preventing solidification of the
electrolyte and explosive reactions at high temperatures. Non-toxicity of the electrolyte
in terms of environmental concerns and ease of handling allow for the scale-up use of a
suitable material, and lastly, an electrolyte at an affordable cost as compared to other
power sources will aid in its commercial viability [5]. While a host of lithium salts exist,
most exhibit detrimental characteristics for battery performance (i.e. toxic side chemical
reactions in the solvents); lithium hexafluorophosphate (LiPF6), being the least damaging,
is widely used in electrolyte chemistries. Lithium bis(oxyalato)borate (LiBOB) is
another potentially effective salt, and along with LiPF6, used in concentrations of 0.4 to 1
M [15]. LiPF6 works well in a voltage range of 0 – 4.5 V because of its high
electrochemical stability, but its thermal stability raises concerns in addition to its
extreme sensitivity to water which can lead to the formation of hydrofluoric acid within
8
Organic carbonates are suitable and have been widely investigated in lithium ion
batteries; ethylene carbonate (EC), propylene carbonate (PC), dimethyl carbonate
(DMC), diethyl carbonate (DEC), ethyl methyl carbonate (EMC), and more recently
γ-butyrolactone (GBL) are commonly used electrolyte solvents, most often found in binary
or ternary solvent systems [16, 17]. Combinations of cyclic and linear carbonates
demonstrate enhanced performance, particularly at lower temperatures, over single
solvent electrolytes; this improved performance is attributed to the decrease in viscosity
as a linear carbonate is combined with a cyclic one [18].
Other electrolyte solutions have been studied as electrode chemistries have evolved
and performance demands have increased. Fluorinated carbonate electrolytes posses the
favorable properties of typical carbonates but also demonstrate lower melting points,
increased stability toward oxidation and favorable solid electrolyte interphase (SEI)
formation on carbon [19]. Ionic liquids, such as 1-ethyl-3-methylimidazolium
bis(fluorosulfonyl)imide (EMI-FSI), have also shown promising electrochemical
properties for their use as a ‘pure’ electrolyte for a carbon anode [20]. Additionally, ionic
liquids tend to be favorable for high voltage cathode cells because of their ability to
withstand oxidation/reduction at the higher voltages as compared to the organic solvents.
Selection of the electrolyte solvent and any co-solvents or additives must be considered
carefully in regard to the cathode and anode chemistry. The formation of a properly
functioning SEI layer from electrolyte decomposition is vital to battery performance and
many solvents are not compatible with every material. The protective layer that is
formed is electronically insulating, but ionically conductive allowing for proper battery
9
further electrolyte decomposition ensuring cyclability. Considering each of these factors,
many solvent combinations are possible and trade-offs must be considered; for example,
PC exhibits many favorable physical properties, but intercalation within graphite anodes
causes destruction by the formation of propylene gas leading to anode cracking and
exfoliation [21]. The study of SEI formation is a complicated investigation because of
the numerous components that potentially are formed and the selection of an appropriate
characterization technique to analyze the SEI constituents. However, regardless of the
electrolyte combination the SEI formation does lead to first cycle loss in a cell because of
the breakdown of the electrolyte and lithium to form the protective layer. The amount of
irreversible loss is very sensitive to the electrode surface and the electrolyte. Figure 3a
shows the voltage profile for a variety of carbon nanotube electrodes and how a large
portion of the first cycle capacity results in irreversible loss (yellow shaded region). The
SEI layer can also continue to grow after the first cycle if
10
the conditions at the surface are favored toward continued electrolyte breakdown Figure
3b and Figure 3c schematically show the growth of SEI as cycling continues, leading to a
complete film covering the active material. As the SEI layer continues to grow the cell
impedance increases which leads to a reduction in cell performance.
Another aspect of the battery composition that is closely related to the electrolyte is
the separator that electrically isolates the positive and negative electrodes. These are
often thin, 10 – 30 µm, microporous films of polyolefin materials. Separators must
demonstrate the following properties for use in commercial batteries: resistance to
puncture, effective pore size less than 1 µm, easily wetted by the electrolyte, resistance to
shrinking or yielding, high machine direction strength for automated winding, and
compatibility with the electrolyte and electrode materials. Polyolefin materials exhibit
these properties at an acceptable cost, and their low melting point allows them to act as a
thermal fuse. Polyethylene and polypropylene lose their porosity as their melting
temperatures of 135°C and 165°C, respectively, are approached, and the battery is unable
to function because of the closed electrical pathway to prevent thermal runaway [4].
Microporous films are necessary when liquid electrolytes are used within a cell; however,
studies have shown that polymer electrolyte-separators can function adequately within a
cell for many applications. These solid-state electrolytes do not require an additional
membrane for separation because when applied in a thin film they act as the necessary
barrier to electrically isolate the cathode and the anode. This field of study is continuing
to make progress in developing polymer electrolytes with adequate ionic conductivity for
11
C. Opportunities in Lithium Ion Batteries
The demand for smaller storage devices continues to grow, and there are ongoing
investigations into developing superior materials to meet the industries’ demands of small
and high performance devices. The development of batteries has progressed slowly
because of many obstacles posed by cost, safety, and environmental compatibility. In
addition, the development of robust high capacity materials is challenging, and today’s
current SOA chemistries have been nearly optimized and device performance is reaching
a plateau based upon engineering improvements; novel materials and design are
necessary to move beyond the SOA capabilities of lithium ion batteries. The potential to
improve battery performance lies in several areas of battery development, with active
materials and electrolyte chemistries being two with the biggest opportunities for growth.
Because each of these fields is enormous in their breadth, a detailed and thorough
investigation of any one specific area necessitates limiting the scope of study. This work
will focus on the development from synthesis to device testing of high storage capacity
nanomaterials for their use in lithium ion battery anodes to increase the energy and power
12
II. APPROACH TO HIGH POWER & HIGH ENERGY DENSITY ANODES
A. High Capacity Semiconductor Materials
A subset within the anode lithium alloy materials, Group IV semiconductors, has
been extensively studied because of the theoretical storage capacities of the materials;
silicon having the highest known capacity at 4200 mAh/g, followed by germanium with a
theoretical capacity of 1600 mAh/g [11, 22-24]. Similar to other alloying materials
mentioned previously, the progress toward widespread use of Group IV semiconductors
is inhibited by their lack of mechanical robustness, and investigations are ongoing to
develop different structures, composites, and deposition methods to increase cycle life for
these electrode materials [12, 23, 25, 26]. These materials, with 5 and 10x the capacity of
conventional graphitic anodes, present opportunities for large improvements in battery
performance if the challenges in volume expansion can be countered with novel
structures and electrode designs. It is necessary for improvements to be made in realizing
not just partial but the full storage capabilities of these high capacity anode materials
represented in Figure 2a in order for lithium ion batteries to meet the demands of the
automotive, electronic, and space industries.
B. Nanomaterials
Nanomaterials have been identified as a viable solution to implement high
capacity storage materials that are mechanically stable for long term cycling [27-29].
Nanomaterials also exhibit other properties that may be beneficial for use in
electrochemical storage. The small particle size decreases the electron diffusion
parameters potentially leading to increased rate capability; the high surface area also
13
also better accommodate the crystalline expansion during lithiation; and many
nanomaterials can offer enhanced mechanical support and electrical percolation within a
network. In particular, groups have shown the use of silicon and germanium nanowires
and nanoparticles to be effective storage materials for lithium ion batteries, realizing
storage capacities of 1000 mAh/g, more than three times that of SOA graphite [12, 25,
30]. Additionally, carbon nanotubes have been investigated as electrode materials in
traditional composite structures [31-33]. Predicted storage capacity for carbon nanotubes
with a LiC2 stiochiometry is 1116 mAh/g, a value much higher than graphite anodes, and
reports of capacities ranging from 400 to 1000 mAh/g have been realized for materials
through purification [32, 34-37], post-synthesis processing by ball milling [38],
optimization of electrolyte [34], and high temperature testing [39], with 1000 mAh/g
cited as the benchmark capacity for free-standing CNT anodes [40, 41]. From Meunier’s
work, it has been shown that preferential sites exist where lithium ions would be
positioned in a carbon nanotube and a bundle of CNTs giving rise to this high storage
capacity [42]. Carbon nanotubes also hold the potential to be used as both a storage
material and a current collector in a bi-functional design to create a free-standing
electrode.
C. Free-Standing Electrodes
There are several advantages to free-standing electrodes for lithium ion batteries; in
particular, they do not require the binder and metal substrate current collectors that
traditional slurry composites require. In addition, by using carbon nanotubes as the
mechanical support there is little necessity for conductive additives within the anode
14
travels. The most important advantage of free-standing electrodes is their reduction of
the cell mass, resulting in an increased energy density. Figure 4a depicts the scenario of a
conventional MCMB anode coated on copper paired with a cathode; Figure 4b shows the
anode composite thickness reduction that can be realized with the use of high capacity
materials replacing MCMBs and the corresponding 10-20 % improvement in energy
density with the MCMB replacement is given in Figure 4d. The drawback to the
[image:29.612.112.542.277.585.2]schematic in Figure 4b is that despite the inclusion of a high capacity material there is
Figure 4 Schematic of cathodes paired with (a) conventional MCMB anodes on copper, (b) high capacity anode materials on copper, and (c) high capacity materials in a free-standing anode. (d) Percent improvement in energy density over state of the art technologies replacing MCMB with high capacity materials and replacing a composite on copper with a free-standing anode, all paired with a LiNiCoAlO2. (e) Free-standing carbon nanotube anode.
Free-Standing Electrodes
Cathode
MCMB Anode
0 10 20 30 40 50 60 1000 mAh/g Composite 2000 mAh/g Composite 1000 mAh/g FS 2000 mAh/g FS % I mp ro vem e n t in B a tt e ry E n e rg y De n s ity o ve r M CM B i n NC A B a tt e ry
High Capacity
Anode
Cathode
Cathode
Free-Standing
Anode
Cathode
15
still conductive additive, binder, and a current collector. Specifically in this design when
the anode composite is thinned to capacity match with the cathode the relative weight of
the anode composite to total electrode mass decreases, amplifying the inactive current
collector mass in the full cell. When the conventional composite on current collector is
replaced with a free-standing anode, pictured in Figure 4c, the full electrode is
contributing to the storage of the lithium and greater improvements of 40 and 50 % in
energy density over state of the art are predicted in Figure 4d. These calculations
assumed a MCMB anode with a density of 1.3 g/cm3, a 92 % weight loading of active
anode material, and a capacity of 350 mAh/g paired with a LiNiCoAlO2 cathode with a
density of 2 g/cm3, a 90 % weight loading, and a capacity of 185 mAh/g; the average
voltage of the cell was taken to be 3.5 V and the cathode and anode were areal capacity
matched with 10 % excess anode. The lightweight, flexible nature of the CNT
free-standing electrodes are also demonstrated by the image in Figure 4e.
D. Dissertation Overview
The broad goal of this research is to improve lithium ion battery energy and
power density by developing a free-standing anode with high specific capacity
materials incorporated within a nanoscale conductive network. Success of this goal
relies upon an understanding of how constituent materials affect device performance and
an understanding of materials synthesis and processing to optimize material quality and
ultimately improve device performance. The nature of this work required iteratively
synthesizing and characterizing material, testing electrochemical properties, identifying
the opportunities for better performing electrodes and returning to the synthesis and
free-16
standing electrodes has been adequately motivated by the potential advantages of each
element separately, so the major tasks of this work include identifying effective methods
of electrode fabrication and fabricating the electrodes to test their electrochemical
performance.
Initial demonstrations toward viability of a particular semiconducting material
within a CNT electrode can be determined through the straightforward method of thermal
evaporation, resulting in a thin film on top of the CNT electrode, pictured in Figure 5a.
The potential need for an effective 3-dimensional network motivates the investigations of
solution and gas-phase processing of germanium and silicon materials to incorporate
within the CNT electrodes. A three-dimenstional geometry could provide more
conductive pathways to enhance diffusion parameters, placing active materials in close
contact with the current collecting pathways. The nanoscale porosity of a
three-dimensional network could also accommodate the expansion during lithiation because of
the meso-pores inherently throughout the structure. Figure 5b is a representation of the
potential structure of semiconductors penetrating the CNT network with in situ solution
processing techniques. Alternative methods of gas-phase processing are also investigated
with the goal of creating additional 3-dimensional networks; Figure 5c is a representation
of nanoparticles that can be formed through chemical vapor deposition synthesis and
Figure 5d is a depiction of a low pressure chemical vapor deposition of semiconductor
material on a CNT electrode resulting in a conformal coating of the nanotubes.
Post-synthesis processing is also a viable option, where Figure 5e depicts a hybrid structure
formed through the mixing of nanoparticles after synthesis with CNTs to create a
17
CVD process creating a 3-dimensional network with a conformal coating throughout the
electrode.
The inclusion of high capacity semiconductors within a conductive carbon
nanotube network can improve the capacity of anodes and ultimately the energy density
of the batteries; however, to have a balanced cell of high energy and power density,
adequate measures must be taken to ensure capacity retention in high power applications
[43]. The investigation of the electrical network created by the CNTs is the primary
focus to achieve this balance. In particular, reducing the contact resistance of the CNT
electrodes with the battery terminal is an area where improvements can be realized.
Efforts to develop good electrical contact for CNT devices have been an area of
experimental and theoretical study in recent years [44-53], and thin film metal contacts to
establish low contact resistance have been studied for a variety of applications including
hydrogen storage, field emission devices, and in microelectronic devices for both
networks and individual nanotubes [45, 49, 54-65]. The prevalence for certain metals to
interact favorably with carbon nanotubes has been corroborated by electron microscopy
studies that probe the ‘wettability’ of several metals and determine their ability to adhere
and uniformly coat CNTs follows the trend of Ti > Ni > Pd > Fe > Al > Au [66-68].
Titanium and nickel were both shown to deposit in a conformal manner on
individual CNTs [66-68], and this is consistent with theoretical calculations which show
these two metals as highly favorable contacts for CNTs based upon the carbon nanotube
side-wall distortion, wetting theories, and surface energies [44, 46, 47, 49, 51, 52, 69, 70].
The utilization of a more favorable contact between the CNT electrodes and battery
18
variety of metal contacting schemes and their viability will be studied to determine which
[image:33.612.112.521.121.561.2]metals can provide a superior contact for CNT free-standing anodes.
Figure 5 Schematic representations of the different deposition or incorporation techniques used for this work: (a) thin film deposition of semiconductor mateirlas through evaporation creating a bi-layer structure, (b) in situ solution processing to form semiconductor particles within a network, (c) gas-phase synthesis of
semiconductor nanoparticles through a CVD process, (d) semiconductor materials deposited through a CVD process to cover the surface and partially penetrate the network, (e) fabrication of hybrid structures by mixing post-synthesized
nanoparticles within electrode network, and (f) a mixed hybrid which combines the hybrid of (e) with the CVD step of (d) creating a 3-D network that has surface coverage of semiconductor materials.
Solution Processing
Thin Film
Gas-Phase
(CVD)
Hybrid
Gas-Phase
(LPCVD)
Mixed Hybrid
(a)
(b)
(c)
(d)
19
The connecting theme between all the materials research in this work is the
ultimate enhancement of a full battery by exploiting the advantages of these high capacity
free-standing electrodes. Calculations have predicted the improvements of replacing
conventional MCBM composite anodes with these high capacity free-standing electrodes
when paired with several common cathode chemistries. The results suggest over 50 %
improvement in energy density depending on the particular cathode chemistry. The final
assembly of full batteries pairing conventional cathode composites with a variety of the
developed free-standing anodes will provide experimental support towards the viability
20
III. EXPERIMENTAL PROCEDURES
The experimental procedures for this work span a range of techniques from
material synthesis, to characterization, to device testing. The methods are grouped into
sections that most closely relate to one another in the context of the work, not necessarily
in sequential order of how experiments were completed.
A. Carbon Nanotube Synthesis
Single wall carbon nanotubes were synthesized through a laser vaporization
process and the schematic in Figure 6a shows the reactor setup [71, 72]. A nickel and
cobalt doped graphite target was vaporized by an alexandrite or a Nd:YAG laser under
synthesis conditions of 200 sccm argon gas flow at 760 torr at 1150 oC. The metal in the
as-produced SWCNT material was removed through an acid reflux and filtered on a
PTFE filter through multiple water and acetone washes to form a SWCNT paper. The
SWCNT paper was purified by a thermal oxidation step to an equivalent level of > 95 %
carbonaceous purity based upon previous reference materials for laser-synthesized
materials resulting in paper thicknesses of ~ 10 µm [71, 72]. The purity of the purified
SWCNTs is assessed by a calibration curve that was developed using the optical
spectroscopy measurements of a constructed sample set of relative 100 % SWCNTs
mixed in varying weight percent with 0 % SWCNTs-carbonaceous impurities, shown in
Figure 6b [71]. The carbon nanotube synthesis and purification methods used in this
work resulted in a distribution of carbon nanotube properties: whereby both metallic and
semiconducting SWCNTs are present with a distribution of chiralities and diameters over
21
electrode from the laser vaporization synthesis with bundles ~ 10 nm and no visible metal
catalyst particles or amorphous carbon.
The multi-walled carbon nanotubes used in this work were synthesized using an
injection chemical vapor deposition (CVD) reactor with a coaxial injection design,
Figure 6 (a) Schematic of the laser vaporization reactor with the metal doped
graphite target and the as-produced carbonaceous materials. (b) Absorbance curves of a constructed sample set demonstrate the capability to assess purity through a simple spectroscopy technique. (c) Scanning electron microscopy image of purified SWCNTs at 80,000x.
(a) (b)
100 150 200 250 300
Ra m a n In te n si ty (a .u .)
Raman Shift (cm-1) 1.96 eV 2.54 eV 161 181 164 179 (a) (b)
100 150 200 250 300
Ra m a n In te n si ty (a .u .)
[image:36.612.113.501.179.613.2]22
pictured in Figure 7a. The injection tip was fabricated using quartz capillary tubing (i.d.
1mm, o.d. 3 mm) encased in a stainless steel jacket. Material was synthesized at 850 ° C,
precursor concentration of 0.08 M, a gas flow rate of 0.75 l/min, and a precursor delivery
Figure 7 (a) Schematic of the chemical vapor deposition reactor with the coaxial injection tip and syringe pump. (b) Raman spectroscopy curves of a constructed sample set of MWCNTs and carbonaceous impurities, used in a calibration curve to assess purity of MWCNTs. (c) SEM image of as-produced MWCNTS as 50,000x.
500 1000 1500 2000 2500 3000 0%
Wavenumber (cm-1)
Ram
a
n
I
n
te
n
s
ity
(a
.u
.)
20% 80% 100%
60%
40%
D G G'
E
laser = 2.54 eV
(a)
[image:37.612.128.521.154.631.2]23
rate of 3.5 ml/h. Raman spectroscopy is used to assess the purity of the as-produced
MWCNTs based on a calibration curve developed from a constructed sample set of
relative 100 % MWCNTs and 0 % MWCNTs-carbonaceous impurities and the Raman
spectra of the constructed sample set is shown in Figure 7b [73, 74]. Figure 7c is a
representative SEM image of as-produced MWCNTs from the standard synthesis
conditions. The average nanotube diameter is 60 nm, with minimal metal catalyst residue
and amorphous carbon.
B. Characterization Techniques
Scanning electron microscopy was performed using a LEO EVO 50 microscope
(Zeiss) at a voltage of 10 keV or a Hitachi S-900 field emission microscope at a voltage
of 2 keV. Carbon tape was used to mount the samples for imaging for both instruments.
Raman spectroscopy was performed using a Jobin Yvon LabRam spectrophotometer with
an excitation energy of 1.96 eV. Samples were mounted on microscope slides using
double sided tape. A crystalline Ge wafer was used as a reference sample to identify and
characterize germanium peaks. XRD analysis was performed using a Bruker D2 Phaser
desktop x-ray diffractometer with a Cu or Co source. 100 mesh Ge powder from Sigma
Aldrich was included as a reference for the peak location of Ge powder.
Thermogravimetric analysis was performed on samples of ~1 mg ramped at 10 ºC/min
from 25 to 1000 ºC under a flow of air at a rate of 60 sccm with a TA Instruments 2950.
Surface area analysis was performed using the BET method on a NOVA 1000e Surface
Area and Pore Size Analyzer instrument, with 5-250 mg of test material giving a total
24
using a dynamic mechanical analyzer Q800 from TA Instruments with a constant pull
force of 0.1 N/min up to 15 N or until the sample failed by breaking.
Electrochemical testing of the electrodes was performed using 2016 or 2032 coin
cells prepared in an inert environment glove box. Varying electrolytes were used
throughout this work; typically 1 M LiPF6 (Sigma Aldrich) electrolyte solution in a
solvent mixture (1:1:2 by volume) of ethylene carbonate (EC), propylene carbonate (PC),
and diethyl carbonate (DEC) or a 1.2 M LiPF6 solution in EC and ethyl methyl carbonate
(EMC) (each purchased separately from Novolyte Technologies, Inc) (3:7 by volume)
unless otherwise stated. Galvanostatic cycling was performed with an Arbin Instruments
BT-2000 at 28 oC. Cells were cycled as several different currents across all of the
experimental procedures; the cycling rates for a given study are detailed in the relevant
discussion section. Rates are typically referred to by the actual current and in the cases
where rates are given in terms of C-rates, a convention is followed that a 1C rate is the
current necessary to fully discharge a cell in one hour for its given capacity.
C. Experimental Methods
Electron beam evaporation was used as one technique to deposit metals and
semiconductors on the CNT electrodes. Graphite crucibles were used to hold the source
materials and the thickness of the source material deposited was based upon the effective
thickness as measured using a quartz crystal oscillator at a base pressure of 10-6 torr.
Germanium was deposited in increased thickness to construct a series of weight loadings
at 10, 20, and 40 % germanium to SWCNT electrodes. Weight loadings beyond 40%
were not obtained because the mechanical integrity of the free-standing electrode became
25
germanium on the SWCNTs. Titanium and nickel were deposited by electron beam
evaporation on coin cell lids and the backside of the electrodes in thicknesses of 100 and
500 nm, to study the effects of low resistance contacts for free-standing electrodes. The
100 nm thick film was selected because it was able to provide a full covering of the
SWCNT electrode with the thinnest possible coating, and the selection of 500 nm was
chosen to investigate the effects of a thicker, conventional complete thin film contact.
Several methods were used to synthesize germanium nanomaterials through
solution chemistry techniques. Reactions were carried out as stated both in an empty
vessel and in the presence of CNT papers. For the reactions in the presence of CNT
papers, there was a soak step of 1 hour, 8 hours, or 16 hours. Germanium oxide powder
was formed by reacting germanium chloride with excess water and drying the powder at
120 ºC to remove any residual water. A 0.1 M NaBH4 solution was also reacted with
GeCl4 to directly reduce the germanium. After there was no visible reaction of the GeCl4
and NaBH4 the CNT paper was rinsed with additional water and dried at 120 ºC. CNT
papers were soaked in a mixture of GeCl4 and N,N-dimethyacetamide (purchased from
Sigma Aldrich), 1 mL and 4 mL respectively, at room temperature and 75 ºC; water or
NaBH4 was added to the mixture after a 16 hr soak. Lithium naphthalide was formed by
adding 420 mg of naphthalene (Sigma Aldrich) and 22 mg of lithium metal in 50 mL of
tetrahydrofuran (Sigma Aldrich) and letting the solution dissolve for 16 hours, when
there was a visible color change from clear to dark green. CNT papers were soaked in
lithium naphthalide before GeCl4 was added to react in the vessel. GeCl4 was added until
the green solution turned clear; the CNT paper was removed and dried at 120 ºC. Other
26
effectiveness with GeCl4. P