Abstract: Metal Matrix Composites (MMCs) are widely used in variety of engineering applications. The usage of aluminium based composites in modern automobile and aerospace sectors is enormous due to superior Mechanical properties as compared to other materials. In this investigation Taguchi and Response surface methodologies have been used to minimize the cutting force in turning of AA7068/TiC MMCs. The experiments are planned and executed according to central composite design technique on all geared lathe machine using TiCN-Al2O3 tool insert (KCP05). The process parameters used are wt. % of TiC, cutting speed, feed and depth of cut. The objective of this experiment is to optimize the process parameters and evaluate the effect of process parameters. A second-order mathematical predictive model has developed between the process parameters & cutting force based on response surface methodology (RSM). The conclusions of this experiment is give that the most influenced process parameter for cutting force is depth of cut (d) and is followed by wt.% of TiC. Precision is observed between the predicted values and experimental results; therefore, the evaluated model is fit to predict the cutting force in machining of AMMCs.
Index Terms: Cutting force, CCD Technique, RSM, TiCN-Al2O3.
I. INTRODUCTION
Aluminium based MMCs are vividly utilized in automotive manufacturing sectors, aircrafts, mineral processing sectors and other sectors. These are concentrating on best quality in the regard of surface finish and dimensional accuracy. cutting forces evaluation is very important role in various design fields such as contact deformation, friction, positional accuracy, heat and electrical current conduction, tightness of the joints. Therefore, cutting forces has been the theoretical and experimental investigations for many years. Various techniques are developed for measuring surface roughness for machined specimens ranging from simple stylus probe instrument to sophisticated optical techniques [1].
Aluminium based MMCs are fabricated through various methods i.e., powder metallurgy, stir casting, squeeze casting spray deposition and mechanical alloying [2]. From these techniques, stir casting is most commonly taken up to fabrication of MMCs [3].. Various reinforcements can be used for Al-MMCs, namely, TiC, SiC, Al2O3, B4C, TiB2, and
etc. In comparison Titanium Carbide (TiC) has low density,
Revised Manuscript Received on July 22, 2019.
P. Naresh, Ph.D. Research Scholar, Department of Mechanical Engineering, Jawaharlal Nehru Technological University Anantapur, Ananthapuramu, Andhra Pradesh, India.
Syed Altaf Hussain, Professor, Department of Mechanical Engineering Rajeev Gandhi Memorial College of Engineering & Technology, Nandyal, Andhra Pradesh, India.
B. Durga Prasad, Professor, Department of Mechanical Engineering, Jawaharlal Nehru Technological University Anantapur, Anantapuramu, Andhra Pradesh, India.
better thermal stability, corrosion resistance, and superior mechanical properties than SiC, Al2O3, B4C, TiB2 [4].
The machining properties of aluminium based MMCs were investigated by several investigators. Basavarajappa et al., Sai chaitanya kishore et al. studied the effects of cutting forces and surface finish in turning of Al6061/TiC and implied that the high cutting speed results reveals in reduction of surface finish and cutting forces [5], [6]. Biswajit das et al. studied the consequences of process parameters on surface finish of Al/Cu/TiC composites and discovered that there happens to be non-linear relationship amongst the cutting conditions and surface finish parameters [7]. Mahamani et al. Investigated the machining behavior on Al-5cu-TiB2 composites [8]. Birol et al. developed Al-TiC with various percentages of reinforcement by varying the temperature and found that Al3Ti particles were replaced by
TiC particles when the powder blend was heated above 800оC [9].
In spite of many investigations on machining of AA- based MMCs no researchers have studied the machining behavior of Al7068/TiC MMCs. In the present study, AA7068/TiC are fabricated using stir casting technique, at various weight fraction of reinforcement varied from 0 to 10 wt.% in steps of 2wt.% and investigated the effect of control parameters on cutting forces in the machining of AA7068/TiC MMCs.
II. MATERIALS&METHODS
In this study AA7068/TiC fabricated using stir casting at various weight fraction of reinforcement varied from 0 to 10 wt. % in steps of 2wt. %. The test specimens are prepared with a dia 22 mm and length 190 mm respectively.
III. EXPERIMENTALDETAILS
The experiments are planned and executed according to CCD. The control parameters considered in this study wt. % of TiC, V, f, d. The control parameters as shown in Table 1. During machining operation the cutting force (Fz) is observed
at each experimental run using klister lathe tool dynamometer model. The specification of a tool holder is PSBNR-2525M12 and the cutting tool insert is MTCCVD-TiCN-Al2O3 manufactured by the kenna metals.
The MTCCVD-TiCN-Al2O3 tools are exceptionally wear
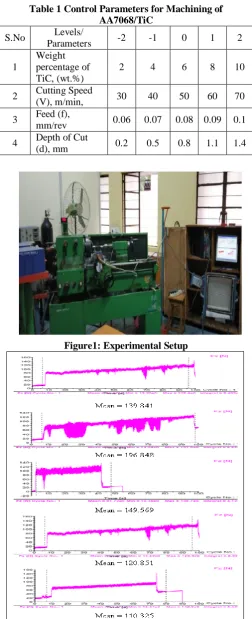
resistance compared to ceramic tools or tungsten carbide tools. The tool insert is SNMG120408. A snapshot of the experimental setup is shown in Figure 1.
Optimization of Cutting Force in Turning of AA
7068/TiC MMCs using Taguchi Technique
Form lathe tool dynamometer different cutting force with respect to various cutting speeds are observed the different trends as shown in Figure 3(i)–(v). The graphs have been taken at the end of machining time using the dynamometer.
Table 1 Control Parameters for Machining of AA7068/TiC
S.No Levels/
Parameters -2 -1 0 1 2
1
Weight percentage of TiC, (wt.%)
2 4 6 8 10
2 Cutting Speed
(V), m/min, 30 40 50 60 70
3 Feed (f),
mm/rev 0.06 0.07 0.08 0.09 0.1
4 Depth of Cut
(d), mm 0.2 0.5 0.8 1.1 1.4
Figure1: Experimental Setup
Figure 2: various cutting force with respect to various cutting speeds (i) 30m/min (ii) 40m/min (iii) 50m/min
(iv) 60m/min (v) 30m/min.
IV. RESULTS&DISCUSSION
Eexperiments are planned and executed according to CCD on on an all geared lathe and the experimental results are obtained as shown in Table 2.
A. Response Surface Methodology
RSM is a statistical measure of performance or quality for data analysis and prediction of optimal parameters setting [10], [11], that are useful for several problems and the aimed is to optimize this response. In various engineering applications, there is a affinity aimed an output variable of interest ‘y’ and a set of controllable levels {x1,x2……xn}, in
some systems, the nature of relationship amid y and x values might be known. Then, a model can be written in the form.
f
x
x
x
nY ( 1, 2... (1) Where ε represents noise in the response ‘y’
If we denote the expected response be E(Y) = f (x1, x2, ---Xn) =
Y
is called response surface. The first step is to find suitable approximation for the true functional relationship amid ‘y’ and set of individual parameters employed usually a quadratic is used in RSM.
j
j ij k
i i
i ii k
i i
iX X X
Y
1 2
1 0
(2)
To determine regression coefficients of the model for the cutting forces, MINITAB-18 software was used.
B. Taguchi’s S/N Ratios
Taguchi signal to noise (S/N) ratio is a statistical estimation of performance or quality for data analysis and prediction of optimal parameters setting [12], [13]. It depends on the quality characteristics of the process to be optimized. The standard S/N ratios generally used such as Nominal-is-Best, Smaller-the-better and Higher-the –Better. In this investigation, MINITAB-18 was used to solve the optimization problem. Cutting forces was taken as smaller is the best characteristic, aimed at minimizing the response [14]. The smaller-S/N ratio was computed as equation (3)
n
i
y
in N
S
1 2
1 log 10
[image:2.595.294.557.512.837.2]/ (3)
Table 2. Experimental results for cutting force and surface roughness
Sl.no Wt. %
Cutting Speed, m/min
Feed, mm/rev
Depth of Cut, mm
Cutting Forces,
Fz
S/N Ratio
1. 4 40 0.07 0.5 139.48 -42.89
2. 8 40 0.07 0.5 178.11 -45.01
3. 4 60 0.07 0.5 129.55 -42.24
4. 8 60 0.07 0.5 162.89 -44.23
5. 4 40 0.09 0.5 149.80 -43.51
6. 8 40 0.09 0.5 182.03 -45.20
7. 4 60 0.09 0.5 132.50 -42.44
8. 8 60 0.09 0.5 161.08 -44.14
9. 4 40 0.07 1.1 140.56 -42.95
10. 8 40 0.07 1.1 159.38 -44.04
11. 4 60 0.07 1.1 152.63 -43.67
12. 8 60 0.07 1.1 168.40 -44.52
13. 4 40 0.09 1.1 154.30 -43.76
15. 4 60 0.09 1.1 167.25 -44.46
16. 8 60 0.09 1.1 186.55 -45.41
17. 2 50 0.08 0.8 123.18 -41.81
18. 10 50 0.08 0.8 198.45 -45.95
19. 6 30 0.08 0.8 172.05 -44.71
20. 6 70 0.08 0.8 152.12 -43.64
21. 6 50 0.06 0.8 138.48 -42.82
22. 6 50 0.10 0.8 169.43 -44.57
23. 6 50 0.08 0.2 154.04 -43.75
24. 6 50 0.08 1.4 176.98 -44.95
25. 6 50 0.08 0.8 152.88 -43.45
26. 6 50 0.08 0.8 147.58 -44.45
27. 6 50 0.08 0.8 148.72 -42.26
28. 6 50 0.08 0.8 152.47 -43.47
29. 6 50 0.08 0.8 149.52 -42.89
30. 6 50 0.08 0.8 146.54 -42.80
31. 6 50 0.08 0.8 144.54 -43.45
Response surface methodology is adopted to analyze the test runs and the audience relation has been established acquired for cutting forces in uncoaded units as:
d f d V f V d Wt f Wt V Wt d d f f V V Wt Wt d f V Wt Fz * * 969 * * 275 . 2 * * 9 . 5 * .% * 08 . 6 * .% * 7 . 18 * .% * 0412 . 0 * * 7 . 42 * * 9513 * * 02984 . 0 .% * .% * 667 . 0 * 2 . 207 * 1310 * 32 . 4 .% * 87 . 7 323 (4)
C. ANOVA for cutting forces
Table 3 Anova Table for Surface Roughness Source DF Adj SS Adj MS F-Value P-Value Model 14 8664.45 618.89 22.96 0.000 Linear 4 6819.95 1704.99 63.25 0.000 Wt. % of TiC 1 5330.92 5330.92 197.76 0.000 V 1 137.52 137.52 5.10 0.038 f 1 807.24 807.24 29.95 0.000 d 1 544.26 544.26 20.19 0.000 Square 4 731.85 182.96 6.79 0.002 Wt. % of TiC*Wt.
% of TiC
1 203.29 203.29 7.54 0.014
V*V 1 254.58 254.58 9.44 0.007 f*f 1 25.88 25.88 0.96 0.342 d*d 1 421.66 421.66 15.64 0.001 2-Way Interaction 6 1112.65 185.44 6.88 0.001 Wt. % of TiC*V 1 10.84 10.84 0.40 0.535 Wt. % of TiC*f 1 2.23 2.23 0.08 0.777 Wt. % of TiC*d 1 213.23 213.23 7.91 0.013 V*f 1 5.61 5.61 0.21 0.655 V*d 1 745.43 745.43 27.65 0.000 f*d 1 135.32 135.32 5.02 0.040 Error 16 431.30 26.96
Lack-of-Fit 10 375.98 37.60 4.08 0.050 Pure Error 6 55.32 9.22
Total 30 9095.75
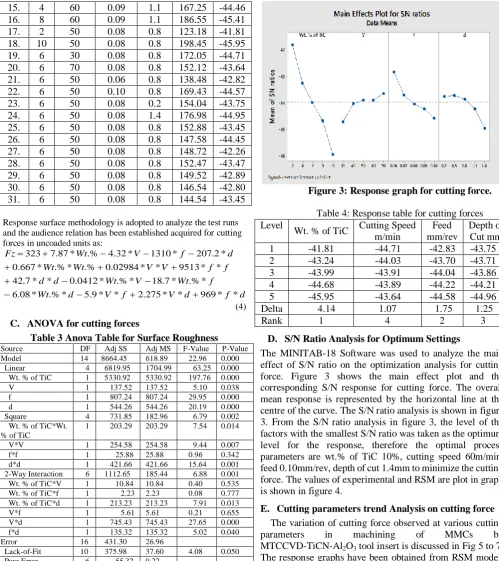
[image:3.595.44.544.54.616.2]ANOVA is is used to analyze the outputs to identify the factors that significantly affect the performance measure the total variance of the results. The ANOVA is done at α=0.05 significance level and gave results are cutting forces shown in Table 3.The sources with P-value < 0.05 are considered as highly statistically significant. The coefficient of determination R2 =95.20. Hence, the developed model is statistically significant. By observing table 4, weight percentage of TiC (wt.% of TiC ) is the most effected parameter followed by depth of cut, feed (f) and Cutting speed (V) on cutting force.
[image:3.595.40.299.54.261.2]Figure 3: Response graph for cutting force.
Table 4: Response table for cutting forces Level
Wt. % of TiC Cutting Speed m/min
Feed mm/rev
Depth of Cut mm
1 -41.81 -44.71 -42.83 -43.75
2 -43.24 -44.03 -43.70 -43.71
3 -43.99 -43.91 -44.04 -43.86
4 -44.68 -43.89 -44.22 -44.21
5 -45.95 -43.64 -44.58 -44.96
Delta 4.14 1.07 1.75 1.25
Rank 1 4 2 3
D. S/N Ratio Analysis for Optimum Settings
The MINITAB-18 Software was used to analyze the main effect of S/N ratio on the optimization analysis for cutting force. Figure 3 shows the main effect plot and the corresponding S/N response for cutting force. The overall mean response is represented by the horizontal line at the centre of the curve. The S/N ratio analysis is shown in figure 3. From the S/N ratio analysis in figure 3, the level of the factors with the smallest S/N ratio was taken as the optimum level for the response, therefore the optimal process parameters are wt.% of TiC 10%, cutting speed 60m/min, feed 0.10mm/rev, depth of cut 1.4mm to minimize the cutting force. The values of experimental and RSM are plot in graph is shown in figure 4.
E. Cutting parameters trend Analysis on cutting force
The variation of cutting force observed at various cutting
parameters in machining of MMCs by
MTCCVD-TiCN-Al2O3 tool insert is discussed in Fig 5 to 7.
Figure 4: Comparison of experimental values and predicted values for cutting force.
Figure 5: Variation of cutting force with cutting speed for different wt.% of TiC.
[image:4.595.48.292.431.758.2]By observing Figure 5, cutting force is reduces with the increases of cutting speed for various wt% of TiC at constant feed and depth of cut. High cutting forces were observed at low cutting speeds.
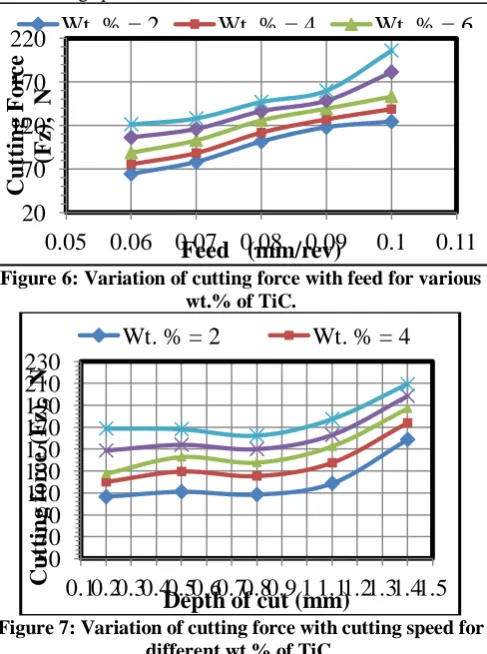
Figure 6: Variation of cutting force with feed for various wt.% of TiC.
Figure 7: Variation of cutting force with cutting speed for different wt.% of TiC.
From figure 6 it is inferred that high cutting forces are observed with increases of feed rate as compare to low feed
rates. Because of TiC particles are equally spread in matrix material.Figure 7 shows that the cutting forces increases with increases of depth of cut at more wt.% of TiC. At higher depth of cut and feed rate that the cuttings force increases6 and also observed that lower cutting forces observed at higher cutting speeds. In case of AA7068/2%Wt.% turning the cutting force is lower, science AA7068 is softer in nature (lower hardness) undergoes lower cutting force when compared to higher weight of TiC (10%).
V. CONCLUSION
1. AA-7068 / TiC MMCs are developed by using stir casting technique.
2. The effect of control parameters on the cutting forces has been appraised with the help of central composites design (CCD).
3. A quadratic model for cutting forces has been developed from the observed data. The predicted and measured esteems are genuinely near to each other which show that the cutting forces and prediction model can be adequately used for predicting the cutting forces within the range of process parameters selected in MMCs with 96.27% confidence level.
4. The experimental results indicated that low cutting forces were observed at 10% weight fraction of TiC. 5. RSM is found to be more effective for modeling and
analysis of cutting forces in turning of MMCs composites at different combination of design variables such as wt. % of TiC, cutting speed, feed and depth of cut.
6. RSM reveals that low cutting forces are observed at 10 weight percentage of TiC.
7. The optimal combination of control parameters for the cutting force weight percentage of TiC (wt.% of TiC) = 10wt. %, cutting speed (V) = 70m/min, feed (f) = 0.06mm/rev and the depth of cut (d) = 0.8mm.
REFERENCES
1. K.Rajkumar, P.Rajan and J. Marian Antony Charles, Procedia Engineering, vol 86, pp 34-41, 2014.
2. S.Sivasankarana, P.T. Harisagarb, E. Saminathanb, S. Siddharthb,P. Sasikumarb, Procedia Engineering 97, pp 582-589, 2014.
3. Bonollo F, Guemero R, Sentimanti E, Tangenni I and Yang V L, Material Science and Engineering, A 144, pp 303-310. 1991. 4. Morteza Alizadeh, Mostafa Alizadeh, Rasool Amini, Journal of
Materials Science & Technology, Volume 29, Issue 8, Pages 725–730, 2013.
5. S Basavarajappa1, G Chandramohan, K V Narasimha Rao, R Radhakrishanan, and V Krishnaraj, doi: 10.1243/09544054JEM304.Proceedings of the Institution of Mechanical Engineers, Part B: Journal of Engineering Manufacture July 1, vol. 220 no. 7 1189-1204, 2006.
6. D. Sai Chaitanya Kishore , K. Prahlada Rao , A. Mahamani , Investigation of cutting force, surface roughness and flank wear in turning of In-situ Al6061-TiC metal matrix composite Procedia Materials Science, Volume 6, , Pages 1040–1050, 2014.
7. Biswajit Das, Susmita Royb, R.N.Rai, S.C. Saha , Procedia Computer Science, Volume 45, Pages 745–752, 2015.
8. Mahamani, A., Machinability Study of Al-5Cu-TiB2 In-situ Metal
Matrix Composites Fabricated by Flux-assisted Synthesis. Journal of Minerals & Materials Characterization & Engineering, Vol. 10, No. 13, 1243-1254, 2011.
9. Birol, Y. In situ synthesis of Al-TiCp composites by reacting K2TiF6 and particulate graphite in molten aluminium. Journal of Alloys and Compounds, 454, 110-117, 2008.
10.Syed Altaf Hussain, Pandurangadu V,Palanikumar K, “Surface Roughness Analysis in machining of
50
100
150
200
250
20
30
40
50
60
70
80
C
ut
tin
g
for
ce
s
(F
z)
,
N
Cutting speed (m/min)
Wt. % = 2
Wt. % = 4
20
70
120
170
220
0.05 0.06 0.07 0.08 0.09
0.1
0.11
C
ut
tin
g
F
or
ce
(F
z)
,
N
Feed (mm/rev)
Wt. % = 2
Wt. % = 4
Wt. % = 6
50
70
90
110
130
150
170
190
210
230
0.1
0.2
0.3
0.4
0.5
0.6
0.7
0.8
0.9 1 1.1
1.2
1.3
1.4
1.5
Cut
tin
g
for
ce
(
F
z)
,
N
Depth of cut (mm)
GFRP Composites using Carbide Tool(K20), European journal of Scientific research, Vol.41 No.1, pp.84-98, 2010.
11.Syed Altaf Hussain, Pandurangadu V,Palanikumar K, Optimal Machining Parameters for Minimal Surface Roughness in Turning of GFRP Composites by PCD Tooling, IJAER, vol 5, issue 13, pp 2227-2239, 2010.
12.Syed Altaf Hussain, V.Pandurangadu, K.Palani kumar “Cutting power prediction model for turning of GFRP composites using response surface methodology”, International journal of Engineering, Science and Technology, vol.3,No.6, pp-161-171, 2011.
13.K.Palanikumar, “Appliaction of Taguchi and Response Surface Methodologies for Surfaceroughness in Machining Glass Fiber Reinforced Plastics by PCD Tooling”, International Journal of
Advanced Manufacturing
Technology,DOI:10.1007/s00170-006-0811-0, 2006.
14.Syed Altaf Hussain, V.Pandurangadu, K.Palani kumar “Machining parameters optimisation in turning of GFRP composites by desirability function analysis embedded with Taguchi method”, International journal of Engineering, Science and Technology, vol.17,No.2, pp-95-107, 2015.
AUTHORSPROFILE
P. Naresh, Ph.D research Scholar from JNTU Ananthapur under the guidance of Prof. Syed Altaf Hussain and Prof. B. Durga Prasad. Published a 30 research publications in repeated journals. His current area of research includes Mechanical, wear behaviour and machining behaviour of Aluminium based metal matrix composites, Optimization techniques and Modeling,
Dr. Syed Altaf Hussain, is a Professor and HOD / Mechanical Engineering, Rajeev Gandhi Memorial College of Engineering and Technology, Nandyal-518501, (A.P), India. He was graduated in mechanical engineering from REC Warangal, A.P and Post graduated with the specialization of machine design from JNTUCE Kakinada. He obtained Ph.D degree in faculty of mechanical engineering from JNTUA Ananthapur. He has 22 years of experience in teaching and published a more than 60 research publications in repeated journals. His current area of research includes Machining of composite GFRP and AMMCs materials, Modern manufacturing, Optimization, Simulation and Modeling, He is Executive Council Member of ISTE.