2007
Methods for Augmented Reality E-commerce
Yuzhu Lu Iowa State University
Follow this and additional works at:https://lib.dr.iastate.edu/rtd Part of theComputer Sciences Commons
This Dissertation is brought to you for free and open access by the Iowa State University Capstones, Theses and Dissertations at Iowa State University Digital Repository. It has been accepted for inclusion in Retrospective Theses and Dissertations by an authorized administrator of Iowa State University Digital Repository. For more information, please [email protected].
Recommended Citation
Lu, Yuzhu, "Methods for Augmented Reality E-commerce" (2007).Retrospective Theses and Dissertations. 15845.
by
Yuzhu Lu
A dissertation submitted to the graduate faculty
in partial fulfillment of the requirements for the degree of
DOCTOR OF PHILOSOPHY
Major: Human Computer Interaction
Program of Study Committee: Shana S. Smith, Major Professor
Frederick O. Lorenz Derrick J. Parkhurst
Viren R. Amin Julie A. Dickerson
Iowa State University
Ames, Iowa
2007
3289444
2008
UMI Microform
Copyright
All rights reserved. This microform edition is protected against unauthorized copying under Title 17, United States Code.
ProQuest Information and Learning Company 300 North Zeeb Road
P.O. Box 1346
Ann Arbor, MI 48106-1346
TABLE OF CONTENTS
LIST OF FIGURES iv
LIST OF TABLES vi
ABSTRACT vii
CHAPTER 1. GENERAL INTRODUCTION 1
CHAPTER 2. AUGMENTED REALITY E-COMMERCE SYSTEM: DEVELOPMENT AND USER STUDIES 10
Introduction 10
Background 11
VR in E-commerce 11
Moving from VR to AR 12
System and User Interface Design 14
Structure 14
Interfaces 16
Usability Study 19
Experiment Design 22
Experiment Participants 25
Results 26
Observations and Users’ Comments 38
Discussion and Conclusions 40
Reference 41
CHAPTER 3. A COMPREHENSIVE TOOL FOR RECOVERING 3D MODELS FROM 2D PHOTOS WITH WIDE BASELINES 44
Introduction 44
Epipolar Geometry 50
Methodology 52
Extracting Key Points 53
Feature Matching Using a Hierarchical Matching Algorithm 55
Human Interaction 60
Recovering 3D Information 60
Reconstructing the 3D object 65
Results 66
Conclusions and Discussion 67
Reference 68
CHAPTER 4. GPU-BASED REAL-TIME OCCLUSION IN AN IMMERSIVE AUGMENTED REALITY ENVIROMENT 72
Introduction 72
Bringing AR into a CAVE 78
Depth calculations and occlusion using GPU 80
Segmentation and Matching 83
Depth calculations and occlusions 84
Stream Processor and Reduction 85
Results 89
Discussion 90
Reference 91
CHAPTER 5. CASE STUDY 95
CHAPTER 6. CONCLUSION 102
APPENDIX A. E-COMMERCE APPLICATIONS COMPARISON 108
LIST OF FIGURES
Figure 1.1 Internet-generated revenue and Percentage of US adult online 2
Figure 1.2 An e-commerce web page for furniture 3
Figure 1.3 Augmented Reality 5
Figure 2.1 AR e-commerce assistant system working model 15
Figure 2.2 The structure of the AR e-commerce assistant system 16
Figure 2.3 User interface menu system 17
Figure 2.4 Product search interface 17
Figure 2.5 A virtual model in a real scene 18
Figure 2.6 A Big marker was used 19
Figure 2.7 Traditional e-commerce with three static 2D images 20
Figure 2.8 VR e-commerce with interactive 3D model 21
Figure 2.9 AR e-commerce interface 21
Figure 2.10 AR application running on a laptop computer 21
Figure 2.11 Office products 24
Figure 2.12 Participants’ self description 26
Figure 2.13 Interaction between type and location for Overall Evaluation 28
Figure 2.14 Interaction between type and location for Information Provided 31
Figure 2.15 Interaction between type and location for Easiness to use 34
Figure 2.16 Interaction between type and location for Confidence Level for Decision 37 Figure 3.1 Epipolar Geometry 51
Figure 3.2 Process of feature segment extraction 54
Figure 3.3 Process of background noise filtering 54
Figure 3.4 Hierarchical matching algorithm 56
Figure 3.5 First indices for P1 and P2 - relative position 57
Figure 3.6 Matching result comparison 59
Figure 3.7 Camera focal length analysis for 21 research studies 63
Figure 3.8 Several parameters were defined to evaluate the precision of recovered results 63 Figure 3.9 Reconstruction with texture mapping 66
Figure 4.1 Top view of occlusion in Augmented Reality 74
Figure 4.2 A portable one-wall BABY CAVE 79
Figure 4.3 Stereo cameras 80
Figure 4.4 Method structure 81
Figure 4.5 Preprocessing 83
Figure 4.6 Segmentation 83
Figure 4.7 The relative positions of the real and virtual objects 85
Figure 4.8 Occlusion 85
Figure 4.9 Examples of GPU reduction to calculate the centre of segmented layer 87
Figure 4.10 Results for the real-time GPU-based occlusion method 88
Figure 4.11 Occlusion with complicated geometry 89
Figure 5.1 2D images about the sofa 96
Figure 5.2 Correspondences of features of the sofa 96
Figure 5.3 Selecting triangles for the reconstructed sofa 96
Figure 5.4 Recovery interface 97
Figure 5.5 Recovered sofa in three views 97
Figure 5.6 Recovered sofa with textures 98
LIST OF TABLES
Table 2.1 Overall evaluation 26
Table 2.2 Tests of Between-Subjects Effects and Within-Subjects Effects (Dependent Variable: Overall evaluation) 28
Table 2.3 Homogeneous Subsets Tukey HSD (Dependent Variable: Overall evaluation) 28 Table 2.4. Information provided 29
Table 2.5 Tests of Between-Subjects Effects and Within-Subjects Effects (Dependent Variable: Information Provided) 31
Table 2.6 Homogeneous Subsets Tukey HSD (Dependent Variable: Information Provided) 31
Table 2.7 Ease of use 32
Table 2.8 Tests of Between-Subjects Effects and Within-Subjects Effects (Dependent Variable: Easiness to Use) 34
Table 2.9 Homogeneous Subsets Tukey HSD (Dependent Variable: Easiness to Use) 34
Table 2.10 User confidence level for decision 35
Table 2.11 Tests of Between-Subjects Effects and Within-Subjects Effects (Dependent Variable: User Confidence Level for Decision) 36
Table 2.12 Homogeneous Subsets Tukey HSD (Dependent Variable: User Confidence Level in Decision) 37
Table 3.1 Matching Experiment results 59
Table 3.2 Experiment results 64
Table 3.3 Recovered results 64
ABSTRACT
A new type of e-commerce system and related techniques are presented in this
dissertation that customers of this type of e-commerce could visually bring product into their
physical environment for interaction. The development and user study of this e-commerce
system are provided. A new modeling method, which recovers 3D model directly from 2D
photos without knowing camera information, is also presented to reduce the modeling cost of
this new type of e-commerce. Also an immersive AR environment with GPU based occlusion
is also presented to improve the rendering and usability of AR applications. Experiment
CHAPTER 1. GENERAL INTRODUCTION
Electronic commerce (e-commerce) is defined as the online exchange of goods, services,
and money within firms or between firms and their customers [1]. According to this
definition, there are two main kinds of e-commerce: business-to-business (B2B), and
business-to-consumer (B2C). Currently, e-commerce and online shopping are rapidly
progressing, because of the convenience that was made available with the development of
computer and internet technology as shown by the data from ActiveMedia (Figure 1.1),
which became common in most households within recent years. E-commerce and online
shopping make peoples’ lives easier, especially for individuals with disabilities and for others
who have difficulty engaging in onsite shopping. Amazon.com, Dell.com, and Ebay.com have
become a part of our lives. Lefebvre [2] argued that e-commerce is growing faster than
expected, and it is likely to have a dominant position in the future economy.
(b) Percentage of US adult online
Figure 1.1 Internet-generated revenue and Percentage of US adult online
However, according to our experiences, e-commerce and online shopping are still not
able to fully replace onsite shopping, especially for products like clothing, shoes, jewelry, and
furniture. For many products, onsite shopping has many distinct advantages when compared
to online shopping. One of the main advantages is that online shopping does not usually
provide enough information about a product for the customer to make an informed decision
before checkout. Onsite shoppers frequently engage in some sort of interaction with their
potential purchase to discover the scent, texture, appearance, and/or sound before buying it.
This experience is often impossible with online purchases.
Cho, Im, and Hilts [3] conducted research to analyze sources and causes of online
shoppers’ complaints. Based on their research, the two biggest factors that caused complaints
were product- and customer service-related. The authors also found that, for online purchases,
there was a higher percentage of complaints about clothing and shoe products than about
other kinds of products because of the lack of additional information that onsite shopping
could have provided.
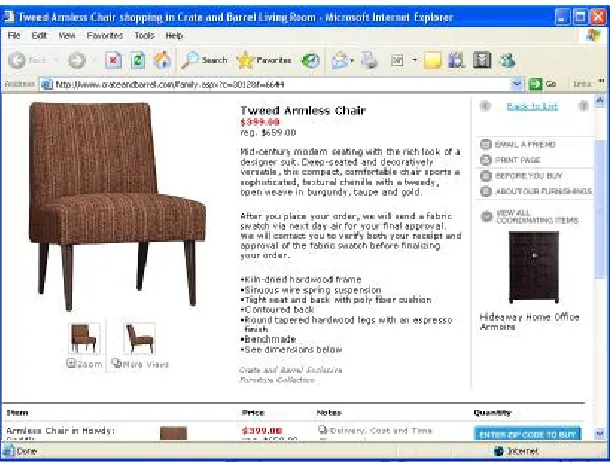
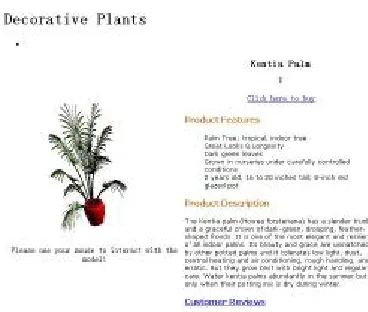
What kinds of information can traditional e-commerce systems provide for their
e-commerce example, a furniture website that provides some product-related information—
such as a picture, feature description, product details, and customer reviews—to give as much
information as possible to the customers. However, a picture and a description cannot always
provide enough information for consumers to make a good decision. Many times people only
have a rough idea about the size of a product from the information provided on the website
and finally find it too large after buying it. Also, customers may also have a difficult time
[image:12.595.159.465.263.495.2]deciding if a product’s color or design will match other objects in their home.
Figure 1.2 An e-commerce web page for furniture (source: crateandbarrel.com)
Generally, many products such as books, software, tickets, music, and computers are
suitable for online shopping because their features and related important information are easy
to gain from written descriptions. However, for others—like clothing, shoes, jewelry, and
furniture—people are more likely to prefer onsite shopping, because online shopping cannot
provide adequate information to customers. The development of e-commerce for products
like clothing, shoes, jewelry, and furniture is far behind what is needed in the e-commerce
world.
information so that customers could make proper buying decisions? Many researchers have
been using virtual reality (VR) in e-commerce to provide consumers with a new type of
mediated experience—a virtual consumer experience. “A virtual consumer experience is a
psychological and emotional state that consumers undergo when they interact with products
in a 3D environment or within intelligent agents” [4]. It has the potential to rich consumers’
experience [4]. Hughes, Brusilovsky, and Lewis [5] presented an adaptive navigation support
system for using a virtual environment for online shopping, to help ease the consumer’s
navigation and to help the consumer focus on important product features. They used some
detailed technologies—such as direct guidance, hiding, sorting, and annotation—for the
adaptive navigation. Cássia, and Fernando [6] presented an adaptive 3D virtual environment
with structure and content that changed according to the user’s interest and preference and
according to its application in e-commerce. They integrated intelligent agents, user models,
and automatic content categorizations together in their system. Chittaro and Ranon [7]
presented two design guidelines (massive and walking product) to improve the usability of
VR stores. The authors also analyzed and discussed how to apply the walking product to
personalized VR store for guidance. Their usability experiment results showed that the
“massive” did affect the shoppers’ purchasing of products, and that the “walking product”
significantly improved the shoppers’ convenience when finding a product [8]. Shen and
Georganas [9] presented a multi-user collaborative virtual environment system and described
application of the system in industry training and e-commerce. In their e-commerce system,
users could communicate with each other about the product. Bogdanovych, Berger, and
Simoff [10] focused on developing the social interface of VR e-commerce by combining
electronic institutions and virtual worlds to make use of their advantages. Communication
problems in their 3D electronic institution were analyzed and discussed as an important topic.
Virtual Reality Modeling Language (VRML), an animated virtual human was introduced. The
virtual human was to be used as a virtual shopping assistant for helping online shoppers
navigate through an e-commerce environment. The researchers used Quick 3D to generate
360-degree image-based backgrounds for immersion. Daugherty, Li, and Biocca [4]
conducted five experiments to study the usability of VR in e-commerce. Their results showed
that using their system designed for testing, users gained virtual experiences and acquired
significantly more information with their virtual experiences about the product than from
[image:14.595.223.397.305.416.2]their pre-existing indirect experiences.
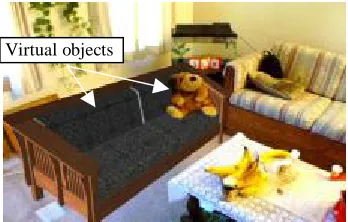
Figure 1.3 Augmented Reality
Although prior studies show that VR can enhance e-commerce by providing virtual
experiences and product interactions, VR technology can still only provide a virtual, not a
real, experience. It is important to provide consumers with “real experiences” and “real object
interactions”. Augmented Reality (AR) is a technology which aims to mix or overlap
computer-generated 2D or 3D virtual objects with the real world as shown in Figure 1.3.
Unlike VR, which replaces the physical world, AR enhances physical reality by integrating
virtual objects into the physical world. The virtual object becomes, in a sense, an equal part
of the natural environment. In recent years, many researchers have focused on AR
applications. In 2001, Azuma, Baillot, and Behringer [12] reviewed advances in AR, since
and interaction technologies. They indicated several problems that could be improved in the
future, such as occlusion, broader sensing, advanced rendering, and users’ perception issues.
However, there has been minimal research conducted regarding the use of AR to enhance
e-commerce.
There are two methods for tracking in existing AR research. The first method tracks
both the camera and the users, including their head directions and gestures. This tracking
method usually uses general tracking devices for indoor tracking and global positioning
system (GPS) for outdoor tracking. However, AR that uses tracking systems is not the best
solution to enhance e-commerce because it is inconvenient and most online shoppers can not
afford it. The other tracking method recognizes and tracks markers or objects in the real scene
by using computer vision and image-processing technology. Despite some limitations, this is
a feasible solution to be used for enhancing e-commerce and visually bringing the product
into online shoppers’ home. Zhang, Fronz, and Navab [13] compared four existing AR
marker systems—ARToolKit(ATK), Hoffman marker system (HOM), Institute Graphische
Datenverarbeitung (IGD), and Siemens Corporate Research (SCR)—based on usability,
efficiency, accuracy, reliability, and qualitative measures. From their experiment results, they
found that there was no marker system that was obviously better than the rest.
Among the limited research regarding the use of AR in e-commerce, Zhang, Navab, and
Liou [14] proposed a prototype direct marketing system that uses AR technology. Sales
people could use the system to show the main features of a product by manually holding a
plate with specially designed markers. A 3D virtual product mixed with a real scene could be
video taped and sent to interested customers by email. However the researchers’ method of
combining AR with e-commerce did not fully use the advantages of AR. With their method,
online shoppers would still not know whether a product was suitable for them and suitable to
Motivated by the need to enhance current e-commerce systems, chapter two of this
dissertation presents a new AR e-commerce system that “visually” puts a product model into
the online shopper’s physical environment and gives the customer a chance to “realistically”
interact with the product. A pilot user study and a formal user experiment were carried out.
Experiment results show that AR e-commerce is a good solution that provides more direct
information and experience to online customers and helps them make better buying decisions,
even though the interaction, rendering, and modeling methods still need improving.
Making models for all products of e-commerce website would cost a lot and take a long
time, which might be a core problem hindering AR e-commerce from being widely used. In
chapter three of this dissertation, we also developed a convenient and low-cost way to
recover 3D models directly from 2D images without knowing more information. A
hierarchical matching method and a camera parameter estimation method were developed.
Experiment results show that this model recovery method is quite feasible.
To improve the rendering method of AR e-commerce, make users feel more
comfortable, and make the products seem more real, chapter four of this dissertation,
presented an immersive AR environment with GPU based occlusion. This environment
makes use of the advantages of CAVE-based facilities, uses remote stereo cameras to capture
the background, and renders virtual objects in the stereo background. With stereo images, a
real-time real-virtual object occlusion approach was developed and programmed into a GPU.
The GPU-based method determines occlusion in real time by calculating depth information
from the background of a real scene. As a result, the application intelligently knows which
virtual object is in front of objects from video and which is behind them.
In chapter five of this dissertation, a case study is presented to show the process of
recovering a product model via the method presented in chapter three, the process of model
and also in the immersive AR environment presented in chapter four, which shows the strong
feasibility of AR e-commerce.
References
[1] Standing, C., 2000, “Internet Commerce Development”, Artech House, Hardcover,
Published February 2000.
[2] Lefebvre, L.A., & Lefebvre, E., 2002, “E-commerce and Virtual Enterprises: Issues and
Challenges for Transition Economies”, Technovation, 2002, 22(5), pp.313-323.
[3] Cho, Y., Im, I., Hiltz, R., & Fjermestad, J., 2002, “An Analysis of Online Customer
Complaints: Implications for Web Complaint Management”, Proc. of the 35th Hawaii
International Conference on System Sciences, January, Big Island, Hawaii.
[4] Daugherty, T., Li, H., & Biocca, F., 2005, “Experiential commerce: A summary of
research investigating the impact of virtual experience on consumer learning”, Society of
Consumer Psychology: Online Advertising. Mahwah, NJ: Lawrence Erlbaum Associates.
[5] Hughes, S., Brusilovsky, P., & Lewis, M., 2002, “Adaptive navigation support in 3D
e-commerce activities”, Proc. of Workshop on Recommendation and Personalization in
E-Commerce at the 2nd International Conference on Adaptive Hypermedia and Adaptive
Web-Based Systems (AH'2002) Malaga, Spain, May 28, 2002, pp. 132-139.
[6] Santos, C.T., & Osorio, F.S., 2004, “AdapTIVE: An Intelligent Virtual Environment and
Its Application in E-Commerce”, COMPSAC 2004, pp. 468-473.
[7] Chittaro L., & Ranon R., 2000, "Virtual Reality stores for 1-to-1 e-commerce", Proc. of
the CHI2000 Workshop on Designing Interactive Systems for 1-to-1 E-Commerce, The
Hague, The Netherlands, 2000.
[8] Chittaro L., & Ranon R., 2002, “New Directions for the Design of Virtual Reality
Advanced Visual Interfaces, ACM Press, New York, May 2002, pp. 308-315.
[9] Oliveira, C. Shen, X., & Georganas, N., 2000, “Collaborative Virtual Environment for
Industrial Training and e-Commerce”, Workshop on Application of Virtual Reality
Technologies for Future Telecommunication Systems, IEEE Globecom 2000 Conference,
Nov.-Dec. 2000.
[10] Bogdanovych, A., Berger, H., Simoff, S., & Sierra, C., 2004, “3D Electronic
Institutions: Social Interfaces for E-Commerce”, In 2nd European Workshop on
Multi-Agent Systems, Barcelona, Spain, December 16-17 2004.
[11] Sanna, A., Zunino, C., & Lamberti, F., 2002, “HAVS: a human animated
VRML-based virtual shop for e-commerce”, In SCI'02 Proc., vol. XII, pp.24-29.
[12] Azuma, R., Baillot, Y., Behringer, R., Feiner, S., Julier, S., & MacIntyre, B., 2001,
“Recent Advances in Augmented Reality”, IEEE Comp. Graph. & App, vol. 21, no. 6
(Nov/Dec 2001), pp. 34-47.
[13] Zhang, X., Fronz, S., & Navab N., 2002, “Visual Marker Detection and Decoding in
AR Systems: A Comparative Study”, ISMAR 2002, pp. 97-106.
[14] Zhang, X., Navab, N., & Liou S.P., 2000, “E-Commerce Direct Marketing using
Augmented Reality”, IEEE International Conference on Multimedia and Expo(I) 2000,
CHAPTER 2. AUGMENTED REALITY E-COMMERCE SYSTEM:
DEVELOPMENT AND USER STUDIES
A paper submitted to the International Journal of Human Computer Studies
Yuzhu Lu Shana Smith
1620 Howe Hall, 2274
Human Computer Interaction Program
Iowa State University, Ames, IA 50011-2274
[email protected] [email protected]
Abstract. Traditional electronic commerce (e-commerce) is limited because it cannot
provide enough direct information about products to online consumers. Online shoppers are
often unhappy with the products and related customer service they receive because of the
lack of interaction and try, which, on the other hand, onsite shopping can provide. In this
study, an augmented reality (AR) e-commerce system was developed, using user-centered
design principles. The tool was developed as an Internet plug-in, so it can be used on
different kinds of computers and handheld devices. A usability study was also conducted to
compare the developed AR e-commerce system with traditional e-commerce and virtual
reality (VR) e-commerce systems. Study results show that the AR e-commerce system
provides more information and more direct experiences to online customers, by combining
physical environment information with virtual product models. As a result, the AR system
can help customers make better purchasing decisions.
Keywords: Augmented Reality, Electronic Commerce, Usability Study.
1 Introduction
Standing (2000) defined e-commerce as the online exchange of goods, services, and
money within firms and between firms and their customers. In the past decade, e-commerce
individuals with disabilities and for others who have difficulty engaging in onsite shopping.
In 2002, Lefebvre (2002) showed that e-commerce was growing faster than expected, and
that it was likely to have a dominant position in the future economy.
However, e-commerce and online shopping still cannot fully replace onsite shopping,
especially for products like clothing, shoes, jewelry, and furniture. For such products, onsite
shoppers frequently engage in some sort of interaction with their potential purchase before
buying it to discover the product’s scent, texture, appearance, fit, or sound. Unfortunately,
such interaction is often impossible for online purchases. As a result, online shoppers,
particularly when shopping for clothing and shoe products, are often unhappy with the
products and related customer service they receive (Cho et al., 2002).
2D pictures or written descriptions used in traditional e-commerce systems often cannot
provide enough product information. Thus, to improve e-commerce systems, it is important
to develop systems which provide more sensory information, to help online shoppers make
better purchasing decisions and, thus, improve customer satisfaction.
2 Background
2.1 VR in E-commerce
Virtual reality (VR) is a computer-simulated environment that allows users to manipulate
3D virtual models online. Recently, researchers have been using VR in e-commerce to
provide consumers with a new type of shopping experience using virtual product models.
Hughes et al (2002) presented an adaptive navigation support system for using a virtual
environment for online shopping. Sanna et al. (2002) presented a VR e-commerce system
based on VRML. They used QuickTime 3D to generate 360-degree image-based immersive
backgrounds and an animated virtual human to help online shoppers navigate through their
e-commerce environment. Bhatt (2004) analyzed the interactivity, immersion, and connectivity
Daugherty et al. (2005) conducted five experiments to study the usability of VR for
e-commerce. Their results showed that users acquired more information about products when
using a VR-based e-commerce system than when using traditional tools. Fomenko (2006)
developed a tool for creating online VR shops, which also gives domain experts more control
during the website development process. With Fomenko's tool, developers can use high-level
concepts to model and semi-automatically generate a complete VR shop.
2.2 Moving from VR to AR
Although prior studies show that VR can enhance e-commerce by providing more
product information, through enhanced human-computer interaction, current VR methods for
e-commerce still only provide scaled virtual product models displayed on traditional
computer screens. New, more advanced, methods are needed to provide consumers with more
realistic product models, with respect to size, customer experience, and user interaction.
AR is a technology which can mix or overlap computer-generated virtual objects with
real-world scenes or objects. Unlike VR, which experientially replaces the physical world,
AR enhances physical reality by integrating virtual objects into a physical scene. Generated
virtual objects become, in a sense, an equal part of the natural environment.
In recent years, much research has focused on developing AR applications, which could
be generally classified into two types based on the different devices used: optical see-through
AR, and video see-through AR. Optical see-though AR uses semi-transparent screens to
project computer generated objects, by which user could also see-through it to gain the
integrated AR scene. Video see-through AR uses cameras to capture the live scene as videos.
At each frame, video image is processed and computer generated object are added. The
mixed scene of video see-through AR could be displayed on different devices. Markers are
often used for tracking with computer vision technology in video see-through AR. Among
researchers.
However, there has been little research conducted related to using AR to enhance
e-commerce. In 2001, Azuma et al. reviewed new advances in AR which, after 1997, included
display devices and methods, indoor and outdoor tracking, model rendering, and interaction
technologies. At that time, they identified several problems that still needed to be addressed,
such as occlusion, broader sensing, advanced rendering, and user perception issues. In
addition, in 2005, Swan et al’s survey showed that, although there were an increasing number
of AR applications, research which considered usability was only a small part (less than 8%)
of the total, and most of the usability studies were neither formal nor systematic.
Among the limited number of prior related studies, Zhu et al. (2006) proposed AR
in-store shopping assistant devices, which provided personalized advertising and dynamic
contextualization. Their study was aimed at using AR technology to enhance in-store
shopping. Zhang et al. (2000) proposed and developed a prototype direct marketing system
that used AR technology. Salespeople could use the system to show the main features of a
product by manually holding a plate with specially designed markers. With their
marker-based system, they could mix a 3D virtual product with a real scene, videotape the resulting
scene, and then send the video tape to interested customers by email. However, their method
of using AR in e-commerce did not make full use of the advantages of AR. With their method,
online shoppers had no direct interaction with either physical objects or virtual product
models. With only video recordings of AR scenes, customers still might not know whether
products are suitable for them in their real physical environments.Two industry companies:
metaio and bitmanagement (http://www.ar-live.de/main.php)(2007), are also trying to
cooperate and extend e-commerce systems with AR technology. Users are asked to upload a
photo of the personal environment with markers. The mixed scene could be visualized
fit their personal environment. However static picture greatly limits uses’ direct interaction
with virtual product models in a natural way, and the flexible try in their environment.
In this study, a new AR e-commerce system was developed using video see-through AR
considering that devices used by this type of AR are more available for online consumers, and
that this type of AR is more flexible because the mixed AR scene could be displayed on
different device in steady of optical see-through devices only. This system integrates a
full-sized virtual product model into an online shopper’s physical environment and provides the
customer methods for “realistically” interacting with the virtual product. By this system,
online shoppers can directly interact with the product model in their environment freely in a
more nature way. For example, they can move around to see how the product fit their space
from different viewpoint, and they can also move around markers as moving products. This
paper presents both the design of the AR e-commerce assistant system and related usability
studies. Several key issues related to using AR to enhance e-commerce are also discussed and
analyzed.
3 System and User Interface Design
In this study, an AR e-commerce assistant system was designed to provide consumers
with more realistic product experiences and interactions. With the developed AR e-commerce
assistant, online consumers can bring a product into their physical environment and even try
out and visualize the product in their physical environments while shopping from their
computers.
3.1 Structure
Like traditional e-commerce systems, our AR e-commerce system uses the internet as
the primary user interaction platform. However, with our AR e-commerce system, a camera is
needed to capture the consumer’s physical environment and then integrate it with virtual
The system was developed as an Active X plug-in for an e-commerce web page. Online
users can use the web page navigation to search for and view pictures and product related
information, just as they would on a traditional e-commerce website. However, online
shoppers can also use the plug-in to bring virtual products into their physical environment
and then interact with the products to determine if the products are suitable.
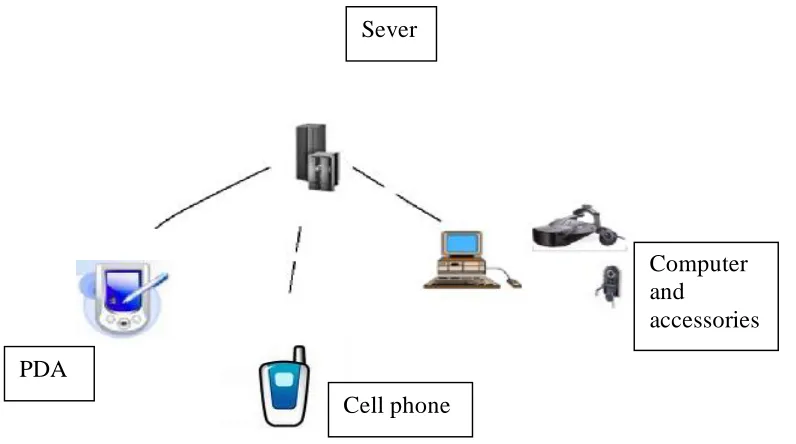
The plug-in was made using the MFC and OpenGL libraries. The plug-in works
between clients and an e-commerce assistant server through an Internet Explorer interface, so
that online consumers can easily log onto the Internet, using different hardware, like a
computer, cell phone, or Personal Digital Assistant (PDA) to access it as shown in Figure 2.1.
In this system, an extra camera is needed, so that consumers can bring product models into
their home, auto, outdoor, or other scenes. ARToolkit (Kato and Billinghurst, 1999) was
used for tracking, and Open VRML was used for rendering models. The complete structure of
[image:24.595.106.504.446.668.2]the system is shown in Figure 2.2.
Fig. 2.1 AR e-commerce assistant system working model Sever
PDA
Cell phone
Computer and
Fig. 2.2 The structure of the AR e-commerce assistant system
3.2 Interfaces
Primary users of the system are expected to be common computer users, with minimal
computer experience. As a result, the user interface of the system was made as simple and
user-friendly as possible. In the study, we determined that consumer shopping typically
includes three main tasks according to our analysis:
1. Searching for products.
2. Interacting with products.
3. Acquiring product information.
As a result, the user interface was designed to facilitate the three primary shopping tasks.
The three tasks were combined into a two-level menu system within the AR window as
shown in Figure 2.3 considering 2D menu system is still the most intuitive interaction way
with computer for users because of their previous computer experience. Through the menu
user could access the full interaction designed for AR e-commerce. Shortcut keys are also
available to avoid the interruption between the user and the AR scene.
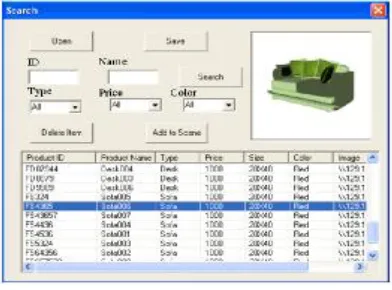
To provide convenient searching for products, a product search interface in AR window
is provided as shown in Figure 2.4 so that user do not have to exit the AR application every
time to find another product at web page level and reopen another AR application for
comparison. Several capabilities were also developed to make product searching efficient, MFC
OpenGL, GLUT
ARToolkit Internet Explorer Interface
Server, Database Open
VRML
such as searching by keywords, sorting by properties, image viewing, listing operations, and
price displays. With the tool, users can recursively search for and switch product models in
an AR display, to compare products and thus gain enough direct information to make
purchasing decisions. For tracking purposes, within the system, different markers correspond
to types of products. Online shoppers can also combine different types of products together
when shopping. For example, a shopper can combine a table with different chairs or sofas to
[image:26.595.193.402.264.471.2]check the appearance of different combinations in their home.
Fig. 2.3 User interface menu system
Fig. 2.4 Product search interface
With the well-built and normalized product models selected and loaded to the AR scene,
the products can be visualized with the actual size in the live background environment which
[image:26.595.213.409.513.658.2]for example, move or rotate the model, and view specific information about the selected
product, such as name, price, size, and color, to help them make their decision.
In AR e-commerce, user could have special interactions, which is not available in other
applications. User can walk around the environment with the laptop and camera to see how
the product fit the environment from different viewpoint as shown in Figure 2.5. User can
also interact with the AR scene by moving or rotating markers used for tracking.
Fig. 2.5 A virtual model in a real scene
As mentioned above, ARToolkit library is used for marker-based tracking in real scenes
(Kato and Billinghurst, 1999). Large markers are used for large virtual objects, such as
furniture, as shown in Figure 2.6. Using large markers makes the recognition and registration
easier and more reliable. With large markers, online consumers can bring virtual furniture or
other large virtual products into their homes, and view it in a farther distance. Otherwise it
will bring more instability since marker tracking is based on computer vision technology.
Product model needed to be normalized according to the marker size so that user see the
actual size to help with their decision.
Fig. 2.6 A Big marker was used
4 Usability Study
A usability study was conducted to compare the developed AR enhanced e-commerce
system with a traditional e-commerce system and a VR-enhanced e-commerce system. To
avoid web page design bias, all three web pages were designed using the same design
template, which included a word description of the product and a visualization of the product,
as shown in Figures 2.7-2.9. The word description parts of the three e-commerce web pages
were the same. The only difference among the three types of e-commerce systems was in the
visualization component.
For visualization, traditional e-commerce web pages typically use several static 2D
pictures of a product, from different perspectives, as shown in Figure 2.7. With a traditional
e-commerce web page, users can visually examine the static 2D product pictures before they
buy the product. They can also usually interactively switch between the images. The
traditional method is the most commonly used e-commerce approach generally used today.
VR-enhanced e-commerce web pages typically use JAVA applets for visualization. The
JAVA applets dynamically download 3D product models in real-time and provide different
manipulation capabilities (translate, rotate, zoom) to users, as shown in Figure 2.8. With
at virtual product models. There might be different designs of VR e-commerce. But this type
of design is more representative since similar type of design has been taken for user studies of
VR e-commerce (Daugherty 2005) and also for commercial use in like Compaq.com and
Dell.com.
AR-enhanced e-commerce web pages use ActiveX controls for visualization as
described above. System users can visually bring products into their actual physical
environments, as shown in Figure 2.9. With the developed AR-enhanced system, users can
hold a laptop, which has a camera, and move around their environment to see how a virtual
product model looks corresponding to the translation, rotation, zoom interaction in VR
e-commerce, and pick operation in traditional e-e-commerce, and then decide if they want to buy
the product. They can also move markers to position the virtual products at different locations
to help them make their buying decisions. Figure 2.10 shows an example of our AR
commerce system running on a laptop. To control different interaction bias with VR
e-commerce and traditional e-e-commerce, the developed AR e-e-commerce menu system is not
asked to use in the user study.
Fig. 2.8 VR e-commerce with interactive 3D model
Fig. 2.9 AR e-commerce interface
(a) AR application (b) AR scene on computer screen
Virtual wall hanging
[image:30.595.203.387.66.222.2]Virtual plant
4.1 Experiment Design
Based on a pilot user study for home furniture products (Lu and Smith, 2006), a formal
user study was designed and conducted to test the usability of the developed AR e-commerce
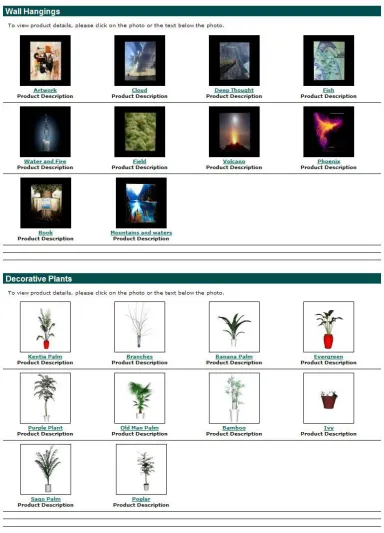
system. In the full study, different types of e-commerce web pages were designed for office
products (wall hangings and decorative plants) to avoid product-based bias, as shown in
Figure 2.11.
The experiment was designed as within-subjects for types of e-commerce, so that each
subject would access all three e-commerce system. Because subjects inevitably differ from
one another. In between-subject designs, these differences among subjects are uncontrolled
and are treated as error. In within-subject designs, the same subjects are tested in each
condition. Therefore, differences among subjects can be measured and separated from error
(Howell 2007). Removing variance due to differences between subjects from the error
variance greatly increases the power of significance tests. Therefore, within-subjects designs
are almost always more powerful than between-subject designs. Since power is such an
important consideration in the design of experiments, this study was designed as
within-subjects experiment to compare user’s subjective satisfaction level of using three different
types e-commerce system, by which different participant’s rating standard will not affect the
comparison. Tests were carried out with six volunteer participants in each of the four office
environments. In total, twenty-four participants were tested in the experiment. At the
beginning of the experiment, participants were trained to use the three types of e-commerce
systems. During the experiment, real-time help concerning how to use the systems was also
provided. In the test, participants were asked to use the three types of e-commerce system to
buy different office products for the different environments, without considering the budget.
Users were asked to select wall hangings and decorative plants and then compare the three
observed. After the experiment, participants were asked to fill out a questionnaire and to give
their evaluations of usability. Four main variables (overall evaluation, information provided,
ease of use, and confidence level in the final decision) were measured for each type of
e-commerce system for each participant. In the study, the independent variables were the three
different types of e-commerce systems, four different environments (an open space office, a
cubical, a single-user single-room office, and a multi-user single-room shared office). Within
each environment, presentation of the e-commerce systems was systematically varied to
control the “carryover” effects of within-subjects design. Since we assigned 6 subjects to
each environment, we were able to test all possible presentation orders of the three
e-commerce systems (3 choose 1 * 2 choose 1 * 1 choose 1) = 6 different testing orders: (T,
VR, AR), (T, AR, VR), (VR, T, AR), (VR, AR, T), (AR, T, VR), and (AR, VR, T). The
dependent variables in the research question were four main variables: overall evaluation,
Fig. 2.11 Office products
To test whether the usability results were affected by experience order, the six user
orders. Evaluations of the four main variables were also compared for the different orders.
The formal study addressed the following hypotheses:
Hypothesis 1: The overall evaluation and satisfaction level of using AR e-commerce
system is higher than using the other two e-commerce systems.
Hypothesis 2: The AR e-commerce system provides more visualized information to
online shoppers than the other two e-commerce systems.
Hypothesis 3: The ease of use rating for the AR e-commerce system is lower than the
other two e-commerce systems.
Hypothesis 4: Users of AR e-commerce system have a higher confidence level in their
final decision than users of the other two e-commerce systems.
Hypothesis 5: User performance in the different e-commerce systems will not be
affected by locations.
To test the 5 hypotheses, different ratings given by the participants, after using the three
types of e-commerce systems, were compared.
4.2 Experiment Participants
All participants for the study were individuals from Iowa State University who
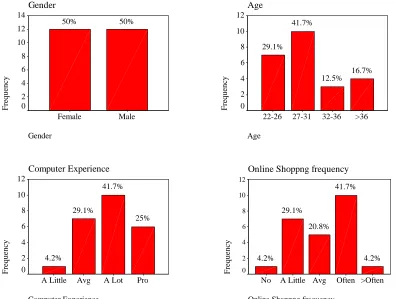
responded to an invitation email. They represented students, staff, and faculty. Figure 2.12
shows the composition of subjects for the study.
Figure 2.12 shows that the gender of participants was equally distributed. Since most of
the participants were students, the age distribution of participants was skewed toward lower
age groups, and computer experience level was skewed toward high levels (“A little” mean
little computer experience while “Pro” means professional computer experience), which
Gender Gender Male Female F re q u en cy 14 12 10 8 6 4 2 0 50% 50% Age Age >36 32-36 27-31 22-26 F re q u en cy 12 10 8 6 4 2 0 29.1% 41.7% 12.5% 16.7% Computer Experience Computer Experience Pro A Lot Avg A Little F re q u en cy 12 10 8 6 4 2 0 4.2% 29.1% 41.7% 25%
Online Shoppng frequency
Online Shoppng frequency
>Often Often Avg A Little No F re q u en cy 12 10 8 6 4 2 0 4.2% 29.1% 41.7% 20.8% 4.2%
Fig. 2.12 Participants’ self description
4.3 Results
4.3.1 Overall Evaluation
The first research question in the questionnaire was designed to capture overall feelings
about the three different types of e-commerce systems, without being affected or guided by
later questions. The participants’ overall evaluations are listed in Table 2.1, by locations and
[image:35.595.83.479.78.377.2]by experience orders, which were also separately tested using Factorial ANOVA.
Table 2.1 Overall evaluation (1=lowest 5=highest)
PARTICIPANT RATING LOCATION SUBJECTS
T VR AR
1 2 4 5
2 1 5 5
3 1 3 4
4 2 3 5
Open space office (1)
6 2 4 5 Mean/Std.
Dev 1.5/0.548 3.667/0.816 4.667/0.516
7 3 5 4
8 2 5 4
9 2 3 4
10 1 5 5
11 3 4 5
12 1 3 5
Cubical office (2)
Mean/Std.
Dev 2/0.894 4.167/0.983 4.5/0.548
13 3 5 5
14 1 3 5
15 3 3 5
16 5 4 4
17 1 3 5
18 1 3 5
Single-user single-room office (3)
Mean/Std.
Dev 2.333/1.633 3.5/0.837 4.833/0.408
19 3 4 5
20 3 4 5
21 2 3 4
22 1 2 4
23 3 4 4
24 5 5 4
Multi-user single-room shared office (4)
Mean/Std.
Dev 2.833/1.329 3.667/1.033 4.333/0.516
Mean 2.167 3.75 4.583
Std. Dev. 1.204 0.897 0.504
As shown in Table 2.1, the mean overall evaluation for traditional e-commerce was
2.167, the mean overall evaluation for VR enhanced e-commerce was 3.75, and the mean
overall evaluation for AR enhanced e-commerce was 4.583. As shown in the
between-subjects effects and within-Subjects effects analysis of Table 2.2, the p-value for the effect of
the type of e-commerce system is very small (<0.05), which indicates that there is a
statistically significant difference in mean overall evaluations between the three types of
e-commerce systems. In contrast, the p-values for the effect of location is 0.7913, which
indicates that there is no statistically significant difference in mean overall evaluations for
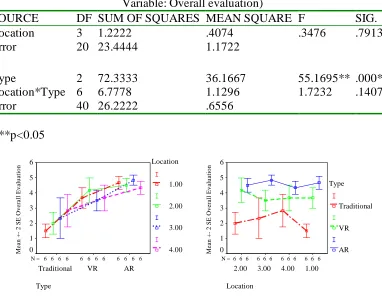
Figures 2.13, clearly shows that the main effect for different types of e-commerce
systems is obvious and that the overall evaluation for the AR e-commerce system is higher
than the ratings for the traditional and VR e-commerce systems. The p-value for interaction
between types and locations is 0.1407, which indicate that there are no statistically significant
interaction effects for types and locations. Thus, interaction effects, and location effects were
[image:37.595.105.487.269.566.2]neglected in the refined analysis model shown in Table 2.3.
Table 2.2 Tests of Between-Subjects Effects and Within-Subjects Effects (Dependent Variable: Overall evaluation)
SOURCE DF SUM OF SQUARES MEAN SQUARE F SIG.
Location 3 1.2222 .4074 .3476 .7913
Error 20 23.4444 1.1722
Type 2 72.3333 36.1667 55.1695** .000**
Location*Type 6 6.7778 1.1296 1.7232 .1407
Error 40 26.2222 .6556
**p<0.05
6 6
6 6 6
6 6 6
6 6 6
6 N = Type AR VR Traditional M ea n + - 2 S E O v er al l E v al u at io n 6 5 4 3 2 1 0 Location 1.00 2.00 3.00 4.00 6 6 6
6 6 6 6
6 6 6 6
6 N = Location 1.00 4.00 3.00 2.00 M ea n + - 2 S E O v er al l E v al u at io n 6 5 4 3 2 1 0 Type Traditional VR AR
Fig. 2.13 Interaction between type and location for Overall evaluation
To determine differences in overall evaluations for the three types of e-commerce
systems, multiple mean comparisons (Tukey HSD) was used, without considering. The
analysis results in Table 2.3 show that each pair of mean overall evaluations for the three
types is significantly different.
In comparing the three e-commerce systems, the AR enhanced e-commerce was rated
highest by users, which indicates that users preferred the AR enhanced e-commerce system
more than the other two for office decoration. So research hypothesis 1 is accepted. Based on
the strength and weakness of AR commerce comparing to the other two type of
e-commerce, costumers still prefer AR e-commerce. “It is a very potential method, especially
for products like furniture,” as mentioned by one of the participant. There was also no
significant evidence that location had any effect on users’ overall evaluations from the
statistics.
4.3.2 Visualized Information Provided
In the questionnaire, users were asked to rate how much information they gained from
the three different types of e-commerce systems. Participants’ ratings for information
provided are listed in Table 2.4, by locations and by experience orders, which were also
tested separately using Factorial ANOVA.
Table 2.4 Information provided (1=lowest 5=highest)
PARTICIPANT RATING LOCATION SUBJECTS
T VR AR
1 3 3 3
2 1 3 5
3 1 3 5
4 3 4 5
5 1 4 4.5
6 3 4 5
Open space office (1)
Mean/Std.
Dev 2/1.095 3.5/0.548 4.583/0.801
7 3 4 4.5
8 2 4 4
Cubical office (2)
10 1 3 4
11 3 5 4
12 1 2 5
Mean/Std.
Dev 2/0.894 3.333/1.211 4.417/0.492
13 3 5 5
14 1 3 5
15 1 4 4
16 4 5 4
17 1 3 5
18 1 3 5
Single-user single-room office (3)
Mean/Std.
Dev 1.833/1.329 3.833/0.983 4.667/0.516
19 3 4 5
20 2 4 5
21 1 3 4
22 1 3 4
23 2 3 4
24 3 4 5
Multi-user single-room shared office (4)
Mean/Std.
Dev 2/0.894 3.5/0.548 4.5/0.548
Mean 1.958 3.542 4.542
Std. Dev. 1.000 0.833 0.569
From Table 2.4, the mean rating for information provided by the traditional
commerce system was 1.958, the mean information provided by the VR-enhanced
e-commerce system was 3.542, and the mean rating for information provided by the
AR-enhanced e-commerce system was 4.542. As shown in the between-subjects effects and
within-Subjects effects analysis of Table 2.5, the p-value for the effect of type of e-commerce
system is very small (<0.05), which indicates that there is a statistically significant difference
in mean information provided between the three types of e-commerce. However, the p-value
for the effect of location is 0.9555, which indicates that there is no statistically significant
difference in mean information provided for different locations and different experience
orders.
Figures 2.14, clearly shows that the information users gained from the AR e-commerce
systems. The p-value for the interaction between type and location is 0.9677, which indicates
that there was no statistically significant interaction effect between type and location. Thus,
the location effect, and interaction effects on information provided were neglected in the
refined analysis model shown in Table 2.6.
Table 2.5 Tests of Between-Subjects Effects and Within-Subjects Effects (Dependent Variable: Information Provided)
SOURCE DF SUM OF SQUARES MEAN SQUARE F SIG.
Location 3 .3472 .1157 .1062 .9555
Error 20 21.8056 1.0903
Type 2 81.4444 40.7222 69.4787** .000**
Location*Type 6 .7778 .1296 .2212 .9677
Error 40 23.4444 .5861
**p<0.05
6 6
6 6 6
6 6 6
6 6 6
6 N = Type AR VR Traditional M ea n + - 2 S E V is u al iz ed I n fo rm at io n 6 5 4 3 2 1 0 Location 1.00 2.00 3.00 4.00 6 6 6
6 6 6 6
6 6 6 6
[image:40.595.97.491.211.527.2]6 N = Location 4.00 3.00 2.00 1.00 M ea n + - 2 S E V is u al iz ed I n fo rm at io n 6 5 4 3 2 1 0 Type Traditional VR AR
Fig. 2.14 Interaction between type and location for Information Provided
Table 2.6 Homogeneous Subsets Tukey HSD (Dependent Variable: Information Provided)
To determine the differences between the information users gained for the three types of
experiment-wise error rate of 0.05, Table 2.6 shows that the differences in information
provided between the AR e-commerce system and both the traditional e-commerce and VR
enhanced e-commerce system are both statistically significant. So the research hypothesis 2 is
accepted. As participants mentioned in their feedbacks that the AR e-commerce system
provides the capability to see how products fit in the physical space, so that they can gain
more visualized information. “It is very vivid, as if you put a real product into the place
where you want. You can efficiently evaluate product information, such as color and size,
and determine whether it can match with the scene very well.” “It can provide people an
interesting experience and help people gain more information and a much more correct
judgment.” Besides, there was also no significant evidence showing that location had an
effect on information provided from the statistics.
4.3.3 Ease of Use
Participants’ ratings concerning ease of use for the three different types of e-commerce
systems are listed in Table 2.7, by location and by experience order, which were also tested
[image:41.595.120.475.509.751.2]separately using Factorial ANOVA.
Table 2.7 Ease of use (1=lowest 5=highest)
PARTICIPANT RATING LOCATION SUBJECTS
T VR AR
1 5 4 2
2 5 1 5
3 5 4 3
4 2 3 5
5 5 4.5 4.5
6 2 5 4
Open space office (1)
Mean/Std.
Dev 4/1.549 3.583/1.429 3.917/1.201
7 5 5 3
8 4 4 4
9 5 3 2
10 5 5 4
11 4 5 3
Cubical office (2)
Mean/Std.
Dev 4.667/0.516 4.333/0.816 3.167/0.753
13 5 4 4
14 5 5 5
15 5 4 5
16 5 4 3
17 5 4 3
18 5 4 2
Single-user single-room office (3)
Mean/Std.
Dev 5/0 4.167/0.408 3.667/1.211
19 5 5 3
20 5 3 5
21 4 4 3
22 5 3 2
23 4 4 3
24 5 5 3
Multi-user single-room shared office (4)
Mean/Std.
Dev 4.667/0.516 4/0.894 3.167/0.983
Mean 4.583 4.021 3.479
Std. Dev. 0.881 0.938 1.037
The mean ease of use for the traditional e-commerce system was 4.583, the mean ease
of use for the VR enhanced e-commerce system was 4.021, and the mean ease of use for the
AR enhanced e-commerce system was 3.479. As shown in the between-subjects effects and
within-Subjects effects analysis of Table 2.8, the p-value for the effect of type of e-commerce
system is 0.0027 (<0.05), which indicates that there is a statistically significant difference in
mean ease of use between the three types of e-commerce systems. In contrast, the p-value for
the effect of location is 0.4033, which indicates that there is no statistically significant
difference in mean ease of use for different locations.
Figures 2.15 shows the main effect of different types of e-commerce systems. Ease of
use for the AR e-commerce system is much lower than ease of use for the traditional and for
the VR e-commerce systems. The p-value for the interaction effect between type and location
is 0.5186, which indicate that there are also no statistically significant interaction effects for
type and location or type. Thus, the interaction effects, for ease of use were neglected in the
Table 2.8 Tests of Between-Subjects Effects and Within-Subjects Effects (Dependent Variable: Easiness to Use)
SOURCE DF SUM OF SQUARES MEAN SQUARE F SIG.
Location 3 1.9444 .6481 1.0234 .4033
Error 20 12.6777 .6333
Type 2 14.6319 7.3160 6.8721** .0027**
Location*Type 6 5.6181 .9363 .8795 .5186
Error 40 42.5833 1.0646
**p<0.05
6 6
6 6 6
6 6 6
6 6 6
6 N = Type AR VR Traditional M ea n + - 2 S E E as in es s to U se 5.5 5.0 4.5 4.0 3.5 3.0 2.5 2.0 Location 1.00 2.00 3.00 4.00 6 6 6
6 6 6 6
6 6 6 6
6 N = Location 4.00 3.00 2.00 1.00 M ea n + - 2 S E E as in es s to U se 5.5 5.0 4.5 4.0 3.5 3.0 2.5 2.0 Type Traditional VR AR
Fig. 2.15 Interaction between type and location for Easiness to use
Table 2.9 Homogeneous Subsets Tukey HSD
To determine the differences between ease of use for the three types of e-commerce
systems, Tukey HSD was used, without considering location or order. With an
experiment-wise error rate of 0.05, Table 2.9 shows that the difference in ease of use between the
traditional e-commerce system and the VR enhanced e-commerce system is not statistically
significant. The difference between the VR enhanced e-commerce system and the AR
traditional commerce system is significantly better than ease of use for the AR enhanced
e-commerce system.
So the research hypothesis that ease of use for the AR e-commerce system is lower than
for the traditional e-commerce systems is accepted. Participants mentioned in their feedback
that the AR e-commerce system needs more high-end hardware equipment, and that it is
inconvenient to use. “It is not very convenient to hold the laptop with your hands all the
time.” There are two explanations about this, the first one is that AR e-commerce use more
devices and need more computer skills, the second one is that users are still not familiar with
AR and its interaction. Meanwhile, there is also no significant evidence that location has
significant effects on ease of use.
4.3.4 User Confidence Level for Decision
The final main dependent variable measured in the questionnaire was the user’s
confidence level in their decision (buy or not buy). Participants’ ratings are listed in Table
[image:44.595.120.476.512.751.2]2.10, by location and by experience order, which were also tested using Factorial ANOVA.
Table 2.10 User confidence level for decision (1=lowest 5=highest)
PARTICIPANT RATING LOCATION SUBJECTS
T VR AR
1 2 2 4
2 1 3 5
3 1 3 4
4 2 4 5
5 1 4 4.5
6 2 3 5
Open space office (1)
Mean/Std.
Dev 1.5/0.548 3.167/0.752 4.583/0.491
7 2 5 4
8 2 4 5
9 3 4 5
10 2 4 3
11 3 4 5
Cubical office (2)
Mean/Std.
Dev 2.167/0.752 3.833/0.983 4.5/0.837
13 3 4 5
14 3 5 5
15 4 3 5
16 4 4 3
17 1 3 5
18 2 3 5
Single-user single-room office (3)
Mean/Std.
Dev 2.833/1.169 3.667/0.816 4.667/0.816
19 3 4 5
20 2 3 5
21 3 4 5
22 2 4 5
23 2 3 4
24 3 3 5
Multi-user single-room shared office (4)
Mean/Std.
Dev 2.5/0.548 3.5/0.548 4.833/0.408
Mean 2.25 3.542 4.646
Std. Dev. 0.897 0.779 0.634
Table 2.11 Tests of Between-Subjects Effects and Within-Subjects Effects (Dependent Variable: User Confidence Level for Decision)
SOURCE DF SUM OF SQUARES MEAN SQUARE F SIG.
Location 3 4.2049 1.4016 2.2107 .1184
Error 20 12.6806 .6340
Type 2 69.0208 34.5104 64.6229** .0000**
Location*Type 6 3.4514 .5752 1.0772 .3923
Error 40 21.3611 .5340
**p<0.05
The mean user confidence level for the Traditional e-commerce system was 2.25, the
mean user confidence level for the VR enhanced e-commerce system was 3.542, and the
mean user confidence for the AR enhanced e-commerce system was 4.646. As shown in the
between-subjects effects and within-Subjects effects analysis of Table 2.11, the p-value for
the effect of type of e-commerce system is very small (<0.05), which indicates that there is a
statistically significant difference in user confidence level between the three types of
[image:45.595.121.475.69.369.2]that there is no statistically significant difference in user confidence level for different
locations.
Figures 2.16 clearly shows the main effect for different types. User confidence level
for the AR e-commerce is much higher than user confidence level for either the traditional or
the VR e-commerce systems. The p-value for the interaction effect of type and location is
0.3923, which indicate that there is no statistically significant interaction effect for type and
location, Thus, location effect, and interaction effects on user confidence level were
neglected in the refined analysis model as shown in Table 2.12.
6 6
6 6 6
6 6 6
6 6 6
6 N = Type AR VR Traditional M ea n + - 2 S E C o n fi d en ce L ev el 6 5 4 3 2 1 0 Location 1.00 2.00 3.00 4.00 6 6 6
6 6 6 6
6 6 6 6
6 N = Location 4.00 3.00 2.00 1.00 M ea n + - 2 S E C o n fi d en ce L ev el 6 5 4 3 2 1 0 Type Traditional VR AR
Fig. 2.16 Interaction between type and location for Confidence Level for Decision
Table 2.12 Homogeneous Subsets Tukey HSD (Dependent Variable: User
Confidence Level in Decision)
To determine the differences in user confidence level for the three types of e-commerce
systems, Tukey HSD was used, without considering location or order. With an
the AR e-commerce system and both the traditional e-commerce system and the VR
enhanced e-commerce system was statistically significant.
The results show that users had a higher confidence level in their shopping decisions
when using the AR enhanced e-commerce system, rather than the other two e-commerce
systems, for purchasing office decoration products. The research hypothesis 4 is accepted. AR
e-commerce makes shopping more “visually intuitive”. “The user naturally sees what will
happen before actually buying”. “It gives you a real-time experience in your own
environment so that you can instantly tell whether or not the product is a good fit”.
Meanwhile there was also no significant evidence that either location had an effect on user
confidence level.
4.4 Observations and Users’ Comments
4.4.1 “As Is” View
95.8% of participants mentioned in their feedbacks that the AR e-commerce system
provides the capability to see how products fit in the physical space. Users’ comments
included: It is “visually intuitive”. “The user naturally sees what will happen before actually
buying”. “It gives you a real-time experience in your own environment so that you can
instantly tell whether or not the product is a good fit”. “It presents products in a real scale
relative to the environment, and is able to show views from several perspectives”. “AR makes
shopping more confident”. “It is cool and helpful for making the decision”. “It is very vivid,
as if you put a real product into the place where you want. You can efficiently evaluate
product information, such as color and size, and determine whether it can match with the
scene very well.” “It can provide people an interesting experience and help people gain more
information and a much more correct judgment.”
4.4.2 Ease of Use