International Journal of Innovative Technology and Exploring Engineering (IJITEE) ISSN: 2278-3075,Volume-8 Issue-12, October 2019
Abstract: The work describes the properties of natural gas as a engine fuel, as well as a method for evaluating knocking combustion at a test bench, a 3D numerical model of the combustion process of spark ignited (SI) gas engine and methods for assessing the probability of knocking combustion based on this model. The probability of knocking combustion, which characterizes the boundary condition between normal combustion and knocking, is determined (8%). An optimization study of the influence of adjustment parameters on the probability of knocking based on a three-dimensional numerical model is carried out. The developed and tested technique allows one to monitor the tendency of the influence of various adjustment parameters on the probability of knocking in a SI gas engine.
Index Terms: 3D knock modeling, compressed natural gas, knock, knocking prediction, knocking probability, SI gas engine, test bench knocking evaluation,
I. INTRODUCTION
Compressed Natural gas (CNG) is an alternative to petroleum fuels. Its reserves are much time greater than oil reserves. CNG in its physical and chemical properties has an advantage in comparison with petroleum fuels in lower emissions level and higher performance of internal combustion engines. CNG is a motor fuel that does not require additional processing [1].
Heavy duty SI Gas engines for trucks and buses are usually made based on diesel engines. To convert a diesel engine into a SI gas engine, it is necessary to replace the diesel fuel supply system with a gas fuel supply system (central or distributed type) and install a spark ignition system [2], [3]. Despite the high-octane number of CNG (about 115), the main goal of the combustion process is to avoid knocking and reduce its probability, which is still very high because of several design and other characteristics:- problems with filling the cylinders with a fresh air arise due to the installation of the throttle which is necessary to organize the exact air excess ratio of the air-fuel mixture. Therefore, in theory, local enrichment of the air-fuel mixture in the cylinders located at farthest from the throttle location (1st and 6th cylinders) occurs, thereby increasing the probability of knocking;
Revised Manuscript Received on September 05, 2019.
Andrey Kozlov, Federal State Unitary Enterprise Central Scientific Research Automobile and Automotive Institute NAMI, Moscow, Russia.
Alexey Terenchenko, Federal State Unitary Enterprise Central Scientific Research Automobile and Automotive Institute NAMI, Moscow, Russia.
Nikita Zuev, Federal State Unitary Enterprise Central Scientific Research Automobile and Automotive Institute NAMI, Moscow, Russia.
Ilmir Gattarov, KAMAZ Publicly Traded Company, Naberezhnye
- the quality of the fuel and its composition may differ (in the amount of impurities) depending on the region of production and the degree of purification, which also affects the knocking resistance of the fuel;
- it is necessary to reduce the compression ratio. It is also possible to change the shape of the combustion chamber (in this work, the shape of the combustion chamber is left by default, as in the diesel engine, and the compression ratio is reduced to 12.5 due to a change of the thickness of the cylinder head gasket);
- the use of CNG as fuel increases the heat density of engine parts in comparison with the diesel version.
Knocking is the sound waves that occur in the combustion chamber of an internal combustion engine (ICE). Due to complexity of the knocking phenomenon, there are three theories exist to describe it.
1. The theory of knocking combustion, which states that the flame front accelerates to supersonic velocity in the end-gas region and produces shock waves [5].
2. The theory of acceleration of the flame front, which states that knock occurs as a result of high-speed combustion of the air-fuel mixture ignited from the spark plug [6]-[8].
3. The theory of self-ignition, which states that the end-gas autoignites in one or more zones when temperature and pressure reach critical values [9]-[11].
To assess the knocking probability (KP), numerical methods are used. The purpose of the study is to develop and verify the method for calculating the KP based on three-dimensional numerical modeling of the combustion process of a SI gas engine.
The research object is a KamAZ in-line six-cylinder SI gas engine converted from a diesel engine. The cylinder bore is 130 mm, the piston stroke is 150 mm, and the compression ratio is 12.5. The rated power is 331 kW at 1900 rpm, the maximum torque is 1850 N*m at the range of 1200-1600 rpm.
II. PROPOSEDMETHODOLOGY A. General description
To develop and verify a method for calculating the KP, it is necessary to verify the calculation model based on the experimental data under normal combustion condition and under knocking combustion condition. The following describes the method for evaluating knocking at a test bench.
Experimental Research and Computer
Simulation of Knock Onset in a Heavy-Duty
Si Gas Engine
Evaluation of knocking at the test bench was carried out using the AVL IndiSet indicating system and the "Knock" module of the AVL Indicom software package. In this module, several values are recorded that characterize the knocking combustion condition:
KP_INT (Knock Integral) – the integral value of the knocking wave signal passed through the filter and superimposed on the cylinder pressure diagram.
KP_PK (Knock Peak) –` the absolute maximum of the rectified knock oscillation superimposed on the cylinder pressure.
KP_EV (Knock Event) – binary value (1/0) which indicates whether the current engine cycle was classed as knocking or not.
KP_FRQ (Knock Frequency) – specifies the number of detected knocking cycles within the last 'n' cycles ('n' is predefined), expressed as a percentage [12].
The determination of the knocking was carried out at full load and high load conditions, in the range of 800-1800 rpm in increments of 100 rpm. First, the optimal value of start of combustion (SOC) in crank angle degrees (CAD) before top dead center (TDC) was determined, corresponding to the minimum value of the break specific fuel consumption. On the next step, the boundary condition of knocking was determined by changing the value of SOC and the KP_PK (Knock Peak) parameter was chosen as an evaluative criterion. The value of this deviation was determined by the pressure curve, the signal of which should be filtered from interference caused by other oscillatory systems (for example, exhaust or intake valve, ignition coils). There are three types of filters: IIR Filter, which allows to change the filter characteristic by specifying a cut-off frequency. The upper frequencies are automatically limited at about 25 kHz by the calculation resolution and the filter algorithm used; mean value filter and dynamic mean value filter. Mean value filter allows adjusting the filter width, by selecting the
filter order. The mean value filter is characterized by a relatively straight pass-band until approaching the Shannon frequency. Thus, knock peaks are more pronounced with this filter because higher frequencies (>25 kHz) are damped less; Dynamic mean value filter combines the advantages of the two filters described above. It is possible to directly set the threshold value of the oscillation frequency, provided that high-frequency oscillations will also be taken into account in the measurement process. The lower frequency threshold for the filter can be roughly calculated by the diameter of the cylinder. In this case, the value of this parameter was 4 kHz. Based on the test results and literature, a significant, but not a hard level of knocking [4], [5] was chosen for the maximum pressure deviation KP_PK (Knock Peak) equal to 3.0-4.0 bar [13]-[15]. This value was obtained as a result of engine tests and compared with a distinctly audible noise of knocking combustion. Thus, to conduct a numerical study to assess the KP, an engine operating condition was chosen 1400 rpm and a load of 1500 N*m. In the literature [4], [16]-[18] the operating conditions of a turbocharged engine at a low speed and high load are described as the most critical from the negative effect of knocking combustion on engine components and systems.
The second important criterion in assessing of the knocking combustion condition, which is also used in the calibration of the engine control system, is the frequency of knocking cycles concerning to cycles with normal combustion. According to [17], [18], the number of cycles with knocking should not exceed 1-2%.
B. Block diagram
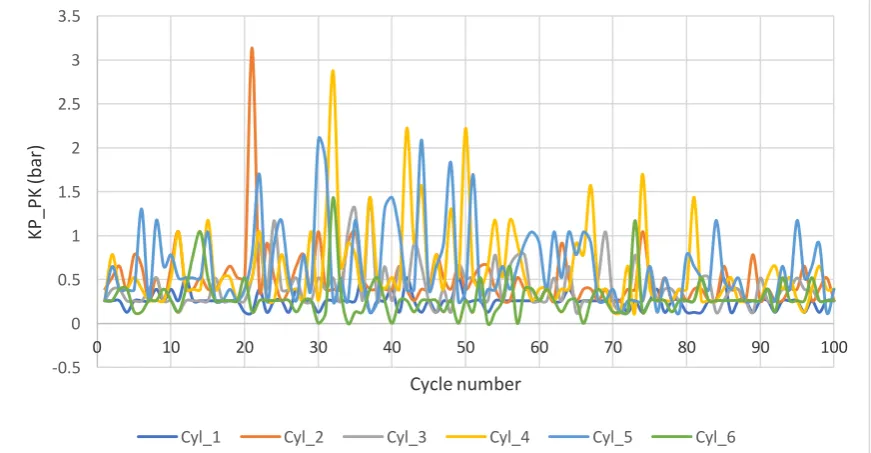
[image:2.595.81.517.488.714.2]Figs. 1 and 2 show the parameter KP_PK (Knock Peak), at an operating condition of 1500 N*m at 1400 rpm, which estimates the magnitude of the pressure deviation in the cylinder.
Fig. 1. The maximum value of pressure deviation KP_PK (Knock Peak) in the engine cylinder at a speed of 1400 rpm, a load of 1500 N*m and SOC value of 21.7 CAD before TDC
-0.5 0 0.5 1 1.5 2 2.5 3 3.5
0 10 20 30 40 50 60 70 80 90 100
K
P
_P
K
(ba
r)
Cycle number
International Journal of Innovative Technology and Exploring Engineering (IJITEE) ISSN: 2278-3075,Volume-8 Issue-12, October 2019
Fig. 1 shows the value of the pressure deviation inside the cylinder during knocking combustion. It is important to note that the pressure curve indication of the combustion process of the SI gas engine was carried out in all cylinders. The ordinate axis shows the pressure increase at the knocking condition relative to the average value of the peak pressure in the engine cylinder at normal combustion for n cycles; this parameter is measured in bars. The abscissa axis shows the number of cycles, which allows to evaluate the knocking
cycles. It can be seen that the maximum value of the KP_PK parameter is observed in the second, fourth and fifth cylinders and is 3.18, 2.9 and 2.1 bar, respectively. This condition can be classified as a boundary condition between a normal combustion and knocking combustion. The frequency of knocking cycles is 2%.
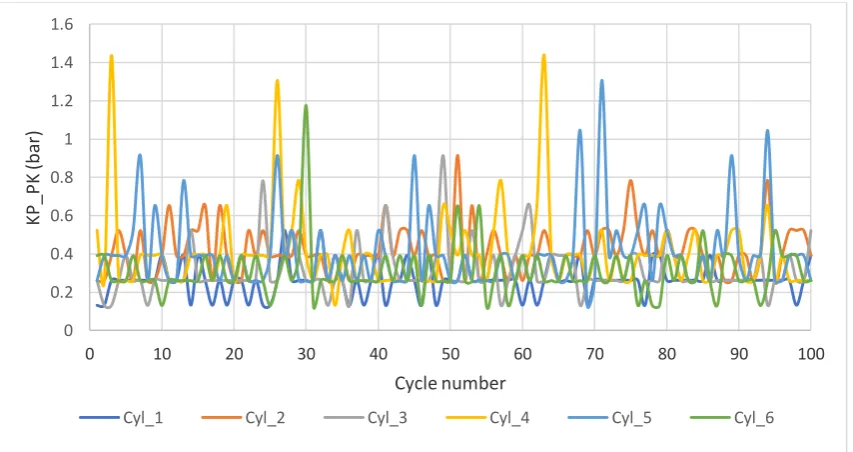
[image:3.595.87.514.170.396.2]Fig. 2 demonstrates the KP_PK graphs without knocking at a rotational speed of 1400 rpm and a torque value of 1500 N*m.
Fig. 2. The maximum value of pressure deviation KP_PK (Knock Peak) in the engine cylinder at a rotational speed of 1400 rpm, a load of 1500 N*m and SOC value of 21.7 CAD before TDC
Fig. 2 shows that the maximum pressure deviation for the fourth, fifth and sixth cylinders does not exceed 1.5 bar. It can be stated that there is no knocking for 100 cycles. Note that in this mode, there was no distinctly audible characteristic noise, indicating knocking combustion.
C. Algorithm
Method for mathematical modeling of knocking combustion
A numerical model of a SI gas engine to monitor the tendency of knocking combustion was created in the AVL Fire v2018.1 software package. As a combustion model the Flame Tracking Particle Model (FTPM) was used. This model allows to estimate the knocking combustion of a spark ignited homogeneous air-fuel mixture.
The FTPM is a numerical algorithm for modeling the combustion kinetics of a premixed charge which is based on the calculation of the temperature rise rate in each cell of the
computational grid [4], [19]. This model is capable of assessing the occurrence of self-ignition foci in zones where the flame front has not yet reached and in which pre-flame reactions occur. There are also studies carried out with similar goals but using other combustion models [20]-[22].
To conduct an optimization study, which includes a change in a number of adjustment parameters and an assessment of their influence on the occurrence of knocking combustion, the model was verified in two conditions that are differs in ignition timing. For the first condition the value of SOC was equal to 19 CAD before TDC, combustion without knocking in the experimental pressure curve (Fig. 3) and at the second - value of SOC 22 CAD before TDC with distinctly detected knocking combustion on the pressure curve, as shown in Fig. 4. Note that such a practice is quite widespread in the framework of combustion process [23]-[25].
0 0.2 0.4 0.6 0.8 1 1.2 1.4 1.6
0 10 20 30 40 50 60 70 80 90 100
K
P
_P
K
(ba
r)
Cycle number
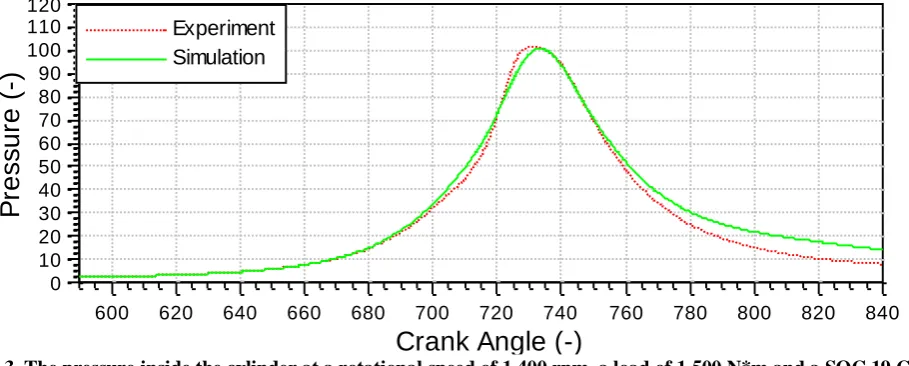
Fig. 3. The pressure inside the cylinder at a rotational speed of 1,400 rpm, a load of 1,500 N*m and a SOC 19 CAD before TDC
Fig. 3 shows the pressure curve at a rotation speed of 1400 rpm, and load of 1500 N*m obtained experimentally and simulated for SOC of 19 CAD before TDC. Note that in this case, the TDC of the end of the compression stroke and the
beginning of the combustion stroke corresponds to the 720 CAD. The difference between the area under the curve (equivalent to the cycle) is about 3%. This indicates that the convergence of the calculated and experimental values of the pressure inside the cylinder is satisfactory.
Fig. 4. The pressure inside the cylinder at a rotational speed of 1,400 rpm, a load of 1,500 N*m and a SOC 22 CAD before TDC.
Fig. 4 shows the pressure curves at a rotation speed of 1400 rpm, a load of 1500 N*m obtained experimentally and simulated for an ignition timing of 22 CAD before TDC. In this case, there is also an adequate convergence of the calculated and experimental pressure curves; the difference between the areas under the curves does not exceed 5%. Therefore, the calibrated model adequately describes the combustion process of a SI gas engine and is suitable for carrying out an optimization numerical study.
Calculation method for determining the probability of knocking combustion
To determine the probability of knocking combustion in a SI engine based on numerical simulation, a comprehensive assessment of the combustion process is necessary. It is necessary to estimate the number of cells of the computational grid in which the process of self-ignition takes place, information about the mass of cells susceptible to knocking combustion and the CAD of development of
knocking combustion is recorded in the form of a table depending on the CAD.
To determine the point in time and location of the self-ignition source, an evaluation criterion is adopted, which is based on a fixed rate of temperature increase in the particle. When a self-ignition criterion is recorded in one or more particles in a computational cell, the entire amount of fuel in this cell is burned during one calculation step. This process corresponds to rapid reactions and volumetric combustion or explosion in the pre-flame zone [26].
An algorithm for estimating KP developed at the N.N. Semenov Institute of Physical Chemistry by S.M. Frolov and V.S. Ivanov [26] is as follows:
1) Information on the rate of temperature rise using a script is converted depending on the probability density function (PDF) of
different orders (from 101 to 108) of the CAD.
0 10 20 30 40 50 60 70 80 90 100 110 120
P
re
ss
u
re
(
-)
600 620 640 660 680 700 720 740 760 780 800 820 840
Crank Angle (-)
Experiment Simulation
0 10 20 30 40 50 60 70 80 90 100 110 120
P
re
ss
u
re
(
b
a
r)
600 620 640 660 680 700 720 740 760 780 800 820 840
Crank Angle (deg)
International Journal of Innovative Technology and Exploring Engineering (IJITEE) ISSN: 2278-3075,Volume-8 Issue-12, October 2019
2) According to paragraph 1, for each order, it is necessary to construct appropriate graphs, by which to determine the critical angles in CAD at which the temperature rise rate is maximum and the process of self-ignition of the end-gas can occur. The priority in determining the critical angles is given to a higher order of the rate of temperature increase. In this case, the critical angles were determined by the second and third orders. Higher-order PDF values were close to zero.
3) With the obtained critical values of the angles, it is necessary to determine the average value of the temperature increase rate based on the distribution density function of various orders of magnitude PDF1-PDF8:
.
4)Calculate the Knock index . 5)Calculate the probability of knocking using the formula
.
According to the authors of the method [26], a knock index (KI) equal to or greater than 7 corresponds to 100% knocking combustion. A value of less than 2.5 corresponds to the complete absence of knocking combustion. Respectively, the KP shows the degree of approach to knocking combustion. According to the results of this study on a SI gas engine, the value of KP, corresponding to the boundary of the transition from the normal combustion condition to knocking combustion, is advisable to be considered equal to 8%.
III. RESULTANALYSIS
Numerical calculation study of knocking combustion. A numerical calculation study of the combustion process was carried out in comparison with the results of the calculation of the base case.
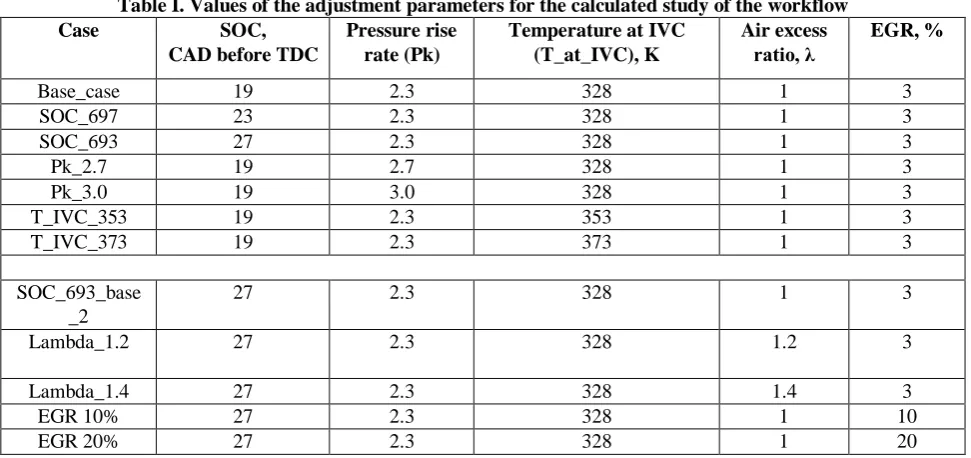
[image:5.595.56.542.325.554.2]The influence of the following control parameters on the combustion process was studied: the ignition timing, the pressure rise rate in the turbocharger, the temperature of the air-fuel mixture (Air-fuel temperature at IVC), the air excess ratio and the exhaust gas recirculation (EGR) ratio. Table I shows a list of adjustment parameters that changed during the numerical study of the combustion process.
Table I. Values of the adjustment parameters for the calculated study of the workflow
Case SOC,
CAD before TDC
Pressure rise rate (Pk)
Temperature at IVC (T_at_IVC), K
Air excess ratio, λ
EGR, %
Base_case 19 2.3 328 1 3
SOC_697 23 2.3 328 1 3
SOC_693 27 2.3 328 1 3
Pk_2.7 19 2.7 328 1 3
Pk_3.0 19 3.0 328 1 3
T_IVC_353 19 2.3 353 1 3
T_IVC_373 19 2.3 373 1 3
SOC_693_base _2
27 2.3 328 1 3
Lambda_1.2 27 2.3 328 1.2 3
Lambda_1.4 27 2.3 328 1.4 3
EGR 10% 27 2.3 328 1 10
EGR 20% 27 2.3 328 1 20
Note that Table I shows that when examining the combustion process using one of the adjustment parameters, for example, the pressure rise rate in the compressor part of turbocharger, all other adjustment parameters remained unchanged. As the basic calculation case in the investigation of the influence of the air excess ratio and EGR ratio on the combustion process of a SI gas engine for a basic calculation case was chosen the calculation case with SOC equal to 27 CAD before TDC. This decision is due to the well-known
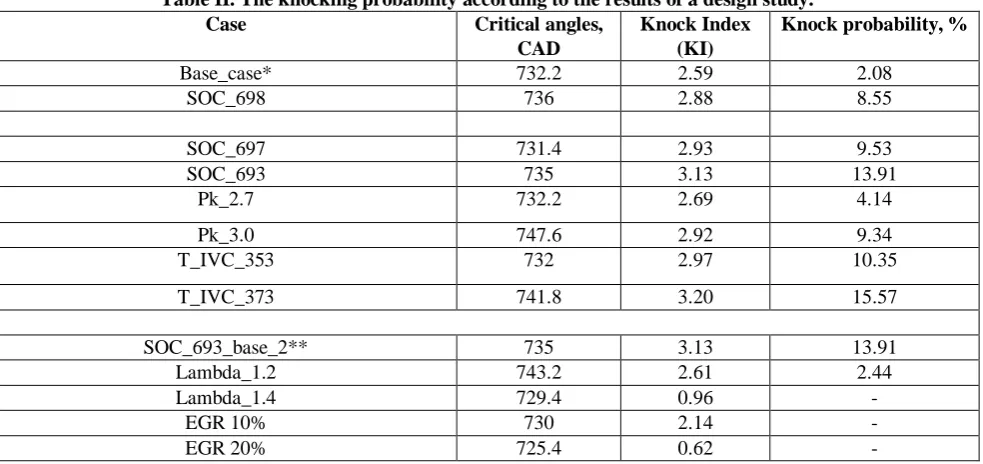
Table II. The knocking probability according to the results of a design study.
Case Critical angles,
CAD
Knock Index (KI)
Knock probability, %
Base_case* 732.2 2.59 2.08
SOC_698 736 2.88 8.55
SOC_697 731.4 2.93 9.53
SOC_693 735 3.13 13.91
Pk_2.7 732.2 2.69 4.14
Pk_3.0 747.6 2.92 9.34
T_IVC_353 732 2.97 10.35
T_IVC_373 741.8 3.20 15.57
SOC_693_base_2** 735 3.13 13.91
Lambda_1.2 743.2 2.61 2.44
Lambda_1.4 729.4 0.96 -
EGR 10% 730 2.14 -
EGR 20% 725.4 0.62 -
*Base_case – SOC = 19 CAD before TDC, Pk=2.3, Air fuel mixture temperature = 328 K, air excess ratio = 1, EGR 3%. **SOC_693_base_2 – SOC = 27 CAD before TDC, Pk=2.3, Air fuel mixture temperature = 328 K, air excess ratio = 1, EGR 3%.
Table II shows that advanced ignition timing increases the KP. So with SOC of 19 CAD before TDC, the KP is 2.08%, which corresponds to the normal combustion condition. At the value of SOC equal to 22 CAD before TDC the KP is 8.55%, as this condition is investigated and evaluated on the test bench, so it can be defined as a transition condition between the normal combustion and knocking combustion.
With a value SOC equal to 23 CAD before TDC, the KP increases to 9.5% and at 27 CAD before TDC – up to 13.91%. An increase in pressure rise ratio in the compressor of a turbocharger to 2.7 and 3.0 also increases the KP to 4.14% and 9.34%, respectively. The parameter that has the greatest influence on increasing the KP is the temperature of the air-fuel mixture (air-fuel mixture in the cylinder of the engine at the IVC). Thus, the air-fuel mixture temperature increase by 25 and 45 degrees raises the KP to 10.35% and 15.57%, respectively.
Comparison of the effect of the air excess ratio and the EGR ratio on the reduction in the KP was carried out according to the value of the KI since the obtained values of the KP are negative and have no physical meaning. Increasing the air excess ratio from 1 to 1.2 and 1.4 reduces the KI from 3.13 to 2.61 and 0.96, respectively. Increasing the EGR to 10% and 20% reduces the KI to 2.14 and 0.62, respectively. It should be noted, that according to the parameter of the KI, the boundary of knocking combustion occurs at the value of 2.88 or higher. When the air-fuel mixture is lean, air excess ratio is 1.2, it is possible to achieve a non-knocking combustion. It is important that EGR ratio is a more efficient method to reduce the KP.
The created numerical three-dimensional model of a SI gas engine adequately describes the combustion process and the tendency for the adjustment parameters to influence on KP. The technique developed and tested based on this model makes it possible to assess the degree of knocking, knocking probability and the knocking border condition, which is suitable for the numerical study of the SI engine combustion process and for assessing the influence of adjustment
parameters on the combustion process in general. It should be borne in mind that the border of knocking can differ both for engines for various purposes and engines running on different fuels. To assess the adequacy of this model from this point of view, it is necessary to carry on further investigation of combustion process both via simulation and on the test bench to accumulate the necessary amount of statistical data.
IV. CONCLUSION
• A method was developed for assessing the knocking combustion of a SI gas engine on a test bench using an indicating equipment.
• The value of the parameter KP_PK was determined, at which the boundary condition between normal and knocking combustion is observed, which amounted to about 3 bars for a given type of fuel and engine.
• A three-dimensional numerical model of a heavy duty SI gas engine, which adequately describes the combustion process, was created and verified according to the results of the experiment.
• Based on the verification results of the three-dimensional numerical model in two operating conditions, the KP corresponding to the transition mode of combustion from normal to knocking, which was 8%, was determined.
• A computational optimization study of the influence of various adjustment parameters on the combustion process and the KP of a SI gas engine was carried out. The results obtained make it possible to monitor the tendency toward a change in the KP.
ACKNOLEDGMENT
Funding: The paper was prepared under the agreement No. 14.626.21.0005 with the Ministry of Education and Science of the Russian Federation
International Journal of Innovative Technology and Exploring Engineering (IJITEE) ISSN: 2278-3075,Volume-8 Issue-12, October 2019
REFERENCES
1. H. Chena, J. He, and X. Zhongb, “Engine combustion and emission fuelled with natural gas: A review”. Journal of the Energy Institute, vol. 92(4), 2019, pp. 1123-1136.
2. J. Liu, C. E. Dumitrescu, “Flame development analysis in a diesel optical engine converted to spark ignition natural gas operation”. Applied Energy, vol. 230, 2018, pp. 1205-1217.
3. J. Liu, C.E. Dumitrescu, “Single and double Wiebe function combustion model for a heavy-duty diesel engine retrofitted to natural-gas spark-ignition”. Applied Energy, vol. 248, 2019, pp. 95-103.
4. Z. Wang, H. Liu, R.D. Reitz, “Knocking combustion in spark-ignition engines”. Progress in Energy and Combustion Science, vol. 61, 2017, pp. 78-112.
5. J.C. Firey, “A Detonation Wave Theory of Gasoline Engine Knock”. Sixth Symposium (International) on Combustion, 1957, pp. 878-885. 6. D.H. Cuttler and N.S. Girgis, “Photography of Combustion During
Knocking Cycles in Discs and Compact Chambers”. Society of Automotive Engineers, SAE Paper no: 880195, 1988.
7. S. Curry, “A Three-Dimensional Study of Flame Propagation in a Spark Ignition Engine”. Society of Automotive Engineers Transactions, vol. 71, 1963, pp. 628-650.
8. S. Curry, “Effect of Antiknocks on Flame Propagation in a Spark Ignition Engine”. Ninth Symposium (International) on Combustion, 1963, pp. 1056-1068.
9. G. Konig, and C.G.W. Sheppard, “End Gas Autoignition and Knock in a Spark Ignition Engine”. Society of Automotive Engineers. SAE Paper no: 902135, 1990.
10. U. Spicher, H. Kroger, and J. Ganser, “Detection of Knocking Combustion Using Simultaneously High-Speed Schlieren Cinematography and Multi Optical Fiber Technique”. Society of Automotive Engineers, SAE Paper no: 912312, 1991.
11. T. Hayashi, M. Taki, S. Kojima, and T. Kondo, “Photographic Observation of Knock with a Rapid Compression and Expansion Machine”. Society of Automotive Engineers, SAE Paper no: 841336, 1984.
12. “AVL Indicom User Guide”.
13. S. Seref, “Autoignition modeling of natural gas for engine modeling programs: an experimental and modeling study”. Ph.D. Thesis. 2001. 14. Y. Xu, “Entwicklung eines Applikationswerkzeugs zur Parametrierung
der Klopferkennung im Verbrennungsmotor”. Zur Erlangung des akademischen Grades Master of Science der Fakultät für Elektrotechnik und Informatik der Technische Universität Berlin im Februar 2013. 15. E. Pipitonea, G. Genchia, and S. Beccaria, “An NTC zone compliant
knock onset prediction model for spark ignition engines”. Italy Energy Procedia, vol. 82, 2015, pp. 133–140.
16. D. Esposito, “Torque model calibration of a motorcycle internal combustion engine”. Anno Accademico 2017/2018.
17. “Subaru Knock Monitoring FAQ Last Updated: 6/30/2011”.
18. H. Liu, Zh. Wang, Yu. Qi, X. He, Y.Wang, and J. Wang, “Super-knock suppression for highly turbocharged spark ignition engines using the fuel of propane or methanol”. Energy. vol. 169, 2019, pp. 1112-1118. 19. “ICE Physics & Chemistry, AVL FIRE user Manual v.2018.
20. P. Priesching, M. Bogensperger, and A. Poredos, “Detailed Investigation of Knocking Combustion in Spark Ignited Engines by CFD Methods”. SIA Powertrain – Versailles, 2015.
21. S. Beccari, E. Pipitone, and G. Genchi, “Knock onset prediction of propane, gasoline and their mixtures in spark ignition engines”. Journal of the Energy Institute, vol. 89(1), 2016, pp. 101-114.
22. L. Chen, J. Pan, H. Wei, L. Zhou, J. Hua, “Numerical analysis of knocking characteristics and heat release under different turbulence intensities in a gasoline engine”. Applied Thermal Engineering, vol. 159, 2019.
23. Zh. Gong, L. Feng, and Z. Wang, “Experimental and numerical study of the effect of injection strategy and intake valve lift on super-knock and engine performance in a boosted GDI engine”. Fuel, vol. 249, 2019, pp. 309-325.
24. G. Rodrigues de Souza, C. de C. Pellegrini, S.L. Ferreira, F.S. Pau, and O. Armas, “Study of intake manifolds of an internal combustion engine: A new geometry based on experimental results and numerical simulations”. Thermal Science and Engineering Progress, vol. 9, 2019, pp. 248-258.
25. Z. Yue, and R.D. Reitz, “Numerical investigation of radiative heat transfer in internal combustion engines”. Applied Energy, vol. 235, 2019, pp. 147-163.