Determination of copper metals in leachate
using potentiometric method by concentration
cells
Suheryanto1,*, Zainal Fanani1, Dewi Jayanti1
1Department of Chemistry, Faculty of Mathematic and Natural Sciences, Sriwijaya University
Abstract.The potentiometric method of cell type concentration is used to analyze the copper metal in leachate. This method is relatively good because it has a correlation coefficient of 0.9997 and linear region in the concentration range 1x10⁻⁵ - 1x10⁻³ mol L-1. The precision of this potentiometric method is low because the persent of RSD produced is 0.6% with an average accuracy 0f 95.35%. The detection limit (LoD) of the measurable method is 1.085x10⁻⁶mol L-1with LoQ 1.313x10⁻⁶mol L-1. While the LoD instrument 1.217x10⁻⁶ mol L-1and LoQ 1.560x10⁻⁶mol L-1. In addition, this method is very selective with the selectivity coefficient of -3.7 and it has uncertainty of measurement 9.7x10⁻⁷ ± 1.282x10⁻⁶ to 9.12x10⁻⁵± 3.5x10⁻⁵. Potentiometric method of cell type of concentration
has an optimum condition at pH 5 and temperature 30˚C.The conditions of
copper in leachate water renged from 9.253x10⁻⁵ to 8.696x10⁻⁴ mol L-1
Keywords: potentiometric, copper, leachate, concentration cell
1.
Introduction
Leachate is a black waste water absorption containing organic and inorganic chemicals and a number of pathogenic or non-pathogenic bacteria that mutually decompose. Leachate water has the potential to contain heavy metals such as copper (Cu), lead (Pb), cadmium (Cd), mercury (Hg), arsenic (As), silver (Ag) etc. Copper is one of the heavy metals requires proper handling. Even in low-dose environments of about 1 mg/kg still have a toxic effect when inhaled in large amounts (3-4 mg/kg).
Several analytical methods such as atomic absorption spectrometry or AAS (Atomic Absorption Spectrophotometry), UV-Vis spectrometry and inductively coupled plasma (ICP) are used to define copper metals at low concentrations widely used in analyzing heavy metals in the environment is the potentiometric method. In addition, the method also requires complex time and samples.
Potentiometry is part of an electrochemical analysis technique, where there is a potential measurement of two electrodes at a current equal to zero. Potentiometric methods can determine the activity coefficients, pH values, dissociation constants and product solubility, standard affinity and chemical reactions. The advantage of this method is to have a wide range of concentrations (10-7 – 1 M); 0.1 – 5.0 % precision, easily essembled instrument,
*
low cost, adequate selectivity, low detection limit, high accuracy and can be used in color and cloudly solutions. In addition the potentiometric method allows the determination of heavy metals simultaneously between metals with each other.
In this research, the determination of copper metal in leachate water using potentiometric method based on cell concentration where a cell of two half cell consist of the same material but different ion concentration.
2.
Recent Condition
Fig. 1. Potentiometric circuits based on concentration cells
Analysis of copper metal in leachate water by potentiometric method using richmeter 102 to measure potential and copper metals as electrodes. All reagents were of analytical reagent grade. Demin water (0.9 µs conductivity) was used for all dilutions. The standard solution used for calibration is CuSO4.5H2O were prepared by diluting stock solutions of 0.1 mol L-1of each element.
2.1.
Method Validation
Standard copper solutions that have been prepared with concentrations of 1.0 x 10⁻⁵ mol L-1 to 1.0 x 10⁻³ mol L-1were measured potentiometrically by potentiometric method and made calibration curve and determined linear regression and linear equations to see slope and intersept values. The detection and quantification limits of the instrument are determined by measuring the potential blank of demin water as much as 10 repetitions. While for LoD method was determined by measuring the potential of standard solution with concentration of 1.0 x 10⁻⁵ mol L-1 to 1.0 x 10⁻³ mol L-1. Determination of accuracy in analyzing copper metal with potentiometric method used spike method. Standard solution with concentration of 2x10⁻⁴ mol L-1, 4x10⁻⁴mol L-1 and 1x10⁻³ mol L-1 was added with leachate sample and potential measurement was done to the three spikes and calculated the value of accuracy using percent recovery. The precision of the method is determined by measuring the potential of a standard copper solution 6x10⁻⁵mol L-1concentration by 10 repetitions under the same conditions and time. Precision is determined by calculating the RSD value. The main ions (Cu) in CuSO4.5H2O are made of three different concentrations of 1x10
-5
mol L-1, 1x10⁻⁴mol L-1 and 1x10⁻³ mol L-1 mixed with foreign ions such as Cd2+, K and Fe2+ with concentrations same. Then measured the potential of using multimeter and calculated the coefficient of selectivity.
To determine the optimum condition of a method, there are two variables in this research that is pH and temperature. To see the effect of pH on the electrode response, the potential was measured at a concentration of 1x10⁻⁴ mol L-1with a pH of 3-8 and a scale of 1 each. The pH variations of (3-8) are made by adding nitric acid (HNO3) or sodium hydroxide (NaOH). The effect of temperature on the potentiometric method was measured at a
controlled by thermometer at different temperatures ranging from 20, 30, 40, 50 and 60˚C.
3.
Results and Discussions
Fig. 2. Calibration curve of copper standard solution
Based on the calibration curve in Fig. 2, there is obtained a linear region in the concentration range of 1x10⁻⁵to 1x10⁻⁵mol L-1. The slope value obtained from this study is 1.0125. This indicates that the slope is obtained in accordance with the set so that the method used has a good sensitivity. The detection limit is divide into two types: instrument detection limits and methods. Based on the calculation, obtained the instrument LoD value of 1.217x10⁻⁶mol L-1or 0.077 mg L-1and LoQ 1.560x10⁻⁶mol L-1or 0.099 mg L-1. In the LoD method obtained values of 1.085x10⁻⁶ mol L-1 or 0.069 mg L-1 and LoQ 1.313x10⁻⁶ mol L-1or 0.083 mg L-1. The precision value is 0.6 %. This indicates that the potentiometric method used in this study has good repeatability and accuracy. Accuracy value is obtained by calculating percent recovery. At concentration spike 2x10⁻⁴ mol L-1 obtained percent recovery 92.1 %, while for concentration 4x10⁻⁴mol L-1and 1x10⁻³mol L-1are 97.75% and 96.2 %. So the average percent recovery method of potentiometry based on cell concentration is 95,35 %. Percent recovery is not full 100 percent due to filtration process so that the components in the leachate sample and potential decrease.
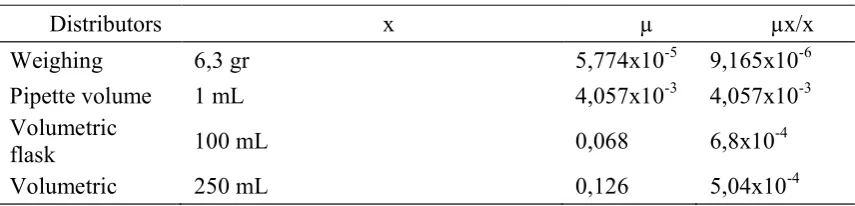
[image:3.595.200.408.227.375.2]Based on table 1, the calibration curve in pond 5 gives the largest contribution in the measurement uncertainty. Measurement uncertainty of copper metal in leachate ranges 9.12x10⁻⁵ ± 6.7x10⁻⁶ mol L-1to 9.7x10⁻⁷ ± 8.5x10⁻⁷ mol L-1.
Table 1.Contributors of uncertainty of measurement copper in leachate pools
Distributors x µ µx/x
Weighing 6,3 gr 5,774x10-5 9,165x10-6
Pipette volume 1 mL 4,057x10-3 4,057x10-3
Volumetric
flask 100 mL 0,068 6,8x10
-4
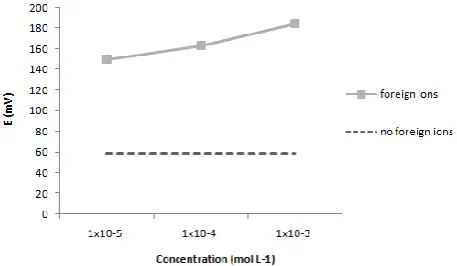
[image:3.595.81.509.682.785.2]In determining the selectivity of a method, the effect of foreign ions on the main ions is used. Figure 3 illustrates the addition of foreign ions together such as Cd, K and Fe in the main solution of Cu in three different concentrations
Fig. 3. The effect of the combined foreign ions on the cell potential
[image:4.595.180.414.631.704.2]Based on the resulting graph, the potential value of the foreign ion is far from the potential value of copper in the absence of a foreign ions. If the concentration increases the greater the distortion generated by the discruptive ions. However, it does not affect the primary ion of copper because the resulting Kijvalue <1 as described in table 1 below.
Table 2.Ki,jvalues of combined foreign ions to main ions
Concentration (mol L-1) Ki,j Values
1x10⁻⁵ -10
1x10⁻⁴ -1
1x10⁻³ -0.1
Different temperatures will affect the electrode used so that the slope value and ionic activity will be affected. A temperature of 30˚C is an optimum condition because it is very close to the theoretical Nernst value. At a low temperature of 20˚C it provides a potential price deviating from the theoretical Nernst value. This is because at a low temperature, the solubility is smaller so that the potential produced is not Nernstian. High temperature changes from 40-60˚C can increase mobility or ion
flask
Precision 0,192 0,192
Acuraccy 95,35% 1,907 0,02
Cx(1) 55,3 mg L
-1
or 8,696x10-4mol L-1 0,392 7,089x10-3
Cs(1) 9,12x10⁻⁵ mol L-1
Cx(2) 6,197 mg L
-1
atau 9,751x10-5mol L-1 0,357 0,058
Cs(2) 1,023x10
-5
mol L-1
Cx(3) 3,995 mg L
-1
atau 6,2866x10⁻⁵mol/L 0,392 0,089
Cs(3) 6,593x10
-6
mol L-1
Cx(4) 2,852 mg L
-1
atau 4,488x10-5mol L-1 0,356 0,125
Cs(4) 4,71x10
-6
mol L-1
Cx(5) 0,588 mg L
-1
atau 9,253x10-6mol L-1 0,372 0,632
Cs(5) 9,7x10
-7
movement because the kinetic energy generated from the ion will increase so that the higher potential will be produced. Figure 4 shows the affect of temperature on potential.
Fig. 4. Effect of temperature on cell potential
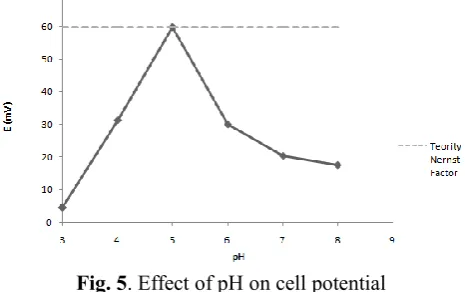
Figure 4 shows the effect of pH on the cell potential. At pH 3 and 4 the potential value is not so good, this is due to the presence of H+ions affecting the potential caused by Cu2+ so that its activity is not compatible in the test solution. The excess of H+ ions will affect the equilibrium in a solution having a low pH where the equilibrium will shift so that the electode’s ability to interact with Cu2+
[image:5.595.190.423.445.591.2]ions is less and the ability to respond to Cu2+ ions. The condition at pH is the optimum condition because the potential yield is close to the theoretical Nernst value. At pH 6-8 it shows the increasingly descending potential of the theoretical Nernst because of the excess of the OH-ions resulting in hydrolysis. In addition, excess OH will result in precipitation of the metal to Cu(OH)2, thus interfering with potential measurements of standard copper solutions. Figure 5 illustrates the effect of pH on the cell potential
Fig. 5. Effect of pH on cell potential
[image:5.595.138.444.660.776.2]The concentration of copper in leachate obtained ranged from 9.253 x 10⁻⁵to 8.696 x 10⁻⁴mol L-1. Table 3 describes the levels of copper metal in leachate pools 1 to 5.
Table 3. Copper content in leachate water
No Location Cu (mol L-1)
1 The first pool 8.696x10⁻⁴
2 The second pool 9.751x10⁻⁵
3 The third pool 6.2866x10⁻⁵
5 The fifth pool 9.253x10⁻⁵
The first pool has the highest copper metal content because it is the first stream of leachate flow so that the components of the pool are still very complex. While in the fifth pool, the copper content in the place is the smallest because the metal content and other components have been reduced.
4.
Conclusion
Potentiometric methods based on concentration cells used in analyzing copper metal in leachate have good validation results. In its use, the method has an optimum condition where the measuring limits can be used under certain conditions such as pH 5 and temperature 30˚C. Potentiometric methods based on cell concentration were also successful in determining the concentration of leachate samples.
References
1. Anonim. (2009). Way of Lead Test (Pb)by Atomic Absorption Spectrophotometry (SSA-Flame). Jakarta : National Standardization Agency.
2. Anonim. (2008). Water and Wastewater - Section 59: Sampling Methods Wastewater.
Jakarta : National Standardization Agency.
3. Arias. (2015). Electrochemical Cells Experiment 7. Los Angeles: Los Angeles Harbor College.
4. Fardiyah, Q., Rumhayati, B., Rosemiyani, I. (2015). Effect of Ion Na+, Na+ Ion and Na+ Ion Against Potential Correction Performance of Lead Ion (II) Coated Wire Type Based Pirofilit. Journal of Chemical Valence: Journal of Research and Development, 1(2),80-83.
5. Fifield, F.W and Kealey, D. (2000). Principles and Practice of Analytical Chemistry Fifth Edition. United Kingdom : Blackwell Science Ltd.
6. Frag, E.Y.Z., Ali, T.A., Mohamed, G.G and Awad, Y.H.H. (2012). Construction of Different Types of Ion-Selective Electrodes, Characteristic Performances and Validation for Direct Potensiometric Determination of Orphenadrine Citrate.
International Journal of Electrochemical Science, 7(1),4443 - 4446.
7. Ganjali, M.R., Aghabalazadeh, S., Khoobi, M., Ramazani, A., Feroumadi, A., Shafiee, A and Norouzi, P. (2011). Nanocomposite Based Carbon Paste Electrode for Selective Analysis of Copper. International Journal Electrochemical Science, 6(1),52-62. 8. Isa, I.M., Sohaimi, N.M., Hashim, N., Kamari, A and Mohamed, A. (2013).
Determination of Salicylate Ion by Potentiometric Membrane Electrode Based on Zinc Aluminium Layered Double Hydroxides-4 (22,4-dichlorophenox) Butyrate Nanocomposites. International Journal of Electrochemical Science, 8, 2112-2121. 9. Khani, H., Rofouei, M.K., Arab, P., Gupta, V.K and Vafaei, Z. (2010). Multi-Walled
Carbon Nanotubes - Ionic Liquid - Carbon Paste Electrode as a Super Selectivity Sensor: Application to Potentiometric Monitoring of Mercury Ion (III). Journal of Hazardous Materials, 18(3),402-409.
11. Purwanto, A., Supriyanto, C., and Samin, P.( 2007). Test Validation of Cr, Cu, and Pb with Atomic Absorption Spectrometry Method. Prosiding PPI-PDIPTN. BATAN, 151-158.
12. Styarini, D. (2011). Validation of Chemical Analysis Methods. News of Analytical Chemistry, 19,24-29.
13. Tandiayu, R. (2006). Optimization of PVC Based Membrane Composition with
Ionofor N,N’-Dibensil-1,4,10,13-Tetra-Oksa-7,6-Diaza-Siklooktadekana for Making
ESI-Cd (II). Essay. Makassar : Hasanuddin University
14. Thahir, S.Y., Atikah and Fardiyah, Q. (2013). Effect of pH and Temperature on The Rhodamin B Potentiometic Based Potential Sensor. Chemistry Student Journal,