International Journal of Innovative Technology and Exploring Engineering (IJITEE) ISSN: 2278-3075,Volume-8 Issue-6, April 2019
Abstract: CFD analysis of the flow field around four different automotive rear spoiler configurations is carried out to determine the best amongst them, for the purpose of reducing the drag as well as improving the negative lift on the vehicle. A spoiler is the additional fixture, generally placed either on the front or rear side of vehicle to maneuver the flow field, to destroy wake zones and create downward force thereby reducing pressure drag and enhancing the negative lift force. This results in reduced fuel consumption and better traction of the vehicle. The four different spoilers arrangements considered in the present study are single spoiler, linear multispoiler with horizontal offset of 0.2 units. Multispoiler with aft spoiler at bottom, multispoiler arrangement with aft spoiler on the top with vertical offset of 0.2 units. CFD results revealed that multispoiler configuration with aft spoiler produces least drag while multispoiler with aft spoiler on the bottom gives the best traction.
Index Terms: CFD, Drag, Multi-spoiler, Turbulence
I. INTRODUCTION
Flow structure and stability of a car cruising at higher speeds depends on the position of the spoiler and air dams. The effect of addition spoilers is more than the air dams on the stability and flow field behavior. CFD plays a vital role in the evaluation of the spoiler performance. Aero-acoustic stability is the another aspect associated with the rear spoiler and Chien-Hsiung Tsai et al. [1] have developed new methodology to study the aero-acoustic behavior by performing steady state flow analysis utilizing the capabilities of turbulent model. Attaching a spoiler leads to the fluctuation in the pressure field leading to flow
disorderliness.
Society of Automotive Engineers (SAE) INDIA, which strives to develop user-friendly, eco-friendly, and slender open chassis vehicles conducts design championships to encourage students to innovate and use cutting edge technologies to develop new generation sports cars. Sneh -hetawal et al. [2] have performed numerical simulation on open wheel formula-style car with rear and front spoiler with firewall vents, with turbulence model to analyze the aerodynamic performance of the new model
Revised Manuscript Received on April 07, 2019.
T. Anup Kumar*, Professor, Department of Mechanical Engineering, Koneru Lakshmaiah Education Foundation, Guntur,
Noble Sharma, Postgraduate student, Department of Mechanical Engineering, Koneru Lakshmaiah Education Foundation, Guntur
B. Naveen, Undergraduate student, Department of Mechanical Engineering, Koneru Lakshmaiah Education Foundation, Guntur.
Y. Jaswanth, Undergraduate student, Department of Mechanical Engineering, Koneru Lakshmaiah Education Foundation, Guntur
B. Vinay Kumar, Undergraduate student, Department of Mechanical Engineering, Koneru Lakshmaiah Education Foundation, Guntur
K. V. Ramoji Naidu, Undergraduate student, Department of Mechanical Engineering, Koneru Lakshmaiah Education Foundation, Guntur
Rubel Chandra das et al. [3] have performed numerical analysis to analyze the performance of car with rear end spoiler. In their study, six set of spoiler height and angle of attack were considered for the performance evaluation. It was observed that for a specified height of spoiler, drag force will be maximum when the angle of attack is minimum owing to the re-circulation zones created behind the spoiler. Commercially available CFD tool in Autodesk was used rather than the orthodox ANSYS fluent. Another class of affordable open wheel race car is Formula Mazda. They are used profoundly in North America pro Mazda championship. In order to provide an insight on the pressure distribution, Lift and drag profiles on the vehicle with a front and rear spoiler W. Kieffer et al. [4] have performed numerical simulation on a 2-D car model using Star CD commercial CFD code with additional subroutines. Analysis was performed with different angles of attack, it was reported that ground effects had a profound influence on coefficient of lift and drag, which was a unique aspect not reported earlier. Drag reduction is also a key aspect for the racing cars, nearly 70% of the fuel is used to overcome the adverse aerodynamic force. In order to reduce the drag streamlining of the flow is needed, which can be achieved in many ways. Rakibul Hassan et al. [5] have performed numerical simulation to reduce drag by attaching rear end spoiler with different aspect ratio. Favre-averaged Navier-Stokes equations along with
turbulence model was used to obtain the pressure and velocity distribution at the rear end spoiler. Another important aspect of exhaust jet impingement on the rear end of the with local flow separation zones. Of the known ways to reduce the drag by delaying the transition of the flow from laminar to turbulence active flow control is widely cited in literature owing to its supremacy over other traditional techniques. DLR abbreviated for German aerospace center, performs experimental investigation on bluff bodies to enhance aerodynamic performance. F.R. Grosche et al. [6] has reported some of the works performed at DLR pertaining to aerodynamic optimization of high speed train, shape optimization for optimal performance, aerodynamic noise determination and active flow separation. Experimental setup and procedure was presented along with challenges in measurements.Shape memory composites which is new trend in the material science was used by Min-Woo Han et al. [7] to study the aerodynamic performance of the spoiler made of woven type smart soft composite (SSC). The SSC contained SMA wires interwoven to provide sufficient bending with less stiffness. These spoilers once they experience bending due to air loads, comes back to their original shapes, also termed as morphing spoilers in literature. Experimental studies was performed on morphing spoiler and normal spoiler.
Performance Evaluation of Multi-Spoiler with
Different Configurations using Cfd
It was reported that, morphing spoiler increases the downward lift by 45% and subsequently an increase in 15% of drag owing to its bending motion.
II. PROBLEM DESCRIPTION
Rear spoilers, purpose is to increase the negative lift of the vehicle so as to remain in contact with the road while cruising at higher speeds. The general location of an orthodox rear spoiler is shown in Fig. 1. Spoilers perform the two functions of assisting the car at higher speeds by increasing drag to avoid side slipping and to maintain the traction between the car and the surface. An orthodox spoiler is attached to the car with the help of pylons i.e. supporting structural system.
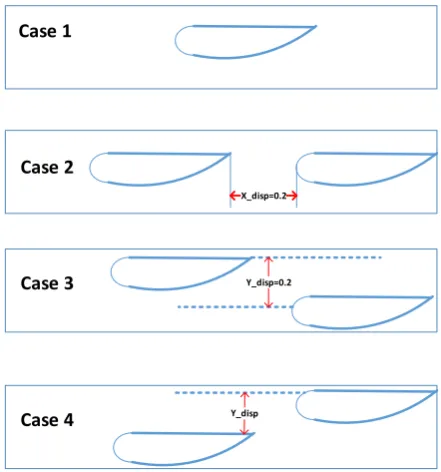
In the present study, twin spoiler arrangement is analyzed with NACA S-1224 low Reynolds number high lift airfoil as the spoiler. Different arrangements of the aft spoiler are considered in the analysis. For a specific arrangement of aft spoiler, performance parameters namely lift, drag and lift-to-drag ratio are evaluated. The different arrangements of aft spoiler considered in the present study are shown in Fig. 2
[image:2.595.328.535.61.196.2]Case 2 Case 1 Case 3 Case 4 X_disp=0.2 Y_disp=0.2
Fig. 2 Case studies considered in present study
2-D flow over the airfoil is considered in the present study. The boundary conditions specified are presented in Fig. 3.
III. MATHEMATICAL DESCRIPTION
The fluid flow behavior around the spoiler can be described by two governing equations namely continuity and momentum equations.
The continuity equation for a finite-sized control volume in differential form is given as
Eq. (1)
where t is the time, is the coordinate axes and is the velocity in the direction of and λ is the density of the fluid considered.
Whenever fluid flows over a surface due to viscous effects, airfoil experiences normal and tangential forces. These forces and their influence can be evaluated by momentum equation also known in literature as Navier-Stokes (N-S) equation. The N-S equation is given as:
Eq. (2)
where P is the pressure distribution, is the dynamic viscosity, is the resolution of body force in direction. The velocity components obtained from the continuity equation must satisfy the N-S equations.
Since, most of the cars move at high speeds, presence of turbulence is inevitable. In order to account for the turbulence the total viscosity is approximated as a summation of turbulent and laminar viscosities.
From the literature it is found that turbulent model is widely accepted and used in industrial applications [1]. Even though large eddy simulations (LES) model which yields better results and is easier to model than model, is however time consuming and hence model is used in the present study.
A. Turbulence model
The general procedure to account for turbulence involves the development of Reynolds Averaged Navier Stokes (RANS) equation, which is obtained by applying time averaging to the Navier Stokes equation and is given as
Rear Spoiler
Free stream air
[image:2.595.47.281.229.361.2]Lift -ve Lift
Fig. 1 Problem description
[image:2.595.49.270.485.721.2]AIR FOIL Far field V el o cit y In le t P res su re In let Far field Computational domain
International Journal of Innovative Technology and Exploring Engineering (IJITEE) ISSN: 2278-3075,Volume-8 Issue-6, April 2019
Eq. (3)
In the Eq. (3), the caps on the variable represents the time averaged quantities and is the shear-stress tensor. The behavior of eddies in the flow is governed by Reynolds-Stress tensor and difficulty lies in the non-existent macroscopic terms to model it. In order to get a solution to the Eq. (3), Reynolds-Stress term is modeled utilizing the
model. In the two equation model, the turbulent viscosity is related to the turbulent kinetic energy ( ) and the rate of dissipation of the eddy’s energy ( ) and is given as
Eq. (4)
From [1], the compete mathematical description of
is given as
Eq. (5) Eq. (6)
Here , are to be found empirically. The other terms in the above equation are found using the equations
Eq. (7) Eq. (8) Eq. (9) Eq. (10) Eq. (11)
where is the shearing tensor, and is the body force in the direction. The coefficients needed in the model are to be fed in the ANSYS fluent. In the present study, default values suggested by ANSYS fluent are taken into consideration.
IV. RESULTS AND DISCUSSION
In the present study, the computational fluid analysis was performed on the twin spoiler arrangement to visualize the flow behavior and to evaluate the performance index lift to drag ratio. Four cases as stated in section (II) are analyzed. The stream line patterns, velocity contours, and pressure contours are presented for each case.
In the present study, NACA Selig-1223 i.e. low Reynolds number high lift airfoil is used. The co-ordinates of the airfoil are taken from airfoil tools [8]. ANSYS fluent is used to simulate the flow around the spoiler.
In the present study, negative of the lift has to be considered, since the spoiler arrangement modelled in simulation, are
opposite to the ones in the actual usage. The boundary conditions specified are as follows
Face Conditions
Inlet Specified velocity
(70Km/hr.)
Outlet Pressure outlet
Gauge pressure zero
Walls No-slip
Turbulent model
Turbulence intensity 5%
Density 1.225 (kgm-3)
Coupling Algorithm SIMPLE
A. Case 1
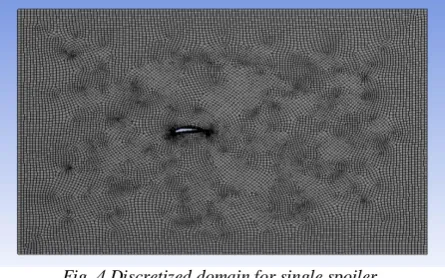
A single airfoil is used to simulate the external flow over its surface. The mesh model of the domain is shown in the Fig. 4. In order to capture the boundary effects, inflation of cells was used immediately adjacent to the airfoil surface. Unstructured mesh with quad elements is generated using the default meshing option in FLUENT. Hybrid initialization was performed along with SIMPLE algorithm to solve the semi implicit pressure linked equations.
[image:3.595.311.534.418.557.2]It is a well-known fact that when air flows over the airfoil surface, due to the camber of the airfoil, time taken by the particle to reach trailing edge from the leading edge along the upper surface will be more compared to the lower surface. Hence to reach the trailing edge the particles on the top surface move with higher velocities to compensate for time. As a result, the pressure on the top surface will be less and vice versa on the lower surface.
Fig. 4 Discretized domain for single spoiler
From Fig. 5 it can be seen that negative pressure (suction) occurs on the top surface and max pressure occurs on the bottom surface as a result, the net resultant pressure will be in the upward direction following Bernoulis principle. The intergral value of the pressure for domain gives lift and drag. The lift value is 298.942(N) and drag of 4.897(N).
Fig. 6, 7 represents the variation of the velocity in the domain. Maximum velocity occurs on the top surface since the pressure over there will be negative as seen from Fig. 5. A maximum velocity of 30.5 m.s-1 is observed for case 1.
B. Case 2
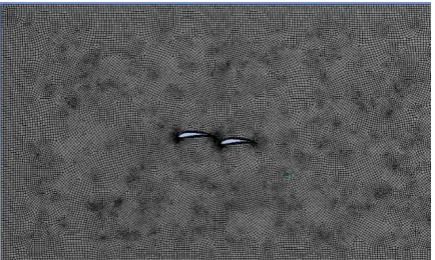
The domain is discretized with the quad elements using ANSYS auto mesh feature as stated in case 1. Inflation layers are also added around both the airfoils. The discretized domain is shown in Fig. 8.
[image:4.595.45.285.111.247.2]Fig. 5 Pressure contour for single spoiler configuration
[image:4.595.303.542.227.378.2]Fig. 6 velocity contour for single spoiler configuration
Fig. 7 Stream line pattern for single spoiler
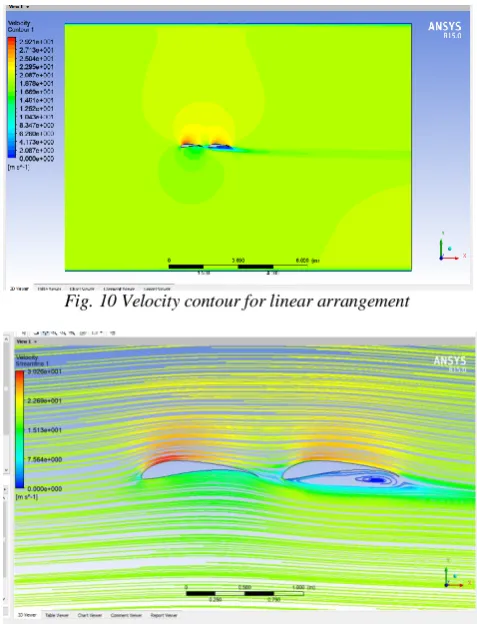
From Fig. 9, 10, it can be seen that minimum pressure occurs on the first airfoil and maximum pressure also occurs on the first airfoil. As a result maximum contribution of the lift is from the first airfoil.
Once the air passes over the first airfoil, it looses a part of energy and the remainig available energy will move the flow forward over the second airfoil.
A. Case 3
The discretized domain is shown in Fig. 12. The discretization follows the details mentioned in case 1. Here the second airfoil is offset in both vertical and horizontal direction by 0.2 units.
Fig. 8 Discretized domain for linear arrangement
[image:4.595.53.277.287.412.2]Fig. 9 Pressure contour for linear arrangement
Fig. 10 Velocity contour for linear arrangement
[image:4.595.303.542.413.725.2] [image:4.595.47.275.453.592.2]International Journal of Innovative Technology and Exploring Engineering (IJITEE) ISSN: 2278-3075,Volume-8 Issue-6, April 2019
From Fig. 13 it can be analyzed that maximum pressure occurs on both the airfoils, unlike in case 2 i.e. Fig. 9. Here the loss of energy is lower than the previous case. As a result, lift is higher than the previous case owing to the contribution from both the airfoils.
[image:5.595.307.540.51.189.2]The velocity peak of 39(m.s-1) occurs on the bottom surface of the second airfoil. The lift and drag components are 518.43(N) and 18.184(N) respectively.
[image:5.595.48.266.156.286.2]Fig. 12 Discretized domain for linear with bottom arrangement
Fig. 13 Pressure contour for linear with bottom arrangement
Fig. 14 Velocity contour for linear with bottom arrangement
From stream line pattern in Fig. 15 it is clear that air passing over the first airfoil loses a part of its energy, with velocity reducing to 9 (m.s-1) from 39.12 (m.s-1). Due to the placement of second airfoil causing offset in vertical direction, the undisturbed flow forces the flow at the trailing edge of the first airfoil over the second thus re-energizing it.
Fig. 15 Stream line pattern for linear with bottom arrangement
This results in the generation of additional lift. In this case, both the airfoils contribute to the total lift of 518.43(N). But owing to the obstruction to the flow, there is an increase in drag of 2 units which can be quantified by the increase in lift by 25% when compared to case 2.
B. Case 4
The discretized domain for the second airfoil offset in the upward direction is shown in Fig. 16. The discretization follows the details specified in case 1.
[image:5.595.45.268.159.442.2]Fig. 17 represents the pressure contours. It can be seen that due to the offset of second airfoil in the upward direction, there is no reenergization of the flow to increase the lift as seen in the case 3. The air flows past the first airfoil and the velocity over the top surface is more and as a result, pressure will be low.
Fig. 16 Discretized domain for linear with top arrangement
[image:5.595.299.550.335.536.2]Fig. 17 Pressure contour for linear spoiler with aft top arrangement
[image:6.595.45.287.76.421.2]Fig. 18 Velocity contour for linear with top arrangement
Table 1 Lift, Drag and (Lift/Drag) ratios for different configurations
Spoiler arrangement
Drag(N) Lift(Negative Lift)(N)
(L/D)
Single spoiler
l4.897 298.942 20.067
Linear multi spoiler
15.085 417.18 27.655
Multi spoiler one is at bottom
18.184 518.43 28.510
Multi spoiler one
is at top
13.181 483.115 36.652
[image:6.595.315.551.250.413.2]Fig. 19, 20, 21 displays in bar chart the drag, negative lift and (L/D) ratios with the corresponding configurations of aft spoilers. It can be seen that the drag value is minimum in case of first configuration (single spoiler), while the negative lift is maximum in the case of the third configuration (Multi spoiler with aft spoiler at the bottom).
Fig. 19 Variation of drag for different cases
Fig. 20Variation of lift for different cases
Fig. 21 Variation of lift-to-drag ratio for different cases
V. CONCLUSION
[image:6.595.316.533.447.602.2] [image:6.595.41.288.488.633.2]International Journal of Innovative Technology and Exploring Engineering (IJITEE) ISSN: 2278-3075,Volume-8 Issue-6, April 2019
REFERENCES
1. C. Tsai, L. Fu, C. Tai, Y. Huang, and J. Leong, “Computational aero-acoustic analysis of a passenger car with a rear spoiler,” Appl. Math. Model., vol. 33, no. 9, pp. 3661–3673, 2009.
2. S. Hetawal, M. Gophane, B. K. Ajay, and Y. Mukkamala, “Aerodynamic Study of Formula SAE Car,” Procedia Eng., vol. 97, pp. 1198–1207, 2014.
3. R. Chandra and M. Riyad, “CFD Analysis of Passenger Vehicleat Various Angle of Rear End Spoiler,” Procedia Eng., vol. 194, pp. 160–165, 2017.
4. W. Kieffer, S. Moujaes, and N. Armbya, “CFD study of section characteristics of Formula Mazda race car wings,” vol. 43, pp. 1275–1287, 2006.
5. S. M. R. Hassan, T. Islam, M. Ali, and Q. Islam, “Numerical Study on Aerodynamic Drag Reduction of Racing Cars,” Procedia Eng., vol. 90, pp. 308–313, 2014.
6. F. Grosche and G. E. A. Meier, “Research at DLR G ottingen on bluff body aerodynamics , drag reduction by wake ventilation and active flow control,” vol. 89, pp. 1201–1218, 2001.
7. M. Han et al., “Woven type smart soft composite for soft morphing car spoiler,” Compos. Part B, vol. 86, pp. 285–298, 2016.