Abstract: Hyperspectral imaging is the vital method and an effective tool to quantify as well identify dissimilar objects from remotely recognized spectral information. Using OMEGA instrument, the Mars Region is imaged using an unprecedented spatial and spectral combination of resolution spectrometer. Hyperspectral images provide high resolution, and its spectral range gives the ability to identify chemical mixture in the atmosphere of Mars more precisely than before. Due to the inadequate spatial resolution of Hyperspectral sensors mixed pixel arises. Such mixed pixels contain more than one distinct material, which is called endmembers. These hyperspectral images provide good resolution, and the range of spectra will give the ability to identify the chemical species present in the atmosphere of Mars more accurately than before. The proposed methodology is evaluated on the real hyperspectral datasets. The integration of Unmixing algorithm termed “Non-Linear Hybrid Approach for Regularized Simultaneous Forward-Backward Greedy Algorithm (NonLHA-RSFBGA)” with the Singular Spectrum Analysis approach, resulting in a better level of classification using the ART classifier for the identification/classification of the Mineral endmember. The results of the proposed method for the classification of the endmembers in hyperspectral imagery is promising.
Index Terms: Endmember, Hyperspectral image classification, Mixed pixel, Unmixing
I. INTRODUCTION
Hyperspectral remote sensing is exploited over a broad area of appliances. Imaging a Hyperspectral data is a vital technique and a prominent tool to quantify as well as to identify distinct material substances from remotely observed spectral information. Using OMEGA instrument, the Mars Region imaged with the help of both spectral and spatial resolution spectrometer [1]. Hyperspectral sensors are employed for collecting two-dimensional spatial images over many adjacent spectral bands, which includes near-infrared, visible and shortwave, infrared spectral bands. Hyperspectral sensors are employed for collecting two-dimensional spatial images over many adjacent spectral bands, which includes near-infrared, visible and shortwave, infrared spectral bands. Due to inadequate spatial resolution of sensors of Hyperspectral data mixed pixel arises. Such mixed pixels contain distinct material which is more than one in a number called as endmembers. It is necessary to recognize an individual essential materials which are available in the mixture and also the proportions in which they appear. Endmembers usually correspond to the well-known objects in the picture, such as metal, soil, water or any other man-made or natural material. where the calculated spectrum
Revised Manuscript Received on May 05, 2019.
Nagarajan Munusamy, Department of Multimedia and Web Technology, KSG College of Arts and Science, Coimbatore - 641015, Tamilnadu, India.
Rashmi. P.Karchi, Department of Computer Science, Bharathiar University, Coimbatore-641046, Tamilnadu, India.
obtained from the mixed pixels present in the hyperspectral images are divided into a position of end members and collection of matching abundances or fractions, which represents the part of the data from the endmember present in the pixel. Several methods and techniques are presented by the remote sensing researchers for Unmixing of Hyperspectral data. Unmixing algorithms are classified into statistical, geometrical and regression of sparse based approaches [2]. A challenging task in the Unmixing of Hyperspectral data is to identify the endmembers automatically. When the mixed pixels arise among dissimilar land-cover class, the localization of pure signature of spectral is prevented. A probable approach to deal with this crisis is guiding the endmember identification process to partially homogeneous area, which contains the purest signatures accessible in picture. Several preprocessing methods are being used before identifying the endmember due to these above reasons. The processing of the Hyperspectral data usually requires a huge amount of resources for computational in terms of computation storage, and I/O throughputs, particularly when real-time processing is considered. For sparse Unmixing of Hyperspectral images, a new method called regularized simultaneous forward-backward greedy technique (RSFBGA) is depicted in this work [7] [9]. NonLHA-RSFBGA is more stable due to the combination of forwarding greedy step along with backward greedy step when compared to the usual greedy algorithms. It has low complexity in computation .The method is considered to be extremely effective as it enforce the coherences of spatial context between the Hyperspectral images while informing the resolution in every single of the iteration. In various applications, the linear Unmixing replica can be employed very easily and hence it is extensively utilized for the Spectral Unmixing. This replica makes an assumption that every pixels are a linear mixture of endmember, which is subjective through their equivalent great quantity fraction [10]. Unmixing approaches on statistics, geometry and the factorization of the nonnegative matrix will extract endmembers purely as of Hyperspectral information. Other hand, some of methods can be able to extract the essential endmembers by non physical import, and other believes that the attendance of at smallest amount one clean pixel per endmember in the data, which can generally complex to assure. In this paper, RSFBG Algorithm is formulated, which is on the forward-backward method [7]. It includes the benefits of both the backward and forward greedy algorithms[23]. Particularly, error caused by previous forward step are removed by carrying out backward steps in every iteration. The disadvantage of conventional greedy algorithms such as OMP is that it won‟t be able to correct the mistake done in previous
ladder and hence can be controlled in a limited
optimum. However,
Exploration of Unmixing and Classification of
Hyperspectral Imagery
RSFBGA can overcome this disadvantage. RSFBGA deals with simultaneous processes of complete Hyperspectral statistics rather than processing every pixel separately [11]. Hence, the error elevated through correlation of spectral records is improved by joint sparsity amongst every pixels present in Hyperspectral information. The proposed system is divided into two phases called testing and training. The preprocessing method on singular value decomposition (SVD) algorithm is employed. A novel approach termed “Non-Linear Hybrid Approach for Regularized Simultaneous
Forward-Backward Greedy Algorithm”
(NonLHA-RSFBGA) is used for data Unmixing of Hyperspectral. Several characteristics of Hyperspectral data. It also considers the combination of backward and forward greedy algorithms. Feature extraction is performed using singular spectrum analysis approach. Further these features are matched with knowledge base using ART Classifier. Series of real time models of the neural network is considered as the ART (Adaptive Resonance Theory), provides both supervise and unsupervised, prediction and detection, mainly with pattern recognition. Thus in the proposed system, the ART classifier are made to use for a better level of classification for input patterns.
The two major contributions of this paper are firstly, Regularized simultaneous forward-backward greedy technique is formulated on forward-backward technique. It has the advantages of both the backward and forward greedy algorithms. Particularly, mistakes caused through the previous forward stages are removed by backward stages, which can be carried out in iteration and also preserving a huge amount of possible endmembers are avoided. Classical greedy algorithms are having a drawback that the faults made in previous stages cannot be corrected and it can be trapped into a local optimum. NonLHA-RSFBGA can overcome this drawback by correcting mistakes. Secondly, in NonLHA-RSFBGA, while updating the solution, a regularizer is considered which enforces spatial-contextual coherence inside Hyperspectral picture. Hence, for selecting the actual endmembers accurately in the Hyperspectral image, NonLHA-RSFBGA can promote to utilize spatial contextual data. For analyzing the computational complexity and convergence of the proposed algorithm, theoretical results are presented. For more efficient Unmixing algorithms, the sub-library obtained by NonLHA-RSFBGA can be served as input for any other sparse. It means that NonLHA-RSFBGA can also work as a preprocessing stage along with effective sparse Unmixing algorithm.
The rest of the paper is organized into four sections: section 2 reviews the developments in unmixing and classification of the hyperspectral imagery. The proposed model of hyperspectral image classification and unmixing by using ART classifier is described in section 3. The experimental results and analysis are given in section 4. The section 5 concludes the proposed work.
II. REVIEW OF RELATED WORK
The processing of the hyperspectral imagery play a vital role in the domain of the remote sensing. The hyperspectral images provide high resolution, and its spectral range gives the ability to identify chemical class in the atmosphere. Many researchers presented techniques/algorithms to extract and quantify the spectral information[22,27] from the
hyperspectral images. Some of the techniques/algorithms are summarized here. Gabriel Martin et.al [3] developed a novel spatial spectral preprocessing (SSPP) element, is utilized prior to spectral Unmixing and endmember recognition. Then novel approach in this work is arrangement of spatial, as well as spectral statistics at preprocessing step. It also includes the preprocessing techniques that are combined with endmember identification algorithms[24]. The first step in this method is to derive a spatial homogeneity index for every pixel in the Hyperspectral image. The index obtained is moderately insensitive to the noise added in the data. Ultimately, the spatial and spectral information has to be fused by selecting a subset of spatially homogeneous and spectrally pure pixels from each cluster. For endmember identification, these pixels comprise the new set of candidates. Chen et.al [4] presented a spectral–spatial pre-processing technique by forecasting of Multihypothesis for enhancing the accurateness of the classification of the Hyperspectral image. Particularly, hypothesis set is derived from multiple spatially collected pixel vectors through the prediction for every pixel vector. Moreover, spectral-band dividing approach on the inter-band correlation coefficients can be presented for improving the representative power of hypothesis position. The consequential predictions can be efficiently used for integrating spatial and the spectral information and can uses classification in list of unique pixel vector.
Further, Chengbo Li et.al [5] presented the proof-of-concept revise on the sense of compressive Unmixing method for the data obtained from Hyperspectral processing. Where it does not involve storing or forming any data cube of full size. This approach consists of three important steps: data acquisition by compressive sensing, preprocessing of the Hyperspectral information using Singular Value Decomposition approach and data Unmixing by making an effort to solve a compressed Unmixing model. During the first stage, the author believes that the end member‟s spectral signatures are either accurately or approximately recognized. After preprocessing the data by SVD, have observed that the data to be processed become independent of the bands of spectra and the reduction in the size is reduced significantly. Validation is done experimentally using both measured data as well as synthetic data. Synthetic data has been obtained through the appliance comparable to single-pixel camera. Jun Li et.al [6] have presented the new system term minimum volume simplex analysis (MVSA) for the Hyperspectral data. This mixed vector of the data of Hyperspectral can formed through the combination of endmember signature subjective through the stringer abundance fraction linearly. The proposed technique of this work performs unmixing of the Hyperspectral data via appropriate the smallest volume consisting of abundance fraction which fit in to probability simplex. Up to date presentation of MVSA technique is illustrated in Unmixing the Hyperspectral data set. In this work, a practical scenario has been considered in the pure pixel supposition is not satisfied. Overall performance of the MVSA is much better compared to pure pixel based algorithms.
An efficient technique for Unmixing data of Hyperspectral on the basis of GNMF (Graph regularized Nonnegative Matrix Factorization) method with sparseness limitation is presented by Roozbeh
Rajabi et.al [7].
endmembers with abundance of fraction which refer to spectral Unmixing. Due to the presence of non-negative constraint on abundance fractions, NMF approaches are extensively utilized for resolving the spectral Unmixing difficulty. The algorithm employs simulated dataset using USGS library and AVIRIS Indian Pines dataset. Based on SAD with AAD procedures, outcomes are computed. Yoann Altmann et.al [8] introduced an Unmixing algorithm for data of Hyperspectral based on nonlinear mixing. This algorithm has also made the assumption that the pixel‟s reflectance is a nonlinear function of pure spectral components, which is corrupted by the addition of the additive white Gaussian noise. Using polynomial functions, the functions of nonlinearity are estimated resulting in a mixing model based on the polynomial post nonlinearity. A Bayesian algorithm and optimization methods are employed for calculating approximately the parameters which are concerned with respect to the model. The performance of the Unmixing approaches is estimated with simulation on actual as well as synthetic data.
Further, Jamie Zabalza et.al [12] proposed the latest method for series time analysis. The Singular Spectrum Analysis (SSA) which is used in several diverse areas. It is observed that the unique 1-dimensional signal is decaying into the amount of elements counting varying oscillations as well as the noise [19]. For effective feature extraction, SSA is applied to Hyperspectral imaging, which considers pixel based spectral profiles as a 1-dimensional signal. The discriminating ability of the features has been much improved, by removing noisy components in extracting the features. Liangpei Zhang et.al [13] presents an innovative method for both spatial and spectral feature extraction of the Hyperspectral images. In Hyperspectral image, the spectral–spatial characteristic of the pixel can be characterized as the second-order tensor. TDLA algorithm is also used for preserving the discriminability of the classes for classification by considering the discriminative position data in optimization. Ultimately, under the description of the tensor algebra, the extorted characteristic can obtain through multilinear conversion. This algorithm could preserve certain pixel‟s spatial constraints originally. TDLA algorithm can be illustrated as a comprehensive dimensionality reduction framework for high-order data. It also signifies that more generalized high-order feature can process through this framework openly.
The above mentioned literature review leads to include the benefits of both the backward and forward greedy algorithms for better classification in the proposed methods. A Bayesian algorithm and optimization methods conclude their paper by motivating towards better classifier. Such existing papers suggests to divert towards a better innovative classifiers. The proposed methodology of unmixing and classification of hyperspectral imagery is described in the next section.
III. PROPOSED METHODOLOGY
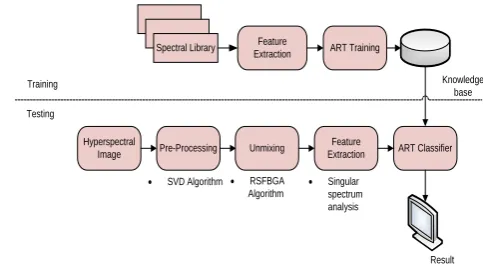
This section describes the proposed methodology/procedure designed for Unmixing and classifying Hyperspectral data. The proposed system is divided into two phases namely, Testing and Training phase. Training phase involves learning Hyperspectral data (Set of slices of 2D Image[20]) by extracting features using Singular Spectrum Analysis (SSA) and storing in the knowledge base. In the testing phase, the
Hyperspectral data is preprocessed by using Singular Value Decomposition (SVD) algorithm. Non-Linear Regularized Simultaneous Forward-Backward Greedy Algorithm (NonLHARSFBGA) is employed for Unmixing Hyperspectral images followed by feature extraction. These features are matched with already stored features in the knowledge base using ART Classifier as described in Figure 1.
Hyperspectral
Image Pre-Processing Unmixing ART Classifier Feature
Extraction Feature
Extraction ART Training Spectral Library
· SVD Algorithm· RSFBGA Algorithm
· Singular spectrum analysis
Knowledge base Training
Testing
[image:3.595.312.554.147.283.2]Result
Figure 1. Block Diagram of Proposed System for Unmixing and Classification of Hyperspectral Image
In
the training phase, the chosen spectral library from ORB0401_3 dataset taken from OMEGA Instruments covers spectral ranges of different mineral deposits. In this phase training of Spectral library with reflectance value of 'M' minerals for 'L' spectral band within the interval (0.8 – 2.5 µm) Aϵ RL×M are trained. It consists of deposits of iron oxides ranging from 0.9 µm to 1.3 µm. Hydrated Minerals having spectral feature at 1.4, 1.9 and 2.5 µm, Surpentines spectra having a very strong M shape duet absorptions at the 1.91 µm, Olivines spectra having spectral feature at 1 µm and other minerals spectral ranging from 0.2 to 2.02 µm. In the proposed work choosing of these 5 spectral signatures from the library of the spectra is done. The extraction of the features is done from these inputs using Singular Spectrum Analysis (SSA) method. These extracted features are trained and stored in knowledge base for further validation.Further in the testing phase, the inputs as hyperspectral data matrix by dimensions L (bands) x K (pixel) and spectral library matrix with dimensions L (bands) x M (spectra) is taken. Then are pre-processed using Singular Volume Decomposition algorithm. Significant reduction in complexity is made to facilitate the near real time processing speed. Unmixing of Hyperspectral data is done using Non-Linear Hybrid Algorithm for Regularized Simultaneous Forward-Backward Greedy technique (NonLHA-RSFBGA). On the basis of forward-backward trchnique, NonLHA-RSFBGA is formulated. Benefits of both backward and the forward greedy algorithm are included in the Unmixing algorithm. Particularly, mistakes are sourced through previous forward stages are eliminated by carrying out backward steps in each iteration and preserving a big amount of possible mineral endmember has to be avoided. The drawback of conventional greedy algorithms like OMP is that can‟t accurate error which are carried out in the previous steps. Hence can be flat to be attentive into a limited optimum. Nevertheless, NonLHA-RSFBGA can overcome this drawback.
Analysis (SSA) approach. By eliminating noisy mechanisms in extorting the feature, discriminating capability of feature will be enhanced significantly. SSA permits many possibilities for presenting important possible. The application of the SSA approach to each spectral pixel deals with renovation procedure that enlarges the correctness in classification task. Main purpose of SSA is to decompose a unique series into sub-series and numerous self-governing elements. Consequently, the main capabilities of SSA are 1)The Periodicities along with varying amplitudes and complex trends, 2) To find associations in the small time sequence and to cover all oscillating signal, removal of periodic elements, trends and smooth of elements. From the unmixing algorithm separation of the mineral endmember which are present in the input is done. So that the minerals or endmembers which are to be identified are subjected to feature extraction block. Where then the features from the endmember are extracted using Singular spectrum analysis. The features extracted will be the Eigen value, which leads to the potential components extracted from the spectra of endmember.
The features extracted using the SSA process results in the better classification of the minerals by classifying these features with the features already stored in the Knowledge base (obtained by training 5 spectral signatures taken in the testing phase) using ART classifier. The classified output will be the Minerals identified. Series of the real time models of the neural network is considered as the ART (Adaptive Resonance Theory). It provides both supervised and unsupervised learning, prediction, and detection. This ART is considered for both analog as well digital key patterns. Thus in our proposed methodology, the ART for digital input patterns are used for better level of classification and for better classification and recognition rate. The processing steps of the proposed method is described in the following subsections.
A. Singular Value Decomposition
Singular value decomposition (SVD) is illustrated as an approach for transforming the correlated variable set into uncorrelated variables. Where it will represent different relationships among the original data in a better way. Simultaneously, SVD is a technique to recognize and arrange the dimension, where information points demonstrate the main variation. Computation is done on the good approximation of the original data points followed by the identification on where the most variation is done using less dimensions. Therefore, SVD can be illustrated as an approach for data reduction [14]. After carrying out the SVD preprocessing, original data size gets reduced and becomes independent of the spectral band number.
Let us suppose that matrix A with dimension n × m denotes the original dataset. The data objects and attributes are represented by columns and rows of matrix respectively. Then SVD of the matrix A is represented as in equation (1),
A = U∑ VT (1)
Where, U represents an orthonormal dimension matrix n × n, each column containing left singular vector of A. ∑ represents a diagonal matrix of dimension n × m. Where, nonnegative diagonal accesses can arranged in the decreasing order denoting singular values as in equation (2)
∑ = diag(σ1,σ2,∙∙∙∙∙∙,σs), s
= min{ m, n} (2) Let the VT represents an orthonormal dimension matrix m × m, containing the vectors of singular right of the A matrix of the columns[25]. The above three matrices represents the original data breakdown into the linearly independent vectors. In a matrix of diagonal ∑, the singular data can grant in decreasing order and hence, SVD conversion holds the assets that maximum variations between substances are detained in first dimension, as σ1 > σi, for i > 2. Correspondingly, in second dimension much of the variations remaining are captured and etc. Therefore, a altered matrix by a much lesser dimension could be assembled will signify unique matrix accurately. Rank-k approximation Ak to the A matrix is created by defining as in equation (3)
Ak = Uk∑kVk T (3)
Where, Uk includes the initial k columns of U, The k major nonzero singular representations of the matrix A are included in ∑k and VkT enclosed by first „k‟ rows of VT. In the proposed work, the experiments on the hyperspectral imagery of the Mars data are conducted and the consequences on the accuracy of classification by the rank of SVD are studied. For large scale data matrices, the large computational cost is incurred by SVD computations and is depicted in Algorithm 1.
Algorithm 1: Singular Value Decomposition
Input: n, B, Q, P, p, q where B represents n × n and upper bidiagonal, Q & P have orthogonal columns also A = QBPT.
Output: B, Q, P so that B indicates upper bidiagonal,
A = QBPT , Q and P contain orthogonal columns, with
output B has lesser off-diagonal elements than key B. In storage, B, Q, and P can be overwritten.
begin
1. Let B2,2 be the diagonal block of B by row and
column index p + 1, ..., n - q.
2. Set C = lower, accurate 2 × 2 sub matrix
of B2,2T B2,2.
3. Obtain Eigen values λ1, λ2 of C. Set µ = either
of λ1, λ2 is earlier to C2,2.
4. k = p + 1, ∝= bk,k2 − µ, β = bk,k bk,k+1. 5. for k = p + 1, … , n − q − 1
6. Determine c = cos θ and s = sin θ with the
property that:
∝ β −s c = [ ∝c s 2+ β2 0]
7. B ← BRk,k+1(c, s) where Rk,k+1 c, s is the
known revolving matrix
that performs on columns k with k + 1 through accurate multiplication.
8. P ← PRk,k+1 c, s 9. ∝ = bk,k+1, β = bk+1,k .
10. Establish
c −ss c ∝β = [ ∝2+ βb2
0 ]
11. B ← Rk,k+1 c, −s B , where Rk,k+1(c, −s) is the known rotation matrix that forms on rows k and k + 1 through left multiplication.
12. Q ← QRk,k+1 c, s 13. if k ≤ n − q − 1 14. ∝= bk,k+1, β = bk,k+2
15. endfor
end
By observing above algorithm it's clear that Singular Spectrum Analysis (SSA) approach eliminates noisy mechanisms in extorting the feature. Here features will be enhanced significantly. The application of the SSA approach to each spectral pixel deals with restoration procedure that enlarges the correctness in classification task. SSA approach to Mars dataset works as data reduction technique.
B. Non-Linear Hybrid Algorithm for Regularized Simultaneous Forward-Backward Greedy Technique The proposed algorithm term as a nonlinear hybrid algorithm for regularized simultaneous forward-backward greedy technique (NonLHA-RSFBGA), is used for sparse Unmixing of Hyperspectral data. The algorithm, NonLHA-RSFBGA has got inspiration from the adaptive forward-backward greedy algorithm [20] and the simultaneous orthogonal matching pursuit technique[15]. A regularized least squares problem is solved by the proposed algorithm, which implements spatial-contextual coherence constraint on solution. And therefore, solution could anticipate with more accuracy in each iterations. A Lyapunov equation is solved for explaining regularized least squares trouble.
The major contributions of the proposed work are, firstly the regularized simultaneous forward-backward greedy technique is formulated on forward-backward technique [16]. The advantages of both the backward and forward greedy algorithms are explored in the proposed method. Particularly, the error occurred through the previous forward stages are compensated by backward stages. Then which is carried out in iteration by circumvention of preserving a huge amount of possible endmembers. Classical greedy algorithms are having a drawback that the faults made in previous stages cannot be corrected. NonLHA-RSFBGA can overcome this drawback by correcting mistakes. Further in the second contribution, the NonLHA-RSFBGA uses a regularizer, which enforces spatial-contextual coherence inside Hyperspectral picture while updating the solution. Hence, for precisely selecting the actual endmembers in the Hyperspectral image, NonLHA-RSFBGA can promote utilization of spatial contextual data. For analyzing the computational complexity and convergence of the proposed algorithm, theoretical results are presented. For more efficient Unmixing algorithms, the sub-library obtained by NonLHA-RSFBGA can be served as input for any other sparse. It means that NonLHA-RSFBGA can also be a preprocessing stage along with effective sparse Unmixing algorithm.
The amount of end members that are present in Hyperspectral imagery can usually lesser than the amount of spectral signature in spectral records. Where these endmembers
frequently leads to the sparse result. A combinatorial problem containing the non-smooth l0 regularization has to be solved for the newly formulated sparse Unmixing model. The fundamental idea of the greedy algorithm is to solve by making locally optimal option at every stage by expectation of discovering a global optimum[21, 26, 28]. Generally, greedy algorithms process a sparse solution through consecutively recognizing one or more possible endmembers. These endmembers of the spectral library creates the supreme development in rebuilding mixed pixel. A regularized least squares trouble can be explained in the course of the proposed algorithm. In reasonable amount of time, it can be possible to defer nearby optimal solution, which approximates a global optimal result with no evenly l0 norm. Concerned with the Hyperspectral data, some prior knowledge has been considered in the proposed algorithm. Joint sparsity amongst each and every pixel in Hyperspectral information is the first prior knowledge to be considered. So far, the Hyperspectral data were treated as unordered listings of sampled spectral measurement represented by a Hyperspectral data matrix . Between the image features, certainly there exists spatial correlation. The Spatial-contextual information is the second prior knowledge considered here. Optimistic improvement can be achieved in the abundance estimation by adding an entire difference spatial regularizer into sparse Unmixing form.
In this paper, the spatial-contextual information has been incorporated into the simultaneous forward-backward greedy algorithm in a different way. Considering the ith iteration of SFBA and SOMP algorithm, whenever further member can be selected as of the spectral library, a least squares problem has to be solved for updating the solution as in equation (4)
Zt← arg min
Z∈R S ×KQ Z; S =
1
2 AsZ − Y F2 (4)
where S represents a place of indices of preferred members in spectral library. Asdenotes a matrix having the columns of A, containing indices as of S. The spatial-contextual coherence in Hyperspectral information has been considered depends on spectral similarities among the pixel with its neighbouring pixel. By defining the quadratic function G, it can be implemented with respect to the abundances as in equation (5)
G X =1
2 (5)
The neighborhood of ith pixel is denoted by η; xi indicates the ith column of X, Then similarity between ith pixel with jth pixel is measured by Wij, the weight matrix. Particularly, if the jth pixel is in neighborhood of ith pixel, next the weight can be allocated as in equation (6)
Wij = e− yi− yj 22
σ (6)
The width of the Gaussian is controlled by the density parameter, which is denoted by σ. Wij will be relatively big if yi and yj are similar in a
neighbourhood. The
(2) is place to be a (2r + 1) × (2r + 1) square area with r = 2 and the σ is set to 2/3 in equation (6). For expediency of assumption the transforms G(X) in equation (5) is as,
= xiTxiDii− xiTxjW ij K
i,j=1 K
i=1
= Tr XDXT − Tr (XWXT)
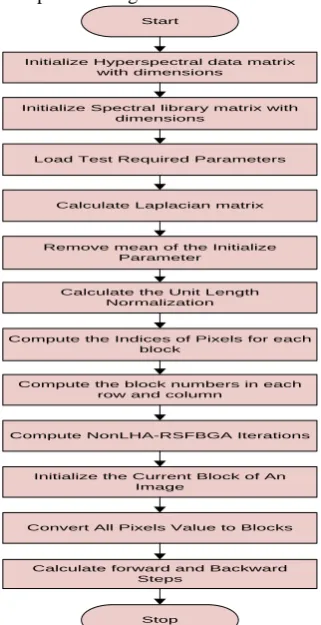
= Tr XLXT (7) Where Tr ∙ indicated trace of a matrix and D represents the matrix of diagonal. Dii = ∑ Wij, L = D − Wj . Where, Dii represents positive semi definite matrix. If j ∉ η , the first equality holds that Wij = 0. Once the segmented minerals are obtained and are subjected to Fuzzy C Means clustering block. The unmixed segmented minerals may also contain regions which are not related to the spectra itself. To eliminate these regions, FCM clustering technique is carried out. The overall flow of the proposed NonLHA-RSFBGA algorithm is depicted in Figure 2.
Start
Initialize Hyperspectral data matrix with dimensions
Initialize Spectral library matrix with dimensions
Calculate Laplacian matrix
Remove mean of the Initialize Parameter
Calculate the Unit Length Normalization
Compute the Indices of Pixels for each block
Compute the block numbers in each row and column
Compute NonLHA-RSFBGA Iterations
Initialize the Current Block of An Image
Convert All Pixels Value to Blocks
Calculate forward and Backward Steps
Stop
[image:6.595.88.249.286.599.2]Load Test Required Parameters
Figure 2. Flowchart for the proposed NonLHA--RSFBGA
C. Singular Spectrum Analysis
Singular spectrum analysis targets to provide enhanced reconstruction of spectral pixel in Hyperspectral imaging. Through which resources of main Eigen value components considered as reducing noise components [17,18]. Size of the window L and the Eigen Value Grouping (EVG) are the two parameters, which affect the performance while reconstructing the original data effectively. The extraction of the entire amount of elements extracted in decomposition step can be determined by the window size L. For instance, if L =20, twenty Eigen values has to be extracted and leads to generate twenty potential components. The first Eigen value is obviously more important than the components corresponding to the obtained Eigen values. Eigen value
grouping represents the selected group of extracted components later which is used for reconstruction.
The Singular spectrum analysis (SSA) is performed by employing the four steps namely Embedding, Singular value decomposition, Grouping and Diagonal averaging. The detailed description of each step is explored in the following.
1st step: Embedding:
Considering the time series which are real valued, F = {x1, x2 ,∙∙∙∙∙∙ xN} of length N (>2). Assume that there at least one existing of i such that x ≠ 0 and the series is a nonzero series. In the embedding process, n= N–(L-1) τ lagged vectors xi = xi , xi+τ , xi+2τ, ⋯ , xi+(L−1)τ) T are formed, where Xi∈ RL and i = 1,2, ⋯ n.X denotes trajectory matrix of time sequence, X = [ x1 ⋯ xi ⋯ xn] having vectors which are lagged as its columns is given in the matrix equation (8).
x1 x2 x3 ⋯ xn
x1+τ x2+τ x3+τ ⋯ xn+τ
x1+2τ ⋮ x1+(L−1τ)
x2+2τ ⋮ x2+(L−1τ)
x3+2τ ⋮ x3+(L−1τ)
⋯ ⋮ ⋯
xn+2τ ⋮ xN
(8)
The matrix X represents Hankel matrix if τ = 1, because this is equal to number of components in diagonal, where summation of row and column subscript is equal to constant. Definitely the elements/endmembers of X are not in the diagonals if τ > 1.
2nd step: Singular Value Decomposition (SVD)
The second step is singular volume decomposition. Let us consider S = XXT and the eigenvalues of S are represented by λ1,λ2, ⋯ ,λL. It can be in the decreasing manner of magnitude. The orthonormal scheme of eigenvectors of matrix S can be represented as u1, u2, . . , uL, which will correspond to these eigenvalues. If the ith eigenvector of XTX is represented as vi = XiTui/ λi( i = 1, ⋯ , L), subsequently the SVD for the matrix of trajectory X could be represented as in equation (9).
X = X1+ ⋯ XL (9)
Where, XI = λiuiviT and the matrix Xi is depicted as the elementary matrix because the matrix rank is 1. It should be noted that uiand vi also denote the ith right and the left singular vector of X, correspondingly.
3rd step: Grouping
The main intention of this stage is to identifying oscillatory elements correctly by various periods, trend component with less noises through grouping the elements. The oscillatory elements treated as endmembers of Mars dataset. If the precise extraction of hidden information by grouping and filtering elements is not necessary then skip this step. For regrouping endmembers the diagonal matrix is computed by using equation (2), the set of indices { 1, ⋯ , L} can be partitioned by performing
Let
I = {i1, ⋯ , ip}. In that case, the obtained output matrix XI which will correspond to the group I can be represented as XI = Xi1+ ⋯ + Xip. For I1, ⋯ , Im these matrices are computed. The new expansion is obtained by substituting into the equation (10).X = XI1+ ⋯ + XIm (10)
The process of choosing the sets I1, ⋯ , Im is called the Eigen triple grouping of endmembers of OMEGA Mars dataset. 4th step: Diagonal averaging
The final step in fundamental SSA is diagonal averaging. In this step, the transformation of every ensuing matrix of grouped decomposition equation (3) into the innovative length of series N has been done. This procedure can be illustrated by finding the elements which are equal in ensuring matrix through generating a novel aspect of averaging. The index or position of the new element is same as present in the original series of corresponding elements. For τ > 1, the idea of diagonal is not accurate.
Let us consider a (L × n) matrix, which is indicated by Y and matrix elements yij , 1 ≤ i ≤ L, 1 ≤ j ≤ n. and let L∗= min L, n , n∗= max L, n and N = n + (L − 1)τ .If L < n, yij∗ = yij , otherwise yij∗ = yji. By the following equation, the diagonal averaging procedure can transfer the matrix to a series{y1, y2, ⋯ , yN}.
1
K ym,k−m+1∗ k
m=1
for 1 ≤ k ≤ L∗
1
L∗ ym,k−m+1∗ L∗
m=1
k ≤ K∗
1
N − k + 1 ym,k−m+1∗
N−K∗+1
m=k−K∗+1
for L∗< k ≤ N
(11)
i + j = k + 1, represent the diagonals over which the averaging of the matrix elements viz. endmembers has been done, with respect to the eq. (11). The F original series are decomposed to sum of m series. Where it creates Fk, a N- length sequences as in equation (12)
F = F1+ ⋯ + Fm (12)
With sets of I1, ⋯ , Im and proper choices of L, these renovated elements could connect by oscillations, or sound of unique time series. Undoubtedly F (original data) could be decomposed into LRCs if 3rd stage is skipped i.e. grouping. D. Singular Adaptive Resonance Theory (ART) Classifier
ART was developed first by Stephen Grossberg in the year 1976. Later on, ART came in several ways, both supervised and unsupervised. ART-1, ART-2, ART-3 and FART are the different unsupervised ART algorithms. Gaussian ARTMAP, Fuzzy ARTMAP with the suffix ''MAP'' are the supervised ones. In unsupervised ART nets, input patterns could be applied in any order and any number of times. The ART classifier is used for the classification of the instances which are unlabelled similar to any other decision list classifier. Starting from the top of the list, a given an example is
checked sequentially against each rule until and unless there is an availability of the matching rule. Eventually, any example would reach a matching rule possibly including a terminal default rule. Where that rule can be labeled with the most common class that was found in the training data from which that rule was created. The null values can be automatically sent to the „else‟ branch. This is because the classifier are not enclosed by the association rules. Nevertheless, when classifying data for some attributes with unknown values, a different method could be followed. There exists a simple rule-based approach for evaluating an ART classifier.
The ART decision lists may end up in a default class value, when the association rules are not produced. The even worst case is when the association rules cover all the examples in the input dataset for building the list, a given instance could lead to nowhere in the decision list. That instance would be labeled with the most common class in the training data covered by the current sub list in the improbable with possible case. In the larger datasets, compared to other well-known classifiers, the accuracy of the ART classifier accuracy is better. Due to their robustness and simplicity ART can be considered as better classifiers for our dataset. For human users, ART classifiers are easy to understand. It can handle the noise present in hyperspectral imagery, which is essential for the classification . Scalability is another motivating issue concerning to ART classifier. ART classifier is scalable and efficient for the classification of the endmembers in hyperspectral imagery shown in Figure 3. E. Adaptive Resonance Theory (ART) Classifier The ART Classifier is used for the better classification of the hyper spectral images of Mars dataset, where it uses the unlabelled instances similar to any other decision list classifier. Initially a specified instance can be checked sequentially beside each rule until and unless an identical rule can be obtained. Eventually any instance would arrive at the matching rule possibly when counting a incurable default rule. Further the matching rule can considered with mainly general class that can establish in training information. The unacceptable values are mechanically sent to another class. When the algorithm classifies the data for some attributes with unknown values, a different method could be followed. For the unavailability of associated rules, ART classifier will end up in a default class value for respected mars image. The most awful case is when the association rules cover every examples in input dataset for building the list, a specified case could direct to nowhere in decision list. That instance would be considered with most general class in training information covered by the current sub-list in this improbable, but possible case for an image hsv000f9c0_01_ra2095_trr3. Resonance Theory for the mars dataset represents the scalable and competent values. When there is a large dataset, the ART classifier will give the better accuracy when compared to other classifier. Seamlessly they can handle primary keys in the input data as well as noise. For the organization rule, mining methods entangled in ART provide an easy and effectual device to undertake a broad assortment of circumstances. Further it doesn't require of using more precise, compound and
dataset. ART simultaneously, determines the several rules. Besides, ART do not suffer as of the I/O blockage familiar to option rule and decision of the list inducer, because it uses a competent association rule mining method to produce hypothesis. Therefore in this paper specially for mars dataset the ART represents appropriate for the handling massive dataset typically establish in the real-world struggles.
F. Comparison to the State-of-Art Techniques
This work introduces an efficient approach for unmixing and classifying the mineral endmember in the Hyperspectral data. Where it efficiently preserve both the spatial data and spectral correlation amongst various bands. The regularized term to advance the presentation of spatial promise is spatial unmixing is equally utilized to improve the abundance endmembers present. Experiments have demonstrated that combinations of spatial and spectral (Non-Linear Hybrid approach for RSFBGA) analysis establishes much better performance than the further state-of-art systems.
The Literature survey for the different existing algorithm for the Unmixing of the Hyperspectral images is depicted in section II. Existing algorithms considered in the literature are having more advantages and also disadvantages. Some of the limitations imposed by the existing methods/algorithms are efficiently alleviated by the proposed system with efficient unmixing techniques. Some of the state-of-the-art techniques/ algorithms presented by researchers in the domain of Hyperspectral imagery are very sensitive to outliers. To increase the appearance of projected system the proposed method employs the hybrid form for both impure spectra and spatial data. The proposed algorithm is suitable for both spectral and spatial Hyperspectral data. The nonlinear model NonLHA-RSFBGA is also added by making use of the nonlinear kernel model making it more effective for evaluating the systems for mineral endmember classification of Mars dataset.
IV. EXPERIMENTATION
The calculated RMSE value for all the algorithms goes on decreasing when there is an increase in SNR. It is seen that the proposed NonLHA-RSFBGA algorithm outperforms several existing algorithms. If there is a increase in endmember, then the performance of the existing algorithms tend to degrade. The authenticate of the recital of proposed technique is done by evaluating the results significantly. The error obtained during the reconstruction is obtained by making use of the Hyperspectral image. It also renovated through the real endmembers with their corresponding abundance. From the Literature it is clear and possible to obtain the actual endmembers. The error occurred in the reconstruction is calculated using RMSE technique. It can even evaluate roughly the estimated abundance for the actual endmember obtained, when there is less availability of the ground truth. The RMSE is calculated for Hyperspectral image Z , renovated image represented through Z . Hence for the ith band image RMSE can be calculated using the equation (13),
RMSEt= 1
K (Zij
K
j=1
− Z ij)2 (13)
The MSE as specified in equation (14), will represent the cumulative error which is squared among the unique picture of hyperspectral and renovated one. If the MSE value is less, then it is considered that the error is less.
MSE = ∑ R1 x,y,λ −R2 x,y,λ 2 x,y,λ
nxnynλ (14)
R1 x,y,λ −R2 x,y,λ are the x column, y rows and λ spectral band for the original and reconstructed data R2 and R1. The peak signal to noise ratio (PSNR) is utilized to calculate peak signal to noise ratio in the intensity among two data. This ratio can be utilized for the value dimension among the unique and reconstructed data. PSNR is calculated using the equation (15). R represents the maximum fluctuation of the data type.
PSNR = 10Log10 R2
MSE (15) The performance of the proposed method is evaluated by using the equation (16) to equation (20) and the final assessment is depicted in the confusion matrix and performance matrix.
Precision = TP/(TP + FP) (16)
Recall = TP/(TP + FN) (17) Accuracy = (TP + TN)/(TP + FP + TN + FN) (18) Sensitivity = TP/(TP + FN) (19) Specificity = TN/(TN + FP) (20)
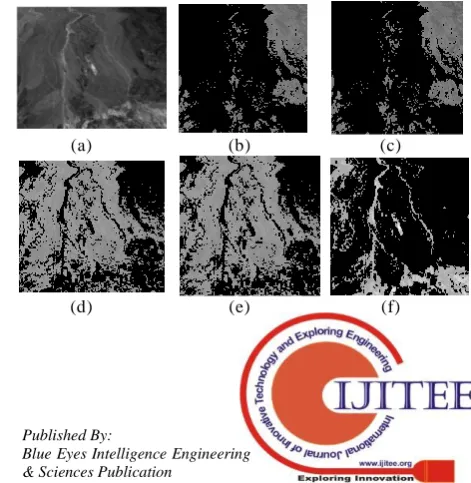
The experimentation work is carried out with Hyperspectral imagery of Mars dataset collected from the OMEGA spectroscopy sensor viz. hsv000f9c0_01_ra2095_trr3 as shown in Figure 3(a). Further the input Mars dataset is partitioned into three segments of mineral composition of the Mars surface and are depicted in Figure 3(b),3(d) and 3(f) respectively. ART classifier is scalable and efficient for the classification of the mineral endmembers from the image hsv000f9c0_01_ra2095_trr3 namely Calcite,Alunite and Kaolinite. These classification of minerals are shown in Figure 3(c),3(e) and 3(g) respectively. The resultant classified minerals of hyperspectral imagery of Mars dataset is depicted in Figure 3(h).The ART classifier efficiently classify the minerals present on the surface of Mars dataset.
(a) (b) (c)
[image:8.595.310.546.591.833.2](g) (h)
Figure 3. (a) Input Hyper spectral Image
(hsv000f9c0_01_ra2095_trr3) (b) Segment Image1 (c) Classified Image of Calcite (d) Segmented Image 2 (e) Classified Image of Alunite (f) Segmented Image 3 (g) Classified Image of Kaolinite (h) Classified Minerals
[image:9.595.58.264.47.181.2]The assessment of overall presentation of proposed method is analyzed using the confusion matrix given in Table 1. The confusion matrix is a table which will help us in analyzing the overall performance of the proposed methodology. The results obtained after every class prediction is shown in the columns of the matrix form.
Table 1: Confusion Matrix
N = 166 Predicted as No Predicted as Yes Total
No TN = 52 FP = 5 57
Yes FN = 5 TP = 104 109
Total 57 109
The performance of the proposed system is depicted in Table 2.
Table 2: Performance Analysis Table for the Proposed System
Dataset Accuracy Precision Recall Sensitivity Specificity
1 (34 images)
94.11 95.45 95.45 95.45 91.66
2 (34 images)
94.11 95 95 95 92.85
3 (30 images)
93.33 95.23 95.23 95.23 95.23
4 (36 images)
94.44 95.83 95.83 95.83 95.83
5 (32 images)
93.75 95.45 95.45 95.45 95.45
Average (166 images)
93.97 95.41 95.41 95.41 91.22
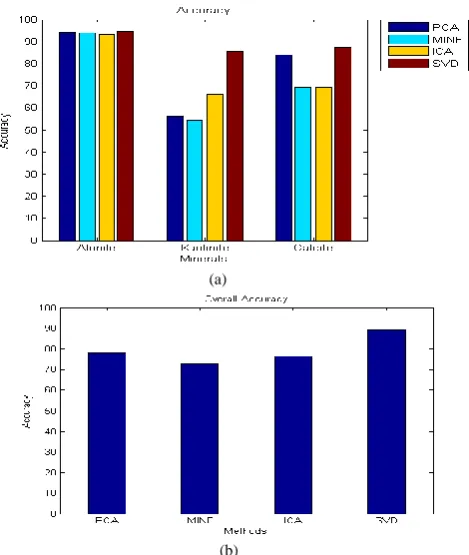
The results demonstrate that the proposed method gives best result in requisites of RMSE and PSNR when compared to the existing systems. The Figure 4(a) shows the graph obtained for all the parameters of performance analysis with respect to minerals like Calcite, Alunite and Kaolinite. The comparison of the proposed method (SVD and NonLHA-RSFBGA) with other existing methods viz. PCA,MINF and ICA is pictorially depicted in Figure 4(b). The overall accuracy of proposed method is much more promising compared to existing methods.
(a)
(b)
Figure 4(a) Comparison Graph For Accuracy (b) Comparison Graph For Overall Accuracy
[image:9.595.312.547.51.329.2]Further Table 3 gives the performance evaluation of proposed and previous systems. The comparison between the proposed method (Non-Linear Regularized Simultaneous Forward-Backward Greedy Algorithm (NonLHARSFBGA) with ART Classifier) and other methods Minimum Volume Simplex Analysis (MVSA) Algorithm[6], Graph Regularized Nonnegative Matrix Factorization Method (GNMF) [7], Post-nonlinear Model, Spectral Un-mixing (Su) [8] and Adaptive- Markov random field (MRF), morphological filter, Bayesian algorithm [9] is provided in the Table 3.
Table 3: Comparison of the Performance Analysis of the proposed and the existing system
Reference Algorithms Performance
[6]
Minimum Volume
Simplex Analysis
(MVSA) Algorithm
Error of MVSA algorithm for p=5 IS Error=0.04
[7]
Graph Regularized Nonnegative Matrix Factorization Method (GNMF)
Based on RMS values in degree, Spectral Angle Distance (SAD) = 15.76, Abundance Angle Distance (AAD) = 8.34
[8] Post-nonlinear Model, Spectral Un-mixing (Su)
RMSE for the PPNMM
Bayesian=2.93, Taylor=3.33 Gradient=2.29
[9]
Adaptive- Markov
random field (MRF), Morphological Filter, Bayesian Algorithm
Adaptive-MRF Reconstruction error (RE)=1.63, Spectral
Angle Mapper
(SAM)=15.16
Proposed
Non-Linear Regularized Simultaneous
Forward-Backward
Greedy Algorithm
(NonLHARSFBGA) with ART Classifier
RMSE = 1.98,
Accuracy= 93.97, Precision= 95.41, Specificity= 91.22
[image:9.595.51.289.272.329.2] [image:9.595.309.556.490.830.2]In this paper, efficient approach for Unmixing and classification of Hyperspectral data is presented for Mars dataset. The SVD algorithm is employed for preprocessing of the hyperspectral data. A novel algorithm termed NonLHA-RSFBGA (Non-Linear Hybrid Approach for Regularized Simultaneous Forward-Backward Greedy Technique) is used for hyperspectral data Unmixing. Several characteristics of Hyperspectral data and combination of forwarding and backward greedy algorithm are considered. Feature extraction is done using singular spectrum analysis approach. The obtained Eigen features of the testing hyperspectral image are matched with Eigen feature vectors stored in the knowledgebase using Adaptive Resonance Theory (ART) Classifier. Series of real time neural network models are considered as the ART, which provides both supervised and unsupervised learning, prediction and detection, mainly with pattern recognition. Hence, the ART classifier for input patterns is utilized for better level of classification for identifying the mineral endmember between the interval (0.8 – 2.5 µm) Aϵ RL×M . The proposed method is exposed to give a precise description of hyperspectral images in both spectral and spatial domain in short span of time. In future the method can be extended to compute the percentage of the mineral composition of each mineral present on the surface of Mars imagery.
REFERENCES
1. Combe, J.P, Le Mouelic, S, Sotin, C. Gendrin, A, Mustard J.F, Le Deit L, Launeau, P Bibring, J.P, Gondet, B, Langevin, Y. and Pinet P, “Analysis of OMEGA/Mars Express Data Hyperspectral Data Using A Multiple-Endmember Linear Spectral Unmixing model (MELSUM): Methodology and First Results”, Planetary and Space Science, (2008), pp. 951-975.
2. Jose M. Bioucas-Dias, Antonio Plaza, Nicolas Dobigeon, Mario Parente, Qian Du, Paul Gader and Jocelyn Chanussot, “Hyperspectral Unmixing Overview: Geometrical, Statistical, and Sparse Regression-Based Approaches,” IEEE Journal of Selected Topics in Applied Earth Observations and Remote Sensing, Vol. 5, Issue 2, (2012 ), pp.354-379. 3. Gabriel Martin and Antonio Plaza, “Spatial-Spectral Pre-processing
Prior to Endmember Identification and Unmixing of Remotely Sensed Hyperspectral Data,” IEEE Journal of Selected Topics in Applied Earth Observations and Remote Sensing, Vol. 5, Issue 2, (2012), pp. 380-395. 4. Chen Chen, Wei Li, Eric W. Tramel, Minshan Cui, Saurabh Prasad, and James E. Fowler, “Spectral–Spatial Pre-processing Using Multihypothesis Prediction for Noise-Robust Hyperspectral Image Classification,” IEEE Journal of Selected Topics in Applied Earth Observations and Remote Sensing, Vol. 7, Issue 4, (2014), pp. 1047-1059.
5. Chengbo Li, Ting Sun, Kevin Kelly, and Yin Zhang, “A Compressive Sensing and Unmixing Scheme for Hyperspectral Data Processing,” IEEE Transactions on Image Processing, Vol. 21, Issue 3, (2012), pp.1200-1210.
6. Jun Li and Jose M. Bioucas-Dias, “Minimum Volume Simplex Analysis: A Fast Algorithm to Unmix Hyperspectral Data,” IEEE International Geoscience and Remote Sensing Symposium, Vol. 3, (2008), pp. III-250-253.
7. Roozbeh Rajabi, Hassan Ghassemian, “Hyperspectral Data Unmixing Using GNMF Method and Sparseness Constraint,” IEEE International Geoscience and Remote Sensing Symposium - IGARSS, (2013), pp. 1450-1453.
8. Yoann Altmann, Abderrahim Halimi, Nicolas Dobigeon and Jean-Yves Tourneret, “Supervised Nonlinear Spectral Unmixing Using a Post nonlinear Mixing Model for Hyperspectral Imagery,” IEEE Transactions on Image Processing, Vol. 21, Issue 6, (2012), pp. 3017-3025.
9. Olivier Eches, Jon Atli Benediktsson, Nicolas Dobigeon, and Jean-Yves Tourneret, “Adaptive Markov Random Fields for Joint Unmixing and Segmentation of Hyperspectral Images,” IEEE Transactions on Image Processing, Vol. 22, Issue 1, (2013), pp. 5-16.
10. Naoto Yokoya, Takehisa Yairi, and Akira Iwasaki, “Coupled Nonnegative Matrix Factorization Unmixing for Hyperspectral and Multispectral Data Fusion,” IEEE Transactions on Geoscience and Remote Sensing, Vol.50, Issue 2, (2012), pp.528-537.
11. Zhenwei Shi, Xinya Zhai, Durengjan Borjigen, Zhiguo Jiang, “Sparse Unmixing analysis for Hyperspectral imagery of Space Objects,” International Symposium on Photoelectronic Detection and Imaging, (2011), pp. 81960Y-81960Y.
12. Jamie Zabalza, Jinchang Ren, Zheng Wang, Stephen Marshall and Jun Wang, “Singular Spectrum Analysis for Effective Feature Extraction in Hyperspectral Imaging,” IEEE Journal of Selected Topics in Applied Earth Observations and Remote Sensing, Vol. 8, Issue 6,(2015), pp. 2845 - 2853.
13. Liangpei Zhang, Lefei Zhang, Dacheng Tao, and Xin Huang, “Tensor Discriminative Locality Alignment for Hyperspectral Image Spectral–Spatial Feature Extraction,” IEEE Transactions on Geoscience and Remote Sensing, Vol. 51, Issue 1,( 2013), pp. 242-256.
14. Jie Wang, Weijun Zhong, Shuting Xu, Jun Zhang, “Selective Data Distortion via Structural Partition and SSVD for Privacy Preservation,” Proceedings of International conference on Information & Knowledge Engineering, (2006), pp. 114-120.
15. T. Zhang, “Adaptive Forward-Backward Greedy Algorithm For Learning Sparse Representations,” IEEE Transactions on Information Theory, Vol. 57, Issue 7, (2011), pp. 4689–4708.
16. Wu C. L, K. W Chau, and C. Fan, "Prediction of Rainfall Time Series Using Modular Artificial Neural Networks Coupled With Data Preprocessing Techniques," Journal of Hydrology, Vol. 389, Issues 1–2, (2010), pp.146-167.
17. Shaoquan Zhang, Jun Li, Heng-Chao Li, Chengzhi Deng, Antonio Plaza,"Spectral-Spatial Weighted Sparse Regression For Hyperspectral Image Unmixing," IEEE Transactions on Geoscience and Remote Sensing, Vol. 56, Issue 6, (2018).
18. Berzal F, Cubero J.C, Sánchez D and Serrano J.M, “ART: A Hybrid Classification Model,” Machine Learning, (2004), pp. 67-92.
19. Shanumukhappa A. Angadi, Sanjeevakumar M. Hatture, "Speaker Recognition System Using Symbolic Modelling of Voiceprint," International Journal of Signal Processing, Image Processing and Pattern Recognition (ISSN: 2005-4254), Vol. 10, No. 10, (2017), pp. 1-16.
20. M.Nagarajan, Shonima Vasudevan, "A Basic Study of Image Processing and Its Application Areas", International Journal of Engineering Research and Technology, Vol. 6, Issue 7, (2017), pp. 343-348. 21. M. Ezhilarasi and V. Krishnaveni , "An Optimal Solution To Minimize
The Energy Consumption in Wireless Sensor Networks,"International Journal of Pure and Applied Mathematics”, Vol. 119, Issue 10, (2018), pp. 829-844.
22. Shanumukhappa A. Angadi, Sanjeevakumar M. Hatture, "Biometric Person Identification System: A Multimodal Approach Employing Spectral Graph Characteristics of Hand Geometry and Palmprint," International Journal of Intelligent Systems and Applications, Vol. 3, (2016), pp. 48-58.
23. M Nagarajan, S. Karthikeyan, "A New Approach to Increase the Life Time and Efficiency of Wireless Sensor Network", IEEE International Conference on Pattern Recognition, Informatics and Medical Engineering (PRIME), (2012), pp. 231-235.
24. Rashmi. P.Karchi, Nagesh B.K, "A Hybrid Approach for Hyper Spectral Image Segmentation Using SMLR and PSO Optimization," Proceedings of Recent Trends in Image Processing and Pattern Recognition, Springer Nature Singapore, CCIS 709, (2017), pp. 1–9.
25. Eckart, C. and Young, G., “The Approximation Of One Matrix By Another Of Lower Rank," Psychometrika, (1936), pp. 211-218. 26. M. Ezhilarasi V. Krishnaveni "A Survey on Wireless Sensor Network:
Energy and Lifetime Perspective", Taga Journal, Vol. 14 pp. 3099-3113 ISSN 1748-0345.
27. Shanumukhappa A Angadi, Sanjeevakumar M Hatture, "A Novel Spectral Graph Theoretic Approach To User Identification Using Hand Geometry", International Journal of Machine Intelligence, Vol. 3, No.4, (2011), pp. 282-288.
28. Ezhilarasi, M. & Krishnaveni, V. "An Evolutionary Multipath Energy-Efficient Routing Protocol (EMEER) for Network Llifetime Enhancement in Wireless Sensor Networks" Soft Computing, (2019). https://doi.org/10.1007/s00500-019-03928-1
AUTHORSPROFILE
Tamil Nadu, India . He has completed Ph.D in Computer Science in 2012. He has published many reputed International Journals and has an experience more than 15 years in the Industry and Academic. His research area includes Wireless Sensor Networks, Remote Sensing, Image Processing and Network Security.