International Journal of Innovative Technology and Exploring Engineering (IJITEE) ISSN: 2278-3075,Volume-8 Issue-12, October 2019
Abstract: Abnormal electrical activity of the human heart indicates cardiac dysfunction. The Electrocardiogram (ECG) is one of the non-invasive diagnostic techniques to detect cardiac abnormalities. Irregularity and non-stationarity in the ECG signal impose difficulties to clinicians for accurate diagnosis of heart diseases only by visual inspection. Automatic recognition of abnormal ECG beats aids in early detection of heart diseases. This paper explores the ECG single beat analysis to identify the cardiac abnormality. In this work, seven classes of arrhythmia are considered as recommended by AAMI(Association for the Advancement of Medical Instrumentation) standard. Beat feature database is generated from 44 recordings of the MIT-BIH arrhythmia database to support the arrhythmia classification. Classification is implemented with Multiclass Support Vector Machine (SVM) for non-linearly separable data effectively. Classification accuracy up to 93% is achieved for the selected input feature sets. This work assesses the suitability of the ECG input features for multi-class classification of arrhythmia.
Keywords: feature extraction, multiclass classification, Radial Basis function, single beat analysis, support vector machine.
I. INTRODUCTION
Monitoring the physiological parameters of a person during rigorous physical activities helps a physician to assess the health conditions. Abnormal cardiac activities can be catastrophic. One of the common causes of sudden cardiac death (SCD) is due to cardiac arrest. Myocardial ischemia is a coronary artery disease in which a part of the heart muscle does not receive enough blood supply leading to SCD [1],[ 2]. The most common approach for detecting this condition in an early stage is to analyze the electrocardiogram (ECG) of a person. An ECG records the electrical signals generated by the human heart, thereby providing valuable information about its condition. Medical doctors have to analyze long ECG records in a limited time to diagnose the condition of the heart. The human eye is not well suited to detect the morphological variation of the ECG signal, hence the need for a computer-aided diagnostic(CAD) system[3]. The automatic ECG analysis is efficient due to large variation in morphological and temporal characteristics of normal ECG waveforms of different persons as well as the patients with
Revised Manuscript Received on October 05, 2019.
Sundari Tribhuvanam Department of Electronics, University of Mysore, Mysore, India. Email: [email protected]
H. C. Nagaraj, Department of Electronics, Nitte Research and Education Academy, Bengaluru-India. Email: [email protected]
V.P.S. Naidu, MSDF, FMCD, CSIR-NAL, Bengaluru-India. Email: [email protected]
Table-I: Morphological Features of Normal ECG [8]
similar disease [4]. A normal ECG comprises the PQRST waves- the P wave represents the depolarization and contraction of the atria, the QRS complex-the depolarization and contraction of the ventricles, the T wave- the repolarization of the ventricles [5-7]. Cardiologists can infer heart conditions from PQRST wave patterns and inter wave intervals. Cardiologists may occasionally need to study a patient's ECG signals recorded over a 24-hour period for diagnostic purposes. However, manually examining such a large amount of data is tedious. To solve this problem, studies have proposed different classification algorithms for segmenting and classifying ECG signals more precisely and correctly in real-time. Table-I shows the various single beat ECG morphological features of normal adult with 60 beats per minute which are of clinical importance [8].
II. METHODOLOGY
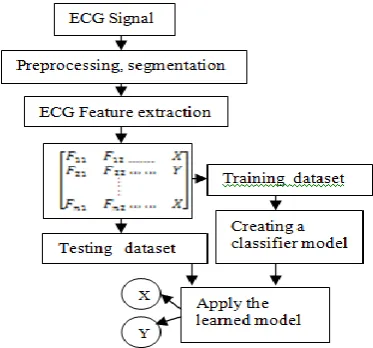
To identify the abnormalities of the human heart based on machine learning, it is very important to analyze the single ECG beat extracted from the ECG signal. Fig. 1 shows an overview of the proposed system. The proposed method has two stages-ECG monitoring and single beat analysis. The acquired ECG continuously monitored for the abnormalities in the heart rate and the beat pattern by visual inspection considering 8-second ECG at a time. For beat pattern abnormalities, a single beat extracted and analyzed as shown in Fig. 2. This system includes five stages: ECG pre-processing, beat segmentation, feature extraction, learning/classification, and performance analysis. The pre-processing and segmentation aims at improving the quality of the ECG signals by noise removal and baseline correction. This stage has a direct influence on the result and should be chosen carefully [4]. The segmentation stage aims at segmenting the ECG signal into
Arrhythmia Classification with Single Beat
ECG Evaluation and Support Vector Machine
Sundari Tribhuvanam, H. C. Nagaraj, V.P.S. Naidu
S. No. Feature Mean STD
1 P wave 110 ms ± 20 ms
2 PQ/PR interval 160 ms ± 40 ms
3 QRS Width 100 ms ± 20 ms
4 QT interval 400 ms ± 40 ms
5 ST interval 100 ms ± 20 ms
6 RR interval 1600ms ± 40 ms
7 Amplitude of P 0.115 mV ± 0.05 mV
8 Amplitude of QRS 1.5 mV ± 0.5 mV
9 ST level 0 mV ± 0.1 mV
Fig. 1. Block diagram of the proposed System
single beats. The feature extraction stage considers the extraction of the time domain features from the segmented ECG beat. It extracts the statistical features, computes energy, entropy and power spectral density of the ECG beat. The row of the feature matrix (F11-F1N) indicates the various features of the single beat while the column (F11-Fn1) represents the similar features of different beat samples. These features serve as input to the classifier to train and test the model to classify the ECG beats. The performance analysis includes the identification of suitable input features for efficient output of the classifier and comparison of classification accuracies. In this paper, only time-domain analysis of the ECG data has been presented.
A. ECG Data acquisition
[image:2.595.100.233.69.265.2]In this study, the MIT/BIH arrhythmia database is considered for continuous monitoring to compute the heart rate and to identify the cardiac abnormalities. The arrhythmic ECG beats are segmented and used training and performance evaluation of the ECG classifier. The database contains 48 records, each containing two-channel ECG signals for 30 min duration selected from 24-h recordings of 47 individuals.
Fig. 2. Block diagram for single beat analysis
Table-II: Different class of ECG arrhythmia beats
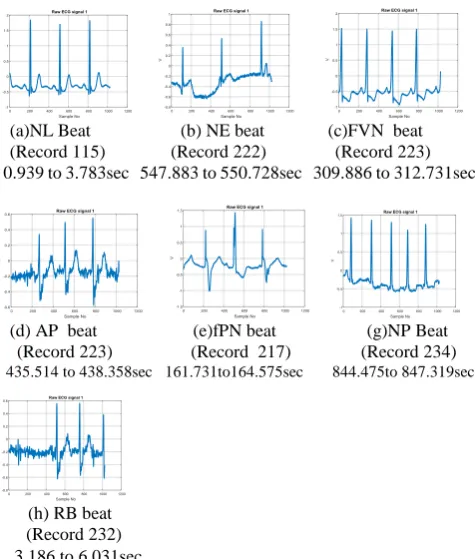
Continuous ECG signals are band pass-filtered at 0.1–100 Hz and then digitized at 360 Hz. The database contains annotation for both timing information and beat class information verified by independent experts. For all records, the modified lead II signal is selected and labels are utilized to locate beats in ECG data to support the visual monitoring [9]. In this work, seven different abnormalities considered as per Association for the Advancement of Medical Instrumentation (AAMI) standard [5]. The primary requirement of this work is to study the ECG of the healthy adult with normal cardiac cycle [10]. Fig. 3a represents normal ECG single beat and fig. 3b-3g shows the abnormal ECG beats with the record number and time information. Table-II indicates the different classes arrhythmia considered for classification.
B. ECG Preprocessing
The acquired ECG data is pre-processed before extracting any features. The steps include beat segmentation, baseline wander removal and zero line alignment [11]. ECG segmentation is the foremost requirement to extract single ECG beat. Pre-processing of the ECG signal includes (i) Data normalization, to overcome any error introduced during ECG acquisition, (ii) Power line interference elimination by a second order notch filter, (iii) Band pass filtering to eliminate the noise present in the ECG (iv) Baseline correction to align the PQ segment with the reference (zero) line [12]. This is achieved by subtracting the 10th level approximation signal from the filtered ECG beat using discrete wavelets. Daubechies wavelet (db6) considered based on its similarities to ECG signal [13], [14]. (v)The data is smoothened by an averaging filter to remove the glitches and to increase the performance of peak detection. The cygwin- an open-source tool and MATLAB 2019A are used to segment and pre-process the ECG beats.
Sl No Type Notation
1 Normal NL(class 1)
2 Atrial Premature beat AP(class 2)
3 A fusion of ventricular and
normal beat
fVN(class 3)
4 Nodal (junctional) escape
beat
NE(class 4)
5 Nodal(junctional)
premature beat
NP(class 5)
6 Right bundle branch block
beat
RB(class6)
7 A fusion of paced and
normal beat
[image:2.595.75.262.570.744.2]International Journal of Innovative Technology and Exploring Engineering (IJITEE) ISSN: 2278-3075,Volume-8 Issue-12, October 2019
C. Feature extraction
The feature extraction stage is the key to the success in the heartbeat classification of the arrhythmia using the ECG signal. Any information extracted from the heartbeat used to discriminate its type from others considered as a feature. The features can be extracted in various forms directly from the ECG signal’s morphology in the time domain and/or in the frequency domain or from the cardiac rhythm. While feature extraction is defined as the stage that involves the description of a heartbeat, feature selection consists of choosing a subset with the most representative features with the objective to improve the classification stage.
(a)NL Beat (b) NE beat (c)FVN beat (Record 115) (Record 222) (Record 223) 0.939 to 3.783sec 547.883 to 550.728sec 309.886 to 312.731sec
(d) AP beat (e)fPN beat (g)NP Beat (Record 223) (Record 217) (Record 234) 435.514 to 438.358sec 161.731to164.575sec 844.475to 847.319sec
(h) RB beat (Record 232) 3.186 to 6.031sec
Fig. 3(a)-(g). ECG signals of different classes
Time-domain Features of ECG Beat
In this time-domain analysis, statistical features are computed from the single ECG beat data. Features considered are mean (μ), variance (σ2), Kurtosis (Kt), Skewness (Sn) and normalized central moments (c5 to c8), energy in the time domain (E-Ti), maximum Power Spectral Density (PSDmax) frequency at the maximum power (fr-mxpr). As Entropy is the complexity measure to study the uncertainties in the time series ECG signal, log energy (LogE), Shannon spectral entropy (Spen) are considered as features in this work[15],[16]. These features are explained in this section.
(i) Mean(µ)
Mean is the average of the total number of samples in the ECG beat x(n) and is denoted as
(1)
where N: length of the ECG signal, x(n): single ECG beat (ii) Variance (σ2) Variance is the square of standard deviation. It is useful in ECG beat classification. It is represented as (2)
(iii) Root Mean Square (RMS) The Root Mean Square (RMS) is a measure of the power content in the ECG signal. RMS is the effective value and defined as the standard deviation of the ECG signal. It is a feature, suited for steady-state signals. It provides excellent results in following the noise level throughout the signal and is the normalized second statistical moment of the signal [7]. It is represented as (3)
(iv) Skewness(Sn) Skewness is the normalized third statistical moment of the signal. It indicates the relative energy over and under the mean level [8]. It is represented as (4)
(v) Kurtosis(Kt) Kurtosis is the normalized fourth statistical moment of the signal. It indicates the impulsive nature of the signal. Since the signal is raised to the fourth power, it effectively amplifies the isolated peaks in the signal [9]. Kurtosis value is a negotiation between the tactless lower moments and extra-sensitive higher moments [8]. Kurtosis increases rapidly at the initial stage of an abnormality itself which is very helpful in finding the faults [6]. For discrete-time signals, kurtosis is defined as (5)
(vi) Normalized central moments (c5 to c8) (6)
(7)
(8) [image:3.595.52.290.197.477.2]
(vii) The energy in the time domain
(10)
(viii) PSD estimate by Welch Method
Welch method consists of dividing the time series data into overlapping segments, computing a modified
periodogram of each segment and then averaging the PSD estimates. This result is Welch estimate. The Welch power density spectral estimate is
Table-III Extracted statistical features of the single ECG beat
(11)
(ix) The frequency at maximum power
This is obtained from the frequency output of Welch’s estimate for the ECG beat.
(x) Log Energy Entropy:
Entropy is the measure of uncertainty about an event S at frequency f.
(12) (xi) Shannon Spectral Entropy
Spectral Entropy indicates the amount of activities in the ECG signal
(13) f :[fl,fh] is the number of frequency components and pf : PSD of the ECG beat
(xii) Energy Density
It indicates the distribution of energy content in the ECG Beat.
(14) All the mentioned features are calculated with MATLAB routines.
D. ECG Feature Selection and Classification
Feature selection consists of choosing a subset of input features with the objective of improving the accuracy of classification. In this work, fourteen time domain features considered as inputs to the binary SVM. SVM is primarily a classifier method that performs classification tasks by constructing hyperplanes in a multidimensional space that separates cases of different class labels [17], [18]. In this work, multiclass classification implemented using SVM. The model adopts RBF kernel, One Versus One encoding scheme, 10 fold cross-validation, and simplex optimization routine.
III. RESULTS AND DISCUSSION
The ECG beat feature extraction and classification using SVM is an efficient method to understand the electrical activity of the human heart. The extracted features are the inputs to the classifier to compute the machine tuning time and accuracy of classification. Time-domain features represent the quality, spectral content and amount of disorder present in the time series ECG signal. The features are computed for single ECG beat are mean (μ), variance (σ2), Kurtosis (Kt), Skewness (Sn) and normalized central Moments (c5 to c8), energy in time domain (E-Ti), maximum PSD (PSDmax), Shannon Entropy (Spen), frequency at maximum power (Fr-mxpr), log-energy (LogE) and Energy Density serve as inputs for classifier. Table-III shows the typical time-domain features of seven classes of ECG beat considered in this work.
Class E_Ti PSD
max Freque ncy at Pmax Mean (µ) Varian ce(σ2)
Skewn ess(Sn)
Kurtos is(kt)
Normalized Central Moments Log-E nergy (LogE) Shano nEntro py (SEN) energy density
C1 C2 C3 C4 C5 C6 C7 C8
NL 7.78
± 6.82 0.0046 ± 0.0072 3.3 ± 2.37 0.0069 ± 0.045 0.0238 ± 0.0185 2.96 ± 2.42 19.73 ± 10.17 102.39 ± 82.36 646.94 ± 493.72 3843.5 ± 3428. 8 24454.79 ± 22324.78 -2076 ± 383 11.56 ± 8.3 0.024 ± 0.019
PB 6.88
± 3.66 0.0033 ± 0.002 1.92 ± 1.46 0.010 ± 0.04 0.021 ± 0.01 2.35 ± 1.41 12.05 ± 5.97 50.65 ± 38.12 252.88 ± 201.26 1219.8 ± 1161.9 6246.48 ± 6555.9 -1904 ± 309 12.63 ± 6.398 0.022 ± 0.012
VN 12.8
± 11.2 0.0068 ± 0.011 2.01 ± 1.38 -0.013 ± 0.07 0.037 ± 0.03 2.19 ± 1.75 12.70 ± 5.6 49.25 ± 44.62 271.19 ± 214.03 1238.1 ± 1373.3 6858.5 ± 7534.5 -1782 ± 383 17.2 ± 12.23 0.042 ± 0.037
E 3.32
± 2.01 0.0019 ± 0.002 0.8 ± 0.37 0.015 ± 0.037 0.009 ± 0.004 3.33 ± 1.07 18.22 ± 6.99 97.84 ± 49.54 555.24 ± 336.08 3225.9 ± 2278.2 19173.8 ± 15409.9 -2184 ± 349 8.19 ± 5.27 0.011 ± 5.27
P 11. 6
± 7.31 0.006 ± 0.004 2.33 ± 1.04 0.015 ± 0.018 0.04 ± 0.03 3.54 ± 0.52 16.06 ± 3.94 73.91 ± 26.86 352.39 ± 169.9 1721.2 ± 1036.2 8591.95 ± 6189.7 -1685 ± 284 8.21 ± 3.84 0.045 ± 0.067
B 10.0
± 12.8 0.005 ± 0.005 1.39 ± 1.54 -0.002 ± 0.037 0.042 ± 0.04 1.146 ± 1.54 9.76 ± 4.27 27.6 ± 31.45 163.86 ± 136.3 648.28 ± 796.67 3406.5 ± 4177.9 -1844 ± 191 12.8 ± 4.3 0.043 ± 0.042
PN 8.77
International Journal of Innovative Technology and Exploring Engineering (IJITEE) ISSN: 2278-3075,Volume-8 Issue-12, October 2019
(a) CM8 (b) CM6 (c) CM3
[image:5.595.49.281.51.212.2](d)Entropy Plot (e)Frequency at (f)Energy in Max power time domain Fig. 4(a)-4(f). Error plots various time-domain features
Table-IV. Accuracy of MSVM for various input feature set
Feature selection involves in choosing a subset with the objective of supporting the classification. The 14 time-domain features lead to 91 different, valid input sets to the binary SVM. The error plots of typical input features for various classes of ECG abnormalities are plotted in the figures 4(a)-4(f) and these indicate the correctness of choice of the features to support the classification. This is exactly measured from the accuracy of the SVM. SVM tuning time and
accuracy of classification are the performance metrics of MSVM. The results are indicated in the table-IV gives the complete summary of the accuracy obtained for any given set of input features. The results indicate that the classification
[image:5.595.58.543.237.612.2]Table-VI: SVM performance for multiple iteration with different Train and Test data ratio for input
Fr-mxpr-CM3 Iterati
on No
70%(train) 30%(Test)
75%(train) 25%(Test)
80%(train) 20%(Test)
85%(train) 15%(Test)
Accuracy Accuracy Accuracy Accuracy
1 89.66 90.41 94.83 90.7
2 88.51 90.41 93.1 90.7
3 89.66 87.67 93.1 93.02
4 91.95 90.41 91.38 95.35
5 87.36 94.52 91.38 93.02
6 90.8 89.04 91.38 90.7
7 91.95 93.15 91.38 93.02
8 87.36 90.41 94.83 88.37
9 91.95 93.15 91.38 93.02
10 90.8 93.15 91.38 93.02
is categorized into three groups-good, moderate and poor. The accuracy between 80% and 90% is considered as moderate and 48 input feature pairs satisfy this category. Accuracy above 90% is considered as good and 11 input feature sets are satisfying this condition. Input sets of this category are indicated in table-V along with corresponding accuracies.
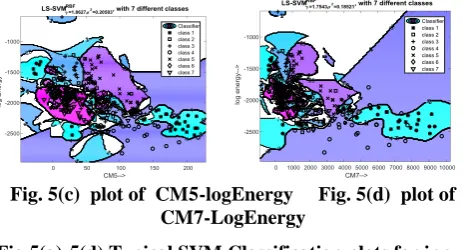
The choice of training and testing data to MSVM is random. Multiple iterations of the algorithm yields better performance of the SVM. The ratio of training and testing set has an impact on the performance of MSVM. The table-VI and table-VII summarises the accuracy of classification for the input pairs Fr-mxpr-CM3 and CM2-CM5 for different ratios of testing and training set for multiple iterations. The performance of SVM is improved by choosing optimum ratio of training and test data as 75: 25 or 80: 20. Table-VIII shows the similar results for typical input feature sets combinations of the MSVM. The typical MSVM classification plots of these features are shown in the fig. 5(a). -fig.5(d). These input datasets are further enhanced to improve the accuracy for better classification results.
Fig. 5(a) plot of Fr-mxpr-CM3 Fig. 5(b) plot of CM2-CM5
Fig. 5(c) plot of CM5-logEnergy Fig. 5(d) plot of CM7-LogEnergy
Fig.5(a)-5(d) Typical SVM Classification plots for input feature sets
Table-VII: SVM performance for input CM2-CM5
Iteration No
70%(train) 75%(train) 80%(train) 85%(train)
30%(test) 25%(Test) 20%(Test) 15%(Test)
Accuracy Accuracy Accuracy Accuracy
1 87.36 90.4 91.38 83.72
2 88.51 91.78 89.67 88.37
3 88.51 83.57 91.38 88.37
4 87.36 87.67 79.31 88.37
5 82.76 90.41 86.21 88.37
6 89.66 87.67 91.38 90.7
[image:6.595.42.288.52.145.2]7 86.21 90.41 89.66 88.37
Table-VIII: Performance of SVM for typical feature Sets Sl.
No
Input Feature pair
Accuracy of SVM (trainingset:Testset)
70% 75% 80% 85%
30% 25% 20% 15%
1 Fr-mxpr-CM3 90.8 94.52 94.83 95.35
2 CM1-CM4 90.8 90.41 96.55 95.35
3 CM1-CM5 89.66 95.89 93.1 93.02
4 CM1-CM6 91.95 94.52 93.1 95.35
5 CM1-CM8 91.95 95.35 94.83 95.35
6 CM2-CM5 90.8 90.41 91.83 88.37
7 CM3-CM5 90.8 89.04 91.38 86.05
8 CM5-CM8 89.66 87.67 81.03 86.05
9 CM5-logenergy 93.1 93.15 94.43 95.35
10 CM5-energyden
sity
89.66 90.7 89.66 90.7
11 CM7-logenergy 90.8 91.78 87.93 90.7
IV. CONCLUSIONS
Early detection of cardiac abnormalities in humans is the primary need of the day. This work discusses the classification of seven classes arrhythmia based on analysis of the single ECG beats. Wavelet transform considered for non-stationary ECG signal analysis for zero line correction in the signal pre processing. Fourteen time domain feature are extracted from each single ECG beat and feature table is generated for arrhythmia
classification. Ninety one input feature sets are considered as Sl.
No
Feature pair Accura
cy (%) Sl. No
Feature pair Accura
cy (%)
1 Fr-mxpr-CM3 90.8 7 CM3-CM5 90.8
2 CM1-CM4 90.8 8 CM4-Energy
density
89.66
3 CM1-CM5 89.66 9 CM5-CM8 89.66
4 CM1-CM6 91.95 10 CM5-logenergy 93.1
5 CM1-CM8 91.95 11 CM7-logenergy 90.8
[image:6.595.305.547.218.377.2] [image:6.595.58.280.628.710.2]Title of the Paper
input to binary support vector machine (SVM). This paper discusses the suitability of these feature sets for classification using multiclass support vector machine.
The proposed algorithm identifies a group of input feature sets suitable for classification of seven classes of arrhythmia. An accuracy of 93% is achieved for selected input sets for the MSVM. Accuracy upto 96% is obtained with multiple iterations and various training and testing size for SVM. Further, higher accuracy is obtained by increasing the ECG beat database size for the ECG features considered in this work.
This work shows time domain feature analysis with MSVM has better performance than morphological analysis for the same ECG data set. The single ECG beat analysis can be extended with frequency domain features, wavelet domain features to improve classification measure.
REFERENCES
1. Elias Ebrahimzadeh, Mohammad Pooyan, Ahmad Bijar, “Novel
Approach to Predict Sudden Cardiac Death (SCD) Using Nonlinear and
Time-Frequency Analyses from HRV Signals”, PLOS ONE February
2014 | Volume 9 | Issue 2 | e81896 pp. 1-14.
2. Kumar Narayanan, Sumeet S. Chugh, “The 12-lead electrocardiogram
and risk of sudden death: current utility and future prospects”, European Society of Cardiology, Europace (2015) 17, pp. ii7-ii13.
3. S Don, Duckwon Chung, Dugki Min, Eunmi Choi,”Analysis of
Electrocardiogram signals of Arrhythmia and Ischemia using Fractal
and Statistical Features”, Journal of Mechanics in Medicine and
Biology, Vol 13, No 1,2013 pp. 1350008-1to15
4. Eduardo Jose da S. Luz, William Robson Schwartz, Guillermo
Camara-Chavez, David Menotti, “ ECG-based heartbeat classification for arrhythmia detection: A survey”, Computer Methods and Program in Biomedicine 127 pp. 144-164 (0169-2607)@2015 Elsevier Ireland Ltd
5. Manab Kumar Das, Samit Ari, “ECG Beats Classification Using
Mixture of Features”, International Scholarly Research Notices, 2014; 2014:178436, PMCID:PMC4897569.
6. Mohammad Saad Billah, Tahmida Binte Mahmud, Farhana Sharmin
Snigdha, Muhammad Abdullah Arafat, “A Novel Method to Model
ECG Beats using Gaussian Functions”, 4th International Conference
on Biomedical Engineering and Informatics (BMEI) 2011 pp. 612-616.
7. Inderbir Kaur, Rajni, Anupma Marwaha, “ECG Signal Analysis and
Arrhythmia Detection using Wavelet Transform”, Journal of The
Institution of Engineers (India): Series B, December 2016, Volume 97, Issue 4, pp. 499–507.
8. Frank G. Yanowitz, “Introduction to ECG Interpretation V9.0”, year 2016.
9. http://www.physionet.org/physiobank/database/mitdb
10. Aeatures. Dallal, A. Kachouri, M. Samet, “Classification of Cardiac Arrhythmia Using WT, HRV and Fuzzy C-Means Clustering”, Signal Processing: An International Journal (SPJI), Volume (5): Issue (3): 2011 pp. 101-108.
11. Brikena Xhaja, Eglantina Kalluci, Ligor Nikolla, “Wavelet Transform
Applied In Ecg Signal Processing”, European Scientific Journal April 2015 edition vol.11, No.12 ISSN: 1857 – 7881 (Print) e - ISSN 1857- 7431 pp. 305-311.
12. Maedeh Kiani Sarkaleh and Asadollah Shahbahrami, “Classification Of
ECG Arrhythmias Using Discrete Wavelet Transform And Neural
Networks”, International Journal of Computer Science, Engineering
and Applications, Vol.2, No.1, February 2012 pp. 1-13.
13.Inan O. T., Giovangrandi L., Kovacs G. T. “A. Robust
neural-network-based classification of premature ventricular
contractions using wavelet transform and timing interval features”,
IEEE Transactions on Biomedical Engineering. 2006;53(12):2507–2515.doi: 10.1109/TBME. 2006.880879. [PubMed] [Cross Ref].
14. Pawel Tadejko, ZESZYTY NAUKOWE POLITECHNIKI
BIAŁOSTOCKIEJ 2007, Informatyka – Zeszyt 2, pp. 155-173.
15. Lakshmi Pratyusha P, Shanmukha Priya V, VPS Naidu, “Bearing
Health Condition Monitoring: Time Domain Analysis”, International
Journal of Advanced Research in Electrical, Electronics and Instrumentation Engineering, Vol. 3, Special Issue 5, December 2014 pp. 75-82.
16. Marta Borowska, “Entropy-Based Algorithms in the Analysis of
Biomedical Signals”, DE GRUYTER, SYUDIES IN LOGIC, GRAMMER AND RHETORIC 43 (56) 2015.
17. Z. Wang and X. Xue, “Support Vector Machines Applications”, DOI
10.1007/978-3-319-02300-7__2, © Springer International Publishing Switzerland 2014.
AUTHORSPROFILE
Sundari Tribhuvanam is obtained Bachelor of Engineering from the University of Mysore and Master of Engineering from Bangalore University, India. She is a research scholar under the guidance of H C Nagaraj in University of Mysore. Her areas of research and teaching are Biomedical Engineering, Signal Processing, Digital Image Processing, Image Analysis, Computer Vision, Medical Imaging and Computer-aided diagnosis.
H C Nagaraj obtained Bachelor of Engineering from the University of Mysore, Master of Engineering from P.S.G. College of Technology, Coimbatore and Ph.D. from IIT Madras, India. Five students obtained doctoral degree and currently seven students are pursuing research under his guidance. He is currently serving as Principal, Nitte Meenakshi Institute of Technology, Bangalore, India. He is a senior member of BMESI, ISTE and Fellow of IETE. His areas of interest are Bio-medical Signal Processing, Image Processing, Soft Computing and Communication Systems. He is an Academic Senate member of VTU, Belgaum, India.