International Journal of Innovative Technology and Exploring Engineering (IJITEE) ISSN: 2278-3075,Volume-8 Issue-12, October 2019
Abstract: Assessment of sitting condition on the car seat is important as the driver requires to remain seated while maneuvering the car. The seating situation with relatively restricted position and posture can lead to discomfort and fatigue among drivers. When the driver is getting fatigue, it may reduce the performance, and hence increase the risk of road accident. Up to this date, numerous study were conducted to solve this issue. However, majority of these studies performed the study in the laboratory. Furthermore, majority of the experiment were not used the actual car and provide clear interaction between driving posture and pressure distribution pattern. Hence, this study aims to determine the onset level of driver’s condition in term of discomfort rating scale and pressure distribution on the car seat under static condition by using actual car. Forty-four participants involved in this study by integrating discomfort rating assessment for the subjective evaluation and Pressure Sensor for the objective assessment. There were two main sections for subjective assessment that required the participant to provide the feedback on general discomfort level and body part discomfort while seating. Meanwhile, objective assessment used pressure map by Tactilus with 32 x 32 sensor matrix. All participants were required to sit on the car seat for five minutes. Findings showed that the driver’s discomfort and pressure pattern increased with time. In addition, the peak pressure distribution was found at the right buttock of the participant. Driving posture also influence the pattern of pressure distribution. This study provides a guideline for the automotive manufacturer to provide the optimal design of the car seat by maximizing the seat materials in term of quantity and quality with the highest pressure distribution levels. This adjustment can help to minimize the load concentration by providing a good pressure distribution.
Keywords: driver, design, comfort, ergonomics, car seat, pressure.
Revised Manuscript Received on October 05, 2019.
Nor Kamalian Khamis, Center for Materials Engineering and Smart Manufacturing (MERCU), Faculty of Engineering and Built Environment, Universiti Kebangsaan Malaysia, 43600 Bandar Baru Bangi, Selangor, Malaysia. Email: [email protected]
Ng Chun Tee, Center for Materials Engineering and Smart Manufacturing (MERCU), Faculty of Engineering and Built Environment, Universiti Kebangsaan Malaysia, 43600 Bandar Baru Bangi, Selangor, Malaysia. Email: [email protected]
Mohd Faizal Mat Tahir, Center for Integrated Design of Advanced Mechanical Systems (PRISMA), Faculty of Engineering and Built Environment, Universiti Kebangsaan Malaysia, 43600 Bandar Baru Bangi, Selangor, Malaysia. Email: [email protected]
Nabilah Sabri, Center for Materials Engineering and Smart Manufacturing (MERCU), Faculty of Engineering and Built Environment, Universiti Kebangsaan Malaysia, 43600 Bandar Baru Bangi, Selangor, Malaysia. Email: [email protected]
I. INTRODUCTION
Driver’s comfort can be influenced by many interacting factors such as the common driving practices of the driver and driving activities. However, past studies agreed that driver’s comfort is mainly determined by the car seat, where throughout driving duration, the driver is required to remain seated on it while operating and maneuvering the car. The contact areas between the human body and the car seat can be divided into seat pan, headrest and seatback. When seated, the driver has to find the optimal posture in order to avoid the occurrences of body discomfort and injury risk. The characteristics of a car seat can be influenced by several factors namely anthropometry, postural, seat properties and environment. Hence, it is essential to design a car seat that can contribute towards the comfort and seating adjustability [1]. Helander and Zhang [2] stated that the causes of sitting discomfort are particularly derived from by biomechanical causes. Pressure is the most common engineering causes that need to be considered in designing the good seat. Normally, pressure caused the sitter to feel discomfort and pain under static and dynamic condition due to spatial factors from the sitter position.
Pressure measurements are commonly used to evaluate the comfort between two surfaces. In this case, it refers to human body and the seat. The variation of pressure distribution on the seat surface is influenced by a few factors namely seat stiffness (condition), seat shape, seat material and drivers’ physical characteristics. Pressure is one of most important measurement relevant to physiological factors that influence comfort condition like interface pressure of seat and stress response presence [3]. A seating posture have been identified and measuring by interface pressure patterns such as peak gradient specifies contouring and material properties of cushion, backrest and lumbar support pressure ratio for the effectiveness, and peak pressure indicate seat height and depth. Pressure distribution could be examined and correlate with subjective ratings for precise and accurate result. There are two reasons for both correlations, (i) excessive pressure as one of the main sources of discomfort, and (ii) pressure distribution patterns as indicators of posture and supporting physics [4]. In the other hands, subjective rating of pressure distribution on seat pan and seat back is important aspect to enhance the safety, efficiency and comfort of the drivers.
Pattern of Pressure Distribution on the Car Seat
Under Static Condition and Its Relationship with
Driving Posture
Posture
The characteristic of human body, for instance the amount of fat arounds buttocks may provide more pressure [5]. The shape and size of the subject and the environment of the contact area between the body and seat (seat pan and seat back) has significant impact on static comfort assessment [6]-[8]. In addition, the size of the subject also influences sitting posture that leads to different joint angle when in driving position.Development of automotive seat with the ideal and optimal interface pressure is essential element as it is the huge contact area between human body and the seat. In addition, there an extensive study regarding to contact surface particularly focuses in the driver’s seat [9,10]. Interface pressure contribute to experience the comfort level with the influencing of anthropometric framework fluctuate related to age, cultures, and gender as well as different sitting conducted [11]. According to Paul [12], there are correlation between anthropometrics parameter and pressure distribution for rear seat measurement on a different type of seat. Nevertheless, Paul observed the peak pressure and discomfort were caused from the leather wrinkles, seams, and unevenness as well as the anthropological method. Khamis & Deros [13] concluded the characteristics of subject’s body area may influence the pressure distribution on the seat pan where the buttock area showed the higher pressure than the thigh area. A design of too long seat pan could cause a crucial pressure under the subject’s thigh area affecting restriction of the blood flows to the legs [5]. The interface pressure measurement methods to be a functional in development and evaluation of automotive seat comfort and producing a quick and useful information for designers and manufacturers in the design procedure [14,15].
II. METHODOLOGY
A. Criteria of participant
The study was done in UKM involving student, staff and visitors. Forty-four participants (mean age: 23.3 years old, mean height: 163 cm, mean weight: 58.1 kg, mean BMI: 21.9) comprising of 22 males and 22 females involved in this study. As a prerequisite, each participant must have at least three years driving experience to participate in this study. All of them should signed the informed consent form prior to be involved in the study, which complied with the ethics guidelines of the declaration in Malaysia. The protocol was approved and granted by the Ethical Committee from National University of Malaysia.
B. Selection of the car seat
A standard compact car from one of the national brand in Malaysia was chosen in this study. The car was chosen it was rated as the best-selling car with about 40 percent of vehicle’s overall sales maintained by this type of car. The car seat was a fabric type material.. The specification of the seat was tabulated in Table 2.
TABLE 2: SPECIFICATION OF THE CAR SEAT Dimension Value (cm)
Length of the seat pan 54 Width of the seat pan 48 Height of the back rest 56 Width of the back rest 50 Height of the head rest 24
C. Equipment of pressure measurement
[image:2.595.325.526.60.136.2]In this study, the Tactilus® pressure mapping with 32 x 32 sensor matrix as the pressure map sensor from Sensor Products Incorporations was used as depicted in Figure 1. The interface pressure distribution has been designed to provide information about the pressure value between the participants with the seating surface. It is designed to provide information on axial force or perpendicular to the interface.
Fig. 1.Tactilus® pressure mat
D. Measurement methods and data analysis
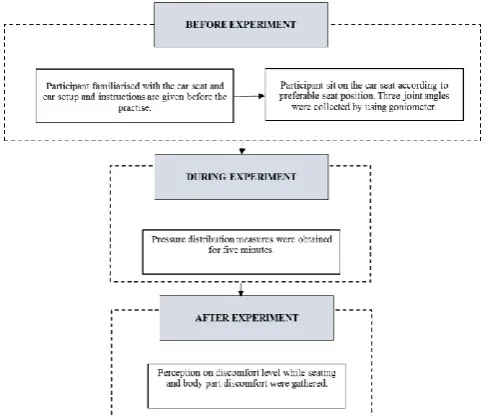
The measurement involving three stage of procedure which were need to be considered during the whole process involving prior, during and after the experiment. Figure 2 shows the overall flow chart for each participant in this study.
Fig. 2.Experiment flow chart for each participan
1) C.1-Prior Experiment of Measuring Seat Pressure
The experiment required the participant to be in the static position for a period of time. Any unpleasant in the participant’s attire will result discomfort and unnecessary movement to the respondent. Thus, prior to the experiment, the participant was instructed to wear appropriate cloth and flat shoes. The participant also required to remove items at the back pockets before sitting on
[image:2.595.351.497.247.332.2] [image:2.595.305.550.444.652.2]International Journal of Innovative Technology and Exploring Engineering (IJITEE) ISSN: 2278-3075,Volume-8 Issue-12, October 2019
It began with measuring some of the 15 anthropometrics parameter such as height and weight by using the anthropometry and weight scale. This parameters will become a basic in determine the driving posture. The other parameter will be measured along the way during the experiment process. .
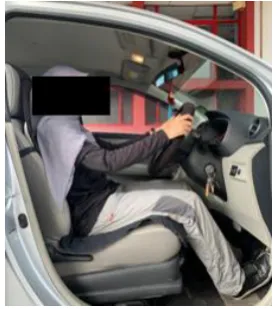
[image:3.595.104.244.186.341.2]Next, the participant was allowed to familiarize with the car seat adjustment prior to experiment. The participant was asked to sit on the car seat comfortably according to their preference, while grasping the steering wheel at the specific hand position as depicted in Figure 3.
Fig. 3.Seating position on the car seat
[image:3.595.54.286.478.583.2]Then, three joint angles (another anthropometry data) in preferred posture were measured by using goniometer namely; leg angle, hip angle (refer to angle in between thigh and back rest) as well as knee angle as illustrated in Figure 4. This measurement was recorded to understand the pattern of preferable driving position and describe driving posture within this sample. Adaptation of driving postures may be influenced by person characteristics, such as age, gender and height [16,17].
Fig. 4.Joint angle measurement
2) C.2-During the experiment of Measuring Seat Pressure
After the participants feel comfortable with their driving position, the experiment to measure the pressure were begun. The pressure measurement was conducted while the participant sit on it with their back leans against the back rest, their hand on the upper leg and the right leg on the accelerator pedal. Each participant was required to remain in this position for five minutes under static condition. This short duration was selected based on past studies to show the onset of pressure felt by the participant [6,18]. They were not allowed to move and change their position when this experiment started. When the duration 5 minutes is time up, the experiment was stopped, and the respondent is free again to move. Next, the data from the map was transferred to be analyzed.
3) C.3-After the experiment of Measuring Seat Pressure
At the end of the pressure measurement data collection, each participant was asked to evaluate the seating discomfort on the car seat based on the questionnaire as soon as the pressure measurement was completed to avoid inaccurate data. Questionnaire as one of the subjective assessment was used in this study, where it has two main sections, Section A: discomfort level while seating on the car seat by using three scale: discomfort, moderate as well as comfort, and Section B: body part discomfort while seating. The body part in Section B is divided into four body parts, namely the left thigh, the right thigh, the left back and the right back. Participants were asked to answer the part that they are uncomfortable by using following scale: 1 = comfort, 2 = moderate, and 3 = uncomfortable. Data from questionnaires and pressure measurements were analyzed. Finally, the discussions and results of the study were conducted and the conclusions of the experiment were recorded.
All in all, this article aims to determine the onset level of driver’s condition in term of discomfort rating scale and pressure distribution on the car seat under static condition by using actual car. There were three research questions in this study:
1. What is the feedback on discomfort rating and its relationship with seating time? Do they have similar or different feeling over time?
2. How is the pattern of pressure distribution on the car seat? Does the body part affect the pattern of distribution?
3. Is there any relationship between driver’s characteristics, driving posture and pressure distribution pattern?
III. RESULTSANDDISCUSSION
This section presents the results for the joint angle measurement, pressure distribution measurement as well as questionnaire assessment.
A. Joint angle results for three dimensions
Posture
TABLE 3:JOINT ANGLE DIMENSIONSDimen sion
Mean Standard deviation
5th percentile
95th percentile
M F M F M F M F
Leg angle (o)
51.05 36.59 7.66 4.70 34.6 30.30 63.4 50.10
Hip angle (o)
104.0 103.0 4.87 5.08 95.2 90.05 112 111.4
Knee angle (o)
96.27 96.00 12.6 8.25 77.2 78.75 116 108.7
a.
M=Male, F=Female
B. Pressure distribution on the car seat
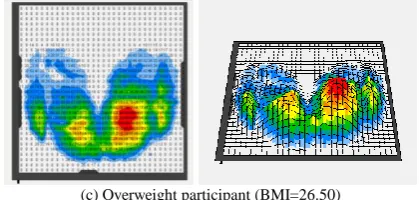
Figure 5 shows the pressure distribution pattern for three type of different BMI. According to Tactilus software, the pressure in an area is represented by colors starting with white, blue, green, followed by yellow, then orange and ending with red. The lowest pressure starts at white and continues to rise to red is the value reach at the certain point of pressure. Based on this pattern, the illustration shows that high pressure distribution for all subjects are more focused at the tuberosity area of the ischium (small area in the centre of the buttock), the buttock and the thigh area. With regards to difference in BMI, the lighter participant particularly underweight person will feel greater pressure under the tuberosity of their ischium (Figure 6 (a)). Meanwhile, a heavy person will feel the scattered pressure at the buttock area (Figure 6 (c)). Pressure distribution under the tuberosity as shown in Figure 6 (a) is the most recommended pattern by [21] due to the tissue is less sensitive in this area than under the thighs or under the knees. It indicates that a person with a dispersed pressure distribution is experiencing more discomfort than someone who has a concentrated pressure distribution.
(a) Underweight participant (BMI=17.80)
(b) Normal weight participant (BMI= 21.90)
[image:4.595.321.531.52.152.2](c) Overweight participant (BMI=26.50)
[image:4.595.41.302.57.183.2]Fig. 5.Pressure distribution pattern according to different BMI
Table 4 shows the pressure distribution value in the form of mean values, standard deviations, 5th and 95th percentiles of N = 22 male participants and 22 female participants. Based on Table 3, mean pressure of the female participants for four body parts are smaller than male participants.
TABLE 4:PRESSURE DISTRIBUTION VALUE ON THE CAR SEAT
b.
M=Male, F=Female As mentioned in the previous subsection, high pressure distribution for all subjects are more focused at the buttock and then followed by the thigh area. In addition, comparison of the pressure distribution between the left and right side also can be seen in this study. It was found that the mean pressure at the right side is larger than the left side. This condition occurred possibly due to seating position where the participant was required to put their right foot on the accelerator pedal. Hence, the participant feel more pressure at this side compared to the left side due to transmission of the human body’s weight. This fact is supported by the past study that highlighted the weight of human body which is primarily coming from the tuberosity ischium create the pressure distribution around the soft tissue that is in touch with the seat [22]. This transmission can be clearly depicted on the bulk muscular and bulk bones. In addition, another factors that influence the pressure distribution interface are seat characteristics and driving posture of the subject [23]. This fact is supported by analysis of Pearson correlation in this study, which shows there are strong relationship between weight and height of the participant with the mean pressure distribution value with p<0.05.
C. Subjective assessment findings
Feedback collected from the participants show that discomfort feeling is increasing with time, as shown in Table 5. The contrasting trend also found for comfort perception where it shows decrement trend over the time.
Dimension Mean Standard deviation
5th percentile
95th percentile
M F M F M F M F
Left thigh 0.6 1
0.4 9
0.25 0.17 0.25 0.27 1.19 0.78
Right thigh 0.9 1
0.7 7
0.31 0.22 0.47 0.33 1.68 1.12
Left buttock
1.5 9
1.3 2
0.41 0.30 0.90 0.82 2.52 1.73
Right buttock
2.2 7
1.9 9
[image:4.595.305.554.290.406.2] [image:4.595.80.271.474.566.2]International Journal of Innovative Technology and Exploring Engineering (IJITEE) ISSN: 2278-3075,Volume-8 Issue-12, October 2019
It is in line with the findings from past study that pointed out sitting discomfort will increase from the second minute to the next minute [24]. Furthermore, Caromano et al. [25] stated that participants provide the lack of comfort complaints when seating and this condition is increased with time.
TABLE 5:PERCEPTIONOFDISCOMFORTFEELING OVERTIME
Ranking Scale in percentage / Duration (minute)
Discomfor t
Moderate Comfort
1 4.6 45.4 50.0
2 9.1 50.0 40.9
3 15.9 43.2 40.9
4 34.1 43.2 22.7
5 56.8 27.3 15.9
The next questionnaire is on the overall body part discomfort when seating on the car seat. Table 6 shows the responses from the participant where it was found that majority of them feel uncomfortable at the right buttock, followed by the left buttock, right thigh and left thigh.
TABLE6:PERCEPTIONOFBODYPART DISCOMFORT
Ranking Scale in percentage / Duration (minute)
Discomfor t
Moderat e
Comfort
Left thigh 15.9 52.3 31.8
Right thigh 20.5 45.5 34.1
Left buttock 20.5 47.7 31.8
Right buttock 29.5 43.2 27.3
As clarified in the previous findings on the discomfort felt over the time, continuous contact between the seat and the person may lead to more discomfort over the time. As a result, in the worst condition, it will obstructed the blood flow and leads to oxygen deficiency, resulting in injury and fatigue [26]. In this study, it shows that body mass index also influences the pattern of pressure distribution. Underweight participant produce more force and stress under tuberosity ischium, while pressure pattern for bigger participant is more distributed at the buttock part. With respect to the pressure distribution configuration, it can be seen that there is similar pattern of pressure and discomfort felt based on the body part. The right buttock shows the highest value of both indicators in term of mean pressure and perception on discomfort. Comparison between gender groups indicated that male participants prefer larger joint angle when in driving position, particularly for the leg angle with nearly 150 of different. Based on past study, variation of body posture is affected based on gender. Women choose to sit and drive closer to the steering wheel, while men prefer to be in different driving positions [27]. More than 90 percent of participants with larger size, prefer to sit far away from the car controls. Since there are numerous postures that can be adopted by drivers, evaluating these postures is important to determine driver’s condition and well-being. Incorrect driving posture may result in body muscles not functioning properly and consequently will cause fatigue to the driver [28].
IV. CONCLUSION
Pressure distribution measurement provides systematic approach to determine the pressure relationship between the
human body and car seat. Objective assessment commonly use interface pressure value as a variable associated with subjective rating scales, which is known as one of the assessment practices of car seat’s comfort. The seat design weaknesses could be predictable by analyzing the pressure distribution measurement. A good pressure distribution can reduce discomfort feeling, and pain. It is due to good pattern of distribution can minimize the load concentration, and hence the blood flow of the driver will be smoother. As a result, it will help to prevent driving fatigue to occur. All in all, this study shows the findings related to relationship between seating time, body part and driver’s characteristics with pressure distribution pattern. Regarding seating time, the person experienced discomfort with increment of time. As a time increase, the perception on discomfort also shows similar trend. This is possibly due to the force that felt on the body part that is in contact with the seat. In term of pressure pattern based on the body part, the right side shows the highest pressure and discomfort feeling due to the driving task that requires the driver to put their right toe on the accelerator pedal. This will cause the pressure pattern to disperse and cause more discomfort. Furthermore, the person characteristics play an important role in determine the pressure value. As found in this study, weight and height of the person have a good relationship with the pressure distribution. Driving position also influenced the pressure distribution pattern in this study. All in all, comfortable driving is strongly influenced by driver’s physical characteristics, correct body posture, ergonomic seat design and driver’s workspace convenient with the driver. The seat design that features the greatest pressure distribution to support the body weight can yield to the most comfortable seating.
ACKNOWLEDGEMENT
This work was supported by the Universiti Kebangsaan Malaysia and Ministry of Higher Education, Malaysia under
Fundamental Research Grant Scheme
(FRGS/1/2018/TK03/UKM/03/2).
REFERENCES
1. Søndergaard, K.H., Olesen, C.G., Søndergaard, E.K., De Zee, M. and Madeleine, P., “The variability and complexity of sitting postural control are associated with discomfort,” Journal of Biomechanics, vol. 43, no. 10, pp. 1997-2001, 2010.
2. Helander, M.G and Zhang, L, “Field studies of comfort and discomfort in sitting,” Ergonomics, vol. 40, no. 9, pp. 895–915, 1997
3. Freivalds, A., Biomechanics of the upper limbs: mechanics, modeling and musculoskeletal injuries, CRC press, 2011.
4. Porter, J.M., Gyi, D.E. and Tait, H.A., “Interface pressure data and the prediction of driver discomfort in road trials.” Applied Ergonomics, vol 34, no. 3, pp.207-214, 2003.
5. Kolich, M., “Automobile seat comfort: occupant preferences vs. anthropometric accommodation.” Applied Ergonomics, vol. 34, no. 2, pp.177-184, 2003.
6. Hussain, Aini, S. Shahbudin, Hafizah Husain, Samad SA, and Tahir NM. "A simplified shock graph for human posture classification using the adaptive neuro fuzzy inference system." Journal of Information &computational Science, vol. 9, no. 8, pp. 2035-2048, 2012. 7. Mohamad, Darliana, Baba M. Deros, Dzuraidah A. Wahab, Dian D. I.
Daruis, and Ahmad R. Ismail. "Integration of comfort into a driver's car seat design using image analysis."
Posture
8. Hiemstra-van Mastrigt, S., Groenesteijn, L., Vink, P. and Kuijt-Evers, L.F., “ Predicting passenger seat comfort and discomfort on the basis of human, context and seat characteristics: a literature review,” Ergonomics, 60(7), pp. 889-911, 2017.
9. Mahmod SRB, Abdul Kadir MRB, Ajit Singh DK, Lee RYW. “Measurements of lumbar spine kinematics in sitting postures using accelerometers: A preliminary study.” International Convention on Rehabilitation Engineering and Assistive Technology, in Conjunction with SENDEX 2013. i-CREATe. 2013
10. Franz M, Durt A, Zenk R, and Desmet PMA, “Comfort effects of a new car headrest with neck support,” Applied Ergonomics, vol. 43, no. 2, pp. 336-43, 2012
11. Kilincsoy, U, Wagner, A, Vink, P, and Bubb, H, “Application of ideal pressure distribution in development process of automobile seats,” Work, vol. 54, no. 4, pp. 895–904, 2016.
12. Paul G, Daniell N, and Frayssea F, “Patterns of correlation between vehicle occupant seat pressure and anthropometry,” Work, vol. 41, pp. 2226-31, 2012.
13. Khamis, N.K and Deros, B.M, “Development of a statistical model for predicting seat pressure felt level in simulated condition based on direct and anthropometric measurement,” The Journal of Physical Therapy Science, vol. 30, no. 6, pp. 764 –769, 2018.
14. Muhammad Azmi, M.A.F, Ma’Aram, A, Kadir, A.Z.A, Ngadiman, N.H.A, “Risk factors of low back pain amongst port crane operator in Malaysia,” International Journal of Innovative Technology and Exploring Engineering, Vol. 8, no. 7 pp. 1434-1439, May 2019. 15. Romelfanger, M. and Kolich, M., “Comfortable automotive seat
design and big data analytics: a study in thigh support.” Applied Ergonomics, vol. 75, pp. 257-262, 2019.
16. Deros, Baba Md, Darliana Mohamad, Dian Darina Indah Daruis, Ahmad Rithaudden Yusoff, Jaharah A. Ghani, and Chairul Saleh. "Incorporating anthropometrics data in designing driver's seat for Malaysian made compact cars." Advances in Natural and Applied Sciences, vol. 8, no. 6, pp. 915-920, 2014.
17. Kyung, G. and Nussbaum, M.A, “Specifying comfortable driving postures for ergonomic design and evaluation of the driver workspace using digital human models,” Ergonomics, vol. 52, no. 8, pp. 939-953, 2009.
18. Mergl, C, Klendauer, M, Mangen, C. and Bubb, H, “Predicting long term riding comfort in cars by contact forces between human and seat,” (No. 2005-01-2690). SAE Technical Paper, 2005.
19. Dreyfuss, H. and Tilley, A.R., The measure of man & woman, John Wiley & Sons. New York, 2002.
20. Mohamad, D, Deros, B.M, Abdul Wahab, D, Daruis, D.D.I, and Ismail, A.R, “Integration of Comfort into a Driver’s Car Seat Design Using Image Analysis,” American Journal of Applied Sciences, vol. 7, no. 7, pp. 937–942, 2010.
21. Harrison, D. D., Harrison, S. O., Croft, A. C., Harrison, D. E., and Troyanovich, S. J, “Sitting biomechanics, part II: optimal car driver's seat and optimal driver's spinal model,” Journal of Manipulative and Physiological Therapeutics, vol. 23, no. 1, pp 37-47, 2000.
22. Ergic, T., Ivandic, Z., and Kozak, D., “The significance of contact pressure distribution on the soft tissue by men sitting,” International Design Conference-Design 2002, pp. 743-748, 2002.
23. Kyung, G, Nussbaum, M.A, and Babski-Reeves, K, “Driver sitting comfort and discomfort (part I): Use of subjective ratings in discriminating car seats and correspondence among ratings,” International Journal of Industrial Ergonomics, vol. 38, no. 5–6, pp. 516–525, 2008.
24. Shelley A. Crawford, May D. Stinson, Deirdre M. Walsh, and Alison P. Porter-Armstrong, “Impact of Sitting Time on Seat-Interface Pressure and on Pressure Mapping With Multiple Sclerosis Patients,” Archives of Physical Medicine and Rehabilitation, 2005.
25. Caromano, Fátima & Aparecida Padoin de Amorim, Cristina & de Fátima Rebelo, Cristina & Maria Contesin, Adriana & Favero, Francis & Costa, Jecilene & Kawai, Milena & Voos, and Mariana, “Prolonged sitting and physical discomfort in university students,” Acta Fisiátrica, vol. 22, pp. 176-180, 2015.
26. Lueder, R. Ergonomics of seated movement: A review of the scientific literature. Humanics Ergosystem Inc., 2004.
27. McFadden M, Powers J, Brown W, and Walker M., “Vehicle and driver attributes affecting distance from the steering wheel in motor vehicles.” Human Factors, vol. 42, no. 4, pp. 676-682, 2000. 28. Schmidt, S., Amereller, M., Franz, M., Kaiser, R. and Schwirtz, A., “A
literature review on optimum and preferred joint angles in automotive
sitting posture.” Applied Ergonomics vol. 45, no. 2, pp. 247-260, 2014.
AUTHORS PROFILE
Nor Kamaliana Khamis was born in Perlis, Malaysia. She received her Ph.D. and Dr.-Ing from Universiti Kebangsaan Malaysia, Malaysia and University of Duisburg-Essen, Germany in 2018. In 2007, she joined Motorola Technologies as the Mechanical Engineer. Then, she joined Universiti Kebangsaan Malaysia as a Tutor. Now, she is a Senior Lecturer in Faculty of Engineering and Built Environment, Universiti Kebangsaan Malaysia. Her research interest are in the field of ergonomics, environmental analysis and automotive.
Ng Chun Tee received his degree in Mechanical Engineering from Universiti Kebangsaan Malaysia, Malaysia in 2019. He was born on 17 March 1996 in Penang, Malaysia.
Mohd Faizal Mat Tahir is a faculty member at the Center for Integrated Design of Advanced Mechanical Systems (PRISMA), Faculty of Engineering and Built Environment, Universiti Kebangsaan Malaysia. He earned both his Bachelor degree and Master degree from Universiti Kebangsaan Malaysia (UKM), in the field of Mechanical Engineering. He obtained his PhD degree at Loughborough University, UK, in 2019 from the school of Aeronautical, Automotive, Chemical and Material Engineering. His research interest are in the field of noise and vibration, ergonomic and digital image correlation.