International Journal of Innovative Technology and Exploring Engineering (IJITEE) ISSN: 2278-3075, Volume-8 Issue-12, October 2019
Abstract: The district of Comas in Lima, Peru, is considered one of the districts with the highest number of critical points due to the accumulation of solid waste, causing the proliferation of vectors and the generation of bad smells, producing in this way a negative environmental and social impact on the population and on the landscape characteristics of the environment. The objective of this investigation is to evaluate the risk produced by the critical points of solid waste identified in Tupac Amaru Avenue, in the district of Comas, using the Grey Clustering method. This method allows to consider the uncertainty in the analysis being an adequate methodology for the evaluation of the risk of critical points since it is an issue of high level of uncertainty due to the limited information. The criteria for the evaluation of the risk of the critical points are according to the methodology of the Risk Evaluation Guide of the Ministry of the Environment. Five critical points of solid waste identified in the corresponding Tupac Amaru Avenue in all Zone 1 of the district of Comas were evaluated during 3 days. The results revealed that the three of the monitoring points present moderate risk and two slight risk. This study could be a useful tool for decision making by local and regional authorities to prioritize critical points for eradication and prevention.
Keywords: Grey clustering method, Risk assessment, Solid waste.
I. INTRODUCTION
T
he inappropriate management of solid waste has negative repercussions on the population involved from different aspects, such as the health of the surrounding individuals, their ecosystems and their quality of life [1].Direct health impacts mainly affect formal and informal collectors and segregators. These impacts are aggravated when hazardous wastes are not separated at the point of origin and mixed with municipal wastes [2]. Solid waste that is not disposed of properly, especially excrement and other household and community waste, can lead to the spread of infectious diseases such as dengue, leptospirosis, skin infections, etc., attracting undesirable animals such as flies, rats, among others [3].
On the other hand, impacts on ecosystems include pollution of water resources, air, soil, and diverse tropical ecosystems. Not to mention that the accumulation of solid waste can form a barrier to contain the flow of water, causing
Revised Manuscript Received on October 05, 2019.
* Correspondence Author
Alexi Delgado*, Department of Engineering, Mining Engineering Section, Pontificia Universidad Católica del Perú, Lima, Peru. Email: [email protected]
R. Buleje, Z. Muñoz, B. Reyes, R. Tenorio, Environmental Engineering Program, Universidad Nacional de Ingeniería, Lima, Peru. Email: [email protected]
Ch. Carbajal, Administration Program, Universidad de Ciencias y Humanidades, Lima, Peru. Email: [email protected]
local flooding, resulting in long-term loss of fertile soils [2]. For the reasons mentioned above, a study has been conducted focusing on the district of Comas, located in the Northern Cone of Metropolitan Lima, which has a total surface of 4,875 Has. (48.72 Km2) that represents 5% of the territory of the Northern Cone and 1.7% of Metropolitan Lima. Comas is a district that suffers from solid waste contamination in the district due to the following reasons: (a) Limited tax collection capacity of public cleaning and supervision arbiters. (b) A large part of the population is unaware of the characteristics, costs, and expenses of providing municipal public cleaning services. (c) Weak sanctioning capacity. (d) Lack of managerial integration of solid waste competency areas. (e) Lack of awareness, environmental education, and scarce citizen participation.
In addition, unfortunately, one of the main problems for the municipality of this district is the inadequate management of solid waste, since the Public Cleaning Service is a municipal responsibility and action, whose neglect affects both the health of the population and the environment, as it has been mentioned before.
In the present study, a methodology is used to evaluate the risk in the human environment produced by critical points of solid waste in the district of Comas, with the help of the Grey Clustering methodology [4], which helps to solve problems with small samples or limited information. The article is organized in the following parts: Introduction, methodology, results and discussions, conclusions and bibliographical references.
II. METHODOLOGY
The Grey Clustering method is based on the theory of grey systems [5]. Grey systems study problems with small samples or with limited information, this being an advantage due to the fact that studies of socio-environmental phenomena tend to have this characteristic, which is why this methodology has already been applied in different areas such as water management [6], environmental conflicts [7], and occupational safety management.
The Grey Clustering method was developed to classify observation indices or observation objects into categories using Grey incidence matrices or whitenization weighting functions. The method is mainly applied to test if the observation groups belong to predetermined categories.
In the present study, the Grey Clustering method based on Center-point Triangular Whitenization Weight Functions (CTWF) was used [8].
Risk Assessment of Critical Solid Waste Points
in Lima, Peru, using the Grey Clustering Method
It is assumed that there is a set of "m" groups, a set of "n" criteria and a set of "s" different Grey classes, according to the sample value xij (i = 1, 2,..., m; j = 1, 2,..., n), in which for the group you have (i = 1, 2,..., m), and for the criterion you have (j = 1, 2,..., n). In addition, the steps for class grouping, based on CTWF can be expressed as follows:
Step 1: The individual ranks of the criteria are divided into "s" Grey classes, then determine the focal points of each rank at λ1, λ2... λs of Grey classes 1,2,...,s.
Step 2: Grey classes are expanded in two directions, adding Grey classes 0 and (s+1) with their central points λ0 and λs+1 respectively. Therefore, the new sequence of central points is established λ0, λ1, λ2... λs, λs+1 (as it is shown in Fig. 1). Therefore the CTWF for class Grey 𝑘𝑡ℎ,
k=1, 2... s, from criterion 𝑗𝑡ℎ, j = 1, 2,..., n, for an observed
[image:2.595.308.548.124.396.2]value 𝑥𝑖𝑗 is defined by Equation 1.
Fig. 1.Center-Point Triangular Whitenization Functions
𝑓𝑗𝑘=
𝑥−𝜆𝑗𝑘−1
𝜆𝑗𝑘−𝜆𝑗𝑘−1 𝑥 ∈ (𝜆𝑗 𝑘 −1, 𝜆
𝑗 𝑘]
𝜆𝑗𝑘+1−𝑥
𝜆𝑗𝑘+1−𝜆𝑗𝑘 𝑥 ∈ (𝜆𝑗 𝑘, 𝜆
𝑗 𝑘 +1)
0 𝑥 ∈ 0, 𝜆𝑗𝑘 −1 ∪ [𝜆𝑗𝑘 +1, ∞)
(1)
𝑓𝑗𝑘(𝑥𝑖𝑗) is the CTWF of the 𝑘𝑡ℎ class Grey of criterion 𝑗𝑡ℎ,
and 𝑛𝑗 is the weight of criterion j.
Step 3: The clustering coefficient 𝜎𝑗𝑘, which indicates the
weight of the criteria, for group i, i = 1, 2... m, with respect to class k, k = 1,..., s is calculated using Equation 2.
𝜎𝑖𝑘= 𝑛𝑗 =1𝑓𝑗𝑘 𝑥𝑖𝑗 . 𝑛𝑗 (2)
If , we decide that object i belongs to class Grey k*. When there are several objects in the Grey k* class, these objects can be sorted according to the magnitudes of their clustering coefficients.
For this work the "i" groups are determined by the critical points of accumulated solid waste found throughout the study area, and the "j" criteria are determined by: quantity, degree of danger, extent, population potentially affected, as well as the ranges of these criteria are detailed below.
III. CASE STUDY
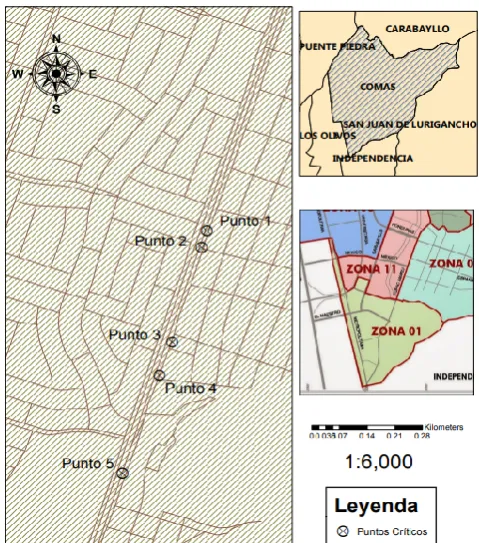
[image:2.595.66.283.289.390.2]The application of the method was conducted in 5 critical points identified in the corresponding Tupac Amaru Avenue in all Zone 1 of the district of Comas, as it's shown in Fig. 2.
Fig. 2. Map of the location of monitoring points in the
comas district.
A. Monitoring Points
The description of the location of the five monitoring points is shown in Table I.
Table-I: Location of monitoring points
Code Description Coordinates
P1
Urb. Huaquillay Av. Tupac Amaru
Cdra. 48
276448 E - 8677329S
P2 Policlínico Fe 276435 E - 8677284 S
P3 Av. San Martín (Paradero
correo) 276360 E- 8677027 S
P4 Cerca de Mega 80 (Cuadra 6)
Los Ángeles 276327 E- 8676936 S
P5 Túpac Amaru 264 Urb. La
Merced 276234 E - 8676669 S
B. Evaluation criteria
The criteria and values for risk assessment are based on the Environmental Risk Assessment Guide, which proposes a standardized model for the identification and assessment of the environmental risks generated by productive activities in a geographical area, as well as the consequences of hazards [9]. The following was considered to determine the risk in the human environment (Table II):
𝒙 0
1 𝒚
𝑦 = 𝑓𝑗1 𝑦 = 𝑓𝑗2 𝑦 = 𝑓𝑗3 𝑦 = 𝑓𝑗𝑛
[image:2.595.305.549.512.647.2]International Journal of Innovative Technology and Exploring Engineering (IJITEE) ISSN: 2278-3075, Volume-8 Issue-12, October 2019
Table-II: Estimation of gravity in the human environment
Gravity Limits of the Environment Vulnerability
Human Environment
= Quantity+2 Level of hazard + Extension
+Potentially affected population
Based on standard UNE 15008 2008-Evaluation of environmental risks cited in the Environmental Risk Assessment Guide.
1) Quantity:
For the assignment of values of this factor, OEFA is taken as a reference, considering as a critical point the accumulation of solid waste with a volume of at least 1.5m3 [9].
2) Level of hazard:
It represents the intrinsic property of the substances and the level of affectation, for this it is necessary to identify the composition of the residues existing in the critical points, in the definition, they clarify that the critical points are municipal solid [3]:
Household solid waste
Non-domestic waste (roads and public spaces) Special municipal waste (waste that requires
particular handling such as environmental tests, lubrication centers, demolition waste or remodeling of minor works, where the generator must ensure the disposal of their waste). Nevertheless, in public roads, special waste becomes public road waste.
In order to calculate the value of the degree of danger, the percentage by volume of the composition of residues present at the critical point will be considered, based on the characteristics of the residues. It is detailed as follows:
a) Organic Waste (OW)
These organic wastes are generated by homes and businesses, representing a greater risk to health, as they generate the presence of bad odors, pets and vectors, due to their biodegradable property [10] (Table-III).
Table-III: Range of the percentage of organic waste with its valuation
Value Percentage of organic waste (%)
4 51-100
2 10-50
1 < 10
b) Public cleaning residues
The types of waste covered are: dust, soil, stone, asphalt, leaves, branches and those considered similar. Being the pruning waste which generate the greatest risk due to its biodegradable property [11] (Table IV).
Table-IV-Range of the percentage of waste from public cleaning with its assessment
Value Percentage of organic waste (%)
2 25-100
1 < 25
c) Hazardous waste
The types of waste covered are those with properties: explosive, radioactive, corrosive or biological. Generally, this waste comes from hospitals, airport waste, laboratory waste, laboratory containers, WEEE, among others [12] (Table-V).
Table-V: Range of the percentage of hazardous waste with its assessment
Value Percentage of organic waste (%)
4 25-100
3 <25
Demolition waste, plastics, paper, dust, among others, do not represent a risk, as they are inert representing a value of 0. From the established, the degree of dangerousness is considered as the sum of (Equation 3):
Danger Level = Organic Waste + Public Cleaning Waste + Hazardous Waste (3)
3) Extension
It is the area of influence of critical points in public spaces; for this reason, it was considered an area of influence, accumulation, persistence and geographical characteristics.
a) Influence area:
The valuation was performed according to the influence area as shown in Table VI.
Table-VI: Valuation according to the influence area
Value Influence area Description
1 Spot If the action produces a very localized effect
2 Generalized
The effect does not admit a precise location, having as generalized influence everything
(channels, roads, complete blocks)
b) Accumulation:
A progressive increase in the amount of solid waste at a specified point (Table-VII).
Table-VII: Valuation according to the progressive increase in the quantity of waste
Value Range Description
0 Nil Volume of waste is reduced over time
2 Constant The accumulation of waste remains constant over time
4 Cumulative The accumulation of waste has increased over time
c) Persistence:
Table-VIII: Persistence for evaluation
Value Persistence Description
1 Fleeting Accumulation remains less than 24 hours
3 Temporary Accumulation remains between 24 hours and 48 hours
5 Permanent Accumulation remains for more than 48 hours
d) Geographical characteristics:
It is the characteristics of the environment (temperature and humidity), which influence the extent of the impact, the value for geographical characteristics is obtained by adding together the values designated for temperature and humidity. The criteria to establish the temperature and humidity ranges have been established using as a reference the ranges established by Digesa [13] (Equation 4) (Table-IX).
Geographical characteristics = Temperature + Humidity (4)
Table-IX: Evaluation of hazard degrees
Value Temperature(°C)
1 <20
2 >20
Value Relative humidity (%)
1 <80%
2 >80%
The extension is obtained by adding the values assigned to each factor (Equation 5):
Extension = influence area + accumulation + persistence + geographical characteristics (5)
4) Potentially affected population
a) Healthcare:
This parameter is measured through a survey of the population close to the critical points, and the perception of the evaluator's senses is considered [14] (Table-X).
Table-X: Assessment of affected population
Value Healthcare
2 Presence of vectors
3 Unpleasant odors
1 Presence of domestic animals
b) Vulnerability:
Decreased capacity of the population to withstand and resist the effects of solid waste accumulation. This factor includes establishments close to the critical points. Values for the affected population are obtained from OEFA, 2019 [9] (Table-XI).
Table-XI: Assessment of affected population
Value Nearby Establishments
4 Health Posts
3 School
2 Market
2 Restaurant
From the established, the degree of population potentially affected is considered as the sum of (Equation 6):
Degree of affected population = Health + Vulnerability (6)
Based on the criteria mentioned above, the following Table was established (Table-XII).
Table-XII: Levels of risk in the human environment due to critical solid waste points
Levels Mild Moderate Serious Critical
Quantity (m3) < 1.5 [1.5-5> [5-15> >15
Degree of hazard [0-2> [2-4> [4-7> [7-10]
Extension [4-6> [6-9> [9-12> [12-15]
Population possibly
affected [0-4> [4-8> [8-12> [12-17]
c) Data obtained
During the 3-day monitoring, the following data was obtained at each critical point (Table-XIII).
Table-XIII: Data from each parameter for each monitoring point
Criteria P1 P2 P3 P4 P5
Quantity 0,5 2,3 2,3 2,2 23,7
Hazard 4,0 3,3 4,0 3,0 3,5
Extension 4.66 8.66 4.66 4.66 4,0
Population 7,0 11,0 7,0 7,0 10,0
Then, considering the results of the monitoring and the proposed human environment risk methodology, the calculations are presented in the next section.
d) Calculations
The calculations based on the Grey Clustering method are presented below.
Step 1: It is obtained from Table XII, the central points of each grey class, the values are shown in Table XIV.
Table-XIV: Central point of grey classes
Criteria Mild Moderate Severe Critical
Quantity 0,75 3,25 10 16,75
Hazard 1 3 5,5 8,5
Extension 5 7,5 10,5 13,5
Population 2 6 10 14,5
International Journal of Innovative Technology and Exploring Engineering (IJITEE) ISSN: 2278-3075, Volume-8 Issue-12, October 2019
Table-XV: Dimensional values of the central classes of the grey classes
Criteria Mild Moderate Severe Critical
Quantity 0,10 0,42 1,30 2,18
Hazard 0,72 0,67 1,22 1,89
Extension 0,55 0,82 1,15 1,48
Population 0,25 0,74 1,23 1,78
Table-XVI: Dimensioned monitoring values
P1 P2 P3 P4 P5
Quantity 0,07 0,30 0,30 0,29 3,08
Hazard 0,89 0,73 0,89 0,67 0,78
Extension 0,51 0,95 0,51 0,51 0,44
Population 0,86 1,35 0,86 0,86 1,23
Table-XVII: Criteria weights
Criteria Weight
Quantity 1
Hazard 2
Extension 1
Population 1
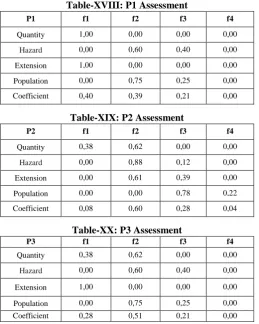
Step 3: The monitoring point layer is evaluated in the whitenization functions, which are assembled according to step 2 of the methodology.
[image:5.595.41.301.464.789.2]Clustering coefficients are obtained by multiplying the values of each function by the weight of the criteria shown in Table XVII. These are presented at the end of each Table (see from Table XVIII to XXII).
Table-XVIII: P1 Assessment
P1 f1 f2 f3 f4
Quantity 1,00 0,00 0,00 0,00
Hazard 0,00 0,60 0,40 0,00
Extension 1,00 0,00 0,00 0,00
Population 0,00 0,75 0,25 0,00
Coefficient 0,40 0,39 0,21 0,00
Table-XIX: P2 Assessment
P2 f1 f2 f3 f4
Quantity 0,38 0,62 0,00 0,00
Hazard 0,00 0,88 0,12 0,00
Extension 0,00 0,61 0,39 0,00
Population 0,00 0,00 0,78 0,22
Coefficient 0,08 0,60 0,28 0,04
Table-XX: P3 Assessment
P3 f1 f2 f3 f4
Quantity 0,38 0,62 0,00 0,00
Hazard 0,00 0,60 0,40 0,00
Extension 1,00 0,00 0,00 0,00
Population 0,00 0,75 0,25 0,00
Coefficient 0,28 0,51 0,21 0,00
Table-XXI: P4 Assessment
P4 f1 f2 f3 f4
Quantity 0,42 0,58 0,00 0,00
Hazard 1,00 0,00 0,00 0,00
Extension 1,00 0,00 0,00 0,00
Population 0,00 0,75 0,25 0,00
Coefficient 0,68 0,27 0,05 0,00
Table-XXII: P5 Assessment
P5 f1 f2 f3 f4
Quantity 0,00 0,00 0,00 1,00
Hazard 0,00 0,80 0,20 0,00
Extension 1,00 0,00 0,00 0,00
Population 0,00 0,00 1,00 0,00
Coefficient 0,20 0,32 0,28 0,20
Step 4: For each point evaluated, the highest coefficient obtained is chosen and a denomination is assigned according to Table XII. The results are shown in Table XXIII.
Table-XXIII: Summary of the assessment
Coefficient Denomination
P1 0,40 Mild
P2 0,60 Moderate
P3 0,51 Moderate
P4 0,68 Mild
P5 0,32 Moderate
IV. RESULTS AND DISCUSSION
Using the Grey Clustering method it was obtained that three of the critical points of monitored solid waste are of moderate risk and two of slight risk [15]. In addition, the risk generated by these solid wastes can be ordered from greater to lesser risk, as can be seen below:
P2>P3>P5>P4>P1
This sequence indicates that the critical point 2 located in front of the Policlinico Fe, represents a greater risk to health than the other critical points located in Av, Tupac Amaru due to the fact that there is a greater vulnerability to people in a medical center.
V. CONCLUSIONS
but does not include the volume of waste, the degree of hazardousness or the extension, which is considered in this study.
In addition, the Grey Clustering method presents a good potential for application in different problems to determine the environmental risk generated by productive activities in a geographical area, since these have high uncertainty due to the lack of information and the fact that it is applied in small populations or small samples.
REFERENCES
1. T. P. Karjalainen and T. Järvikoski, “Negotiating river ecosystems: Impact assessment and conflict mediation in the cases of hydro-power construction,” Environ. Impact Assess. Rev., vol. 30, no. 5, pp. 319–327, 2010.
2. D. B. Salazar et al., “Guía Para la Gestión del Manejo de Residuos
Sólidos Municipales Enfoque: Centroamérica,” 2003.
3. Y. Salume, E. Darko, and W. Agyemang-Duah, “Solid Waste Disposal and Community Health Implications in Ghana: Evidence from Sawaba, Asokore Mampong Municipal Assembly,” J Civ. Env. Eng, vol. 5, no. 6, 2015.
4. A. Delgado, A. Aguirre, E. Palomino, and G. Salazar, “Applying triangular whitenization weight functions to assess water quality of main affluents of Rimac river,” Proc. 2017 Electron. Congr. E-CON UNI 2017, vol. 2018-Janua, pp. 1–4, 2018.
5. J. Deng, “Introduction to Grey System Theory,” J. Grey Syst., vol. 1, pp. 1–24, 1989.
6. L. N. Zhang, F. P. Wu, and P. Jia, “Grey Evaluation Model Based on Reformative Triangular Whitenization Weight Function and Its Application in Water Rights Allocation System,” Open Cybern. Syst. J., vol. 7, no. 1, pp. 1–10, 2013.
7. A. Delgado and I. Romero, “Environmental conflict analysis on a hydrocarbon exploration project using the Shannon entropy,” in
Proceedings of the 2017 Electronic Congress, E-CON UNI 2017, 2018, vol. 2018-Janua.
8. S. Liu and Y. Yang, “Explanation of terms of grey clustering evaluation models,” Grey Syst. Theory Appl., vol. 7, no. 1, pp. 129–135, Feb. 2017.
9. “Guía para Evaluación de Riesgos Ambientales,” Lima, Perú, 2011. 10. W. M. A. Ahmedelbdawy, A. A. A. Abuelnuor, A. A. M. Omara, and
S. A. Taha, “An experimental study on landfill technology to produce an alternative source of energy from organic waste,” in 2018 International Conference on Computer, Control, Electrical, and Electronics Engineering, ICCCEEE 2018, 2018.
11. D. Beery, K. Reinhardt, P. B. Smith, J. Kelley, and A. Sivasothy, “Post etch residue removal: Novel dry clean technology using densified fluid cleaning (DFC),” in Proceedings of the IEEE 1999 International Interconnect Technology Conference, IITC 1999, 1999, pp. 140–142. 12. Y. Fang and G. Xu, “The research of hazardous waste management
system in Guangdong Province based on WebGIS,” in Proceedings - 2009 International Conference on Environmental Science and Information Application Technology, ESIAT 2009, 2009, vol. 1, pp. 317–319.
13. A. Delgado, “Citizen criminality assessment in lima city using the grey clustering method,” in 2017 IEEE XXIV International Conference on Electronics, Electrical Engineering and Computing (INTERCON), 2017, pp. 1–4.
14. S. Wang et al., “Blockchain-Powered Parallel Healthcare Systems Based on the ACP Approach,” IEEE Trans. Comput. Soc. Syst., vol. 5, no. 4, pp. 942–950, Dec. 2018.
15. M. Kim, Y.-C. Jang, and S. Lee, “Application of Delphi-AHP methods to select the priorities of WEEE for recycling in a waste management decision-making tool,” J. Environ. Manage., vol. 128, no. 0, pp. 941–948, 2013.