Abstract Background/Objectives: Adaptive cluster sampling (ACS) is known as a sampling design for rare and clustered objects. We suggest the regression estimator to improve the efficiency of ACS estimator.
Methods/Statistical analysis: We estimate the population total of Pedicularisishidoyana Koidz. &Ohwi in the Gyeongju National Park by using the regression estimation for adaptive cluster sampling. We can consider an auxiliary variable which has strong correlation in the estimation procedure. To do this we simulate auxiliary variable has sample correlation r=0.86. The efficiency of the proposed estimator is evaluated by comparing the relative efficiency and 95% confidence limit of estimator with the typical adaptive cluster estimator.
Findings: In this study, we found that the regression estimator
I.INTRODUCTION
Adaptive cluster sampling design is known as a sampling method for rare clustered population. This method is often useful after locating a unit that meets a specified criterion to continue sampling in that region. In spatial sampling, adaptive cluster sampling can be provided unbiased efficiency for estimating the abundance of rare, clustered populations[1]. For sampling hidden human populations such as drug abuse, an illegal private loan or a prevalence of rare diseases, social links play the same role as geographic proximity in spatial sampling and adaptive cluster sampling becomes a type of link-tracing design in a graph or social network [2,3].The adaptive sampling performs when the variable of interest for a unit in the sample satisfies a pre-specified condition, neighboring or connected units are added to the sample and observed. This procedure continues until no more units are found that meet the criterion.
The adaptive sampling has an advantage that it is more flexible than conventional survey sampling, because the sampling design depends on the variable of interest neighboring or connected units are added to the sample and observed in the survey field[6,7,9]. Also, it has an advantage of obtaining enough observations compare to a conventional sampling method. Recently, it has been suggested a new estimator using stratified adaptive cluster sampling [4]. They have shown that the ratio estimator for adaptive cluster sampling is more efficient than the typical adaptive sampling.
In this study, we propose the regression estimation method
Revised Manuscript Received on May 22, 2019.
1Chang-Kyoon Son, Department of Applied Statistics, Dongguk University,38066, DongdaeRo123,Gyeongju, Gyeongbuk, Korea
using an auxiliary variable related to the variables of interest so that we investigate rare domestic indigenous plants,
Pedicularisishidoyana Koidz. & Ohwi, which is native plants to Gyeongju National Park in Korea, and we consider the growth environment asthe auxiliary variable such as the humidity, temperature and location of a rare native plant. Finally we compared the efficiency of the proposed estimator with the existing estimator by adaptive cluster sampling.
II.MATERIALSANDMETHOD 2.1. Review of the adaptive cluster sampling
Adaptive sampling method which the initial sampling unit by a given sampling design, then observes the sampled unit, and if the specific condition is satisfied, the method of additionally observing the unit and the neighboring object is included in the sample. If an initial sample unit is drawn by a given probability design and the sampling unit satisfies a given condition, then adaptive cluster sampling is a method of additionally including neighboring units of the object in a sample. For example, rare minerals and oil exploration do not show signs of minerals or oil in many areas, but if you discover the mineral in a particular area, or if you have found oil, it is natural to try to find or dig out further. Also, it is similar to investigate a disease in a specific area. It is a further investigation of the person around the infected person or the individual who has a certain relationship. In this respect, adaptive cluster sampling is a particularly suitable method for examining populations that are rare and forming communities in a particular area, and if the same sample size is used, this method is more accurate than conventional sampling methods [1,2,5,6].
In adaptive cluster sampling, the neighborhood is the set of observations to be added to the sample when the observation value satisfies a certain condition. The neighbors of the observed values are defined as the upper, lower, left, and right sides of the initial observation value as Figure 1[1,2,3].
Figure 1. Neighborhood Units
On the other hand, if the interest condition is a set of values in the range of the interest variable, then if
Regression Estimator for Adaptive Cluster
Sample
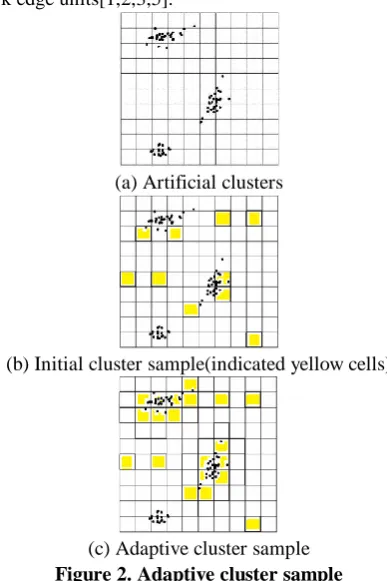
is in , the observation value is said to meet the condition and all observations in that neighborhood are included in the sample. In general, is a set of values greater than or equal to some constant. If , that is, if the observation contains at least one unit, the observation satisfies the condition[11,12]. A cluster is a set of all observations contained in the sample when the observation value is initially selected. The cluster consists of only the observation value if the observation value does not satisfy the condition. When the observation value satisfies the condition, the cluster includes not only the neighbor of the observation value and the observation value but also the neighboring neighbor of the observation value satisfying the condition as Figure 2. A network is a subset of a cluster, consisting of all the units of a cluster that satisfy a condition. The network is characterized in that all units of the network are included when the unit of the network is selected in the initial sample. An edge unit is a unit in the neighborhood of an observation that does not meet the condition but meets the condition. Observation values can be one or more cluster or network edge units[1,2,3,5].
(a) Artificial clusters
(b) Initial cluster sample(indicated yellow cells)
[image:2.595.74.268.312.603.2](c) Adaptive cluster sample
Figure 2. Adaptive cluster sample
The adaptive cluster sampling is designed in such a way that it is influenced by the initial set design of the unit selected by the probability sampling and when the random variable of the selected unit satisfies the given condition, it is added among the neighbors of the unit [1,2,3].
The basic assumptions for deriving the adaptive cluster estimator are following;
i)Neighboring units are predetermined before sampling and are not determined at the site.
ii)If the observation value the selected unit in the sample satisfies a specific condition for adaptive sampling, ,the neighboring unit of the unit is included in the sample.
iii)If other units satisfy the condition, they also include their neighbor unit in the sample.
Until there are units that do not satisfy this condition (border of the edge unit), continues to sample, ultimately identifying the units included in the sample and defining the initial sample as.
2.2. Estimator for an adaptive cluster sampling
For the adaptive cluster estimation, let be the number of sampling units in the population, let be the value of the th observation unit, be the network of the th sampling unit, be the number of sampling units in , be the total number of sampling units in the network that are edge units, and is the number of units finally included in the sample. Suppose that an initial sample unit is taken with SRSWOR, then the inclusion probability for the th unit is
, (2.1)
where is the number of units in the network which known for the sampled unit, but that is unknown.
If we knew the inclusion probability for all sample units, we defined the Horvitz-Thompson(HT) estimator for the population total as following,
, (2.2)
where be the -values of the distinct units in the final sample, and takes the value 1 if unit is included in the sample and 0 otherwise.
An alternative, the partial inclusion probability of th unit does not satisfy a given condition is defined by
. (2.3)
The unbiased estimator of population total is
, (2.4)
where is indicator variable with 1, if the initial sample intersect to the network , 0 otherwise.
In order to expression network unit instead of sampling unit, the total number of the network is , is set of including unit in the th network, and is the number of sampling unit in the th network, then the inclusion probability of sampling unit in the th network is
. (2.5)
The unbiased estimator for population total is
, (2.6)
where is the total of units in the th network. The variance estimator of the sample total and its variance are given by respectively.
, (2.7)
, (2.8)
where the joint intersection probability of network and , is
(2.9)
3.1. Regression Estimator for the cluster sampling
The regression estimator is an estimate that is often considered along with the ratio estimator when there is auxiliary information on the population level. Unlike the ratio estimator, the regression estimator can be defined when there are multiple auxiliary variables, and the efficiency of the regression estimator is determined by the linear relationship between the auxiliary variables and the variables of interest. The regression estimator defined under the cluster sampling design is often considered as an efficient estimator than the unbiased HT estimator[8,10].From these various model assumptions, the generalized regression estimator can be derived as follows. The population elements
is divided by the cluster as .
In addition, suppose that the supplementary information of cluster unit is available as PSU level auxiliary variable for the primary sampling unit.
.
Also, we defined the 1st and 2nd inclusion probabilities of the cluster under the sampling design as
. (3.1) For the level of an auxiliary information, we assume that auxiliary variable can be observed for the sampled cluster and is true value and it is available in the estimation procedure. Under these assumptions for the PSU and population level of auxiliary information, we consider the population model for of the numbers of .
(3.2)
where is independent under this model assumption and if the number in the population are available, then the population regression coefficient is given
. (3.3) Under the model (3.2), the regression coefficient estimator based on the sample is
. (3.4)
where .
Then the regression estimator for the population total is
, (3.5)
where is given in (3.4).
Also, the variance estimator for the regression estimator (3.5) is
, (3.6)
where is the population difference, and its
estimator is
, (3.7)
where is the sample difference and is
g-weight for th PSU which given by
. (3.8)
3.2. Regression Estimator for the adaptive cluster sampling
In order to derive the regression estimator of the adaptive cluster sample, we assume that the population distribution isthe same as model (3.2),
.
From (2.4) initial sample size is and the intersection probability of th network with the number of sampling unit in th network is given by
,
and the joint probability of th and th network is
.
Then the proposed regression estimator of the population total which replaced the inclusion probability with the intersection probability for adaptive cluster sampling is
, (3.9)
where .
Also, we can derive the variance estimator for is
, (3.10)
and its estimator is
, (3.11)
Wher where and
.
3.3. Typical estimation for an adaptive cluster sampling
In order to apply the adaptive cluster sampling, first of all, the rare plants which are naturally grown in Gyeongju National Park were consulted by landscape experts and we decided to survey for Pedicularisishidoyana Koidz. & Ohwi. According to the expert device, it appears that the plants grow mainly valleys with 107~494 meter above sea level and 5~20 degree of inclination. Figure3 shows (a) the picture of
Pedicularisishidoyana Koidz. & Ohwi, and (b) and (c) are the survey plots in Gyeongju National Park.
(b) First survey plot
[image:4.595.116.236.48.274.2](c) Second survey plot
Figure 3. Picture for Pedicularisishidoyana Koidz. & Ohwi in Gyeongju National Park
[image:4.595.67.281.348.492.2]The grid of the survey area was originally set to 2 × 2 km, but it has been redesigned to 200 × 200(m) for this study. As shown in Figure 4, the distribution of Pedicularisishidoyana Koidz. & Ohwi have shown in two survey plots.
Figure 4. Distribution of Survey Plot #39thin Gyeongju National Park
Figure. 5 shows an initial sample of by simple
random sampling from and then an adaptive
cluster sampling step that sequentially enumerates the neighboring individuals with the surveyed individuals from the selected initial population sample.
(a) Initial samples
(b) Sample clusters
(c) Final adaptive cluster sample(where yellow color means the network)
Figure 5. Adaptive cluster sampling of Survey Plot #39thin Gyeongju National Park
From Figure 5, in order to estimate for adaptive cluster sample we have been observed the initial sample
,and , in first network, ,
in second network, and otherwise , .
Also, we can calculate the initial intersection probabilities are, for the first network
,
and for the second network
,
and for
.
In addittion to, we can define the joint intersection
probabilities as , with
Using thses values, we can estimate the population total of Pedicularisishidoyana Koidz. & Ohwi in Gyeongju National Park as
,
. Finally we can obtain the 95% confidence interval for the populatopn total from adaptive cluster sampling to the
Pedicularisishidoyana Koidz. & Ohwi in Gyeongju National Park is
3.4. Regression estimation for an adaptive cluster sampling
In this subsection, we consider the regression estimator for an adaptive cluster sampling using an auxiliary information which has strong correlation with the variable of interest. To do this, we will use data which observed in the subsection 4.1 as the cluster population is composed of size and the initial sample is selected with size of , and then we have been observed the survey object using the adaptive cluster sampling. In this step we generate that an auxiliary variable which are correlated with the variable of interest, ( ), are observed in the survey plot as shown in Table 1.Assume that the population total of auxiliary variable in this study area is known as . Table 2 shows the
proposed regression
[image:4.595.127.223.579.781.2]Table 1:Observed values of the variable of interest and an auxiliary variable for two networks
Networks Variables 1 2 3 4 5 6 7 8 9 10 11 Total
1st Network 1 3 1 2 7 4 1 12 6 3 3 43
10 10 10 10 16 15 10 18 20 10 11 140
2nd Network 4 11 9 7 4 3 - - - 38
10 20 20 15 15 10 - - - 90
Table 2: Comparison between the original adaptive estimate and the proposed estimate
Population Total Estimate Variance Estimate 95%lowerlimit 95%upperlimit RE
Original
estimate( ) 94.6 604.5 -3.74 192.95
6.86 Regression
Estimate( ) 89.2 88.1 51.56 126.74
IV.CONCLUSION
This paper proposed the regression estimator of an adaptive cluster sampling for the investigation of rare and clustered objects. The advantage of the regression estimator is that it can improve the degree of the estimator by using the available ancillary information in the estimation process. From this point of view, this paper applied the adaptive cluster sampling method to estimate of the population total for the domestic native plant, Pedicularisishidoyana Koidz. & Ohwi, and compared the efficiency by applying the regression estimator to improve the efficiency of the estimator. In section 4, we find the proposed estimator is more efficient than the original adaptive estimator in the relative efficiency (:RE) of about 6.86 times. In addition, for the 95% confidence interval of the estimates, it is logically appropriated intervals were estimated for the proposed estimation method.
ACKNOWLEDGMENT
This research was supported by Basic Science Research Program through the National Research Foundation of Korea
(NRF) funded by the Ministry of Education
(2017R1D1A3B03034902).
REFERENCES
1. Thompson SK, Seber GAF. Adaptive Sampling. John Wiley & Sons, Inc.,
New York ; 1996, p.265.
2. Thompson SK. Sampling. John Wiley & Sons, Inc., New York; 1992, p.
339.
3. Thompson, SK. Adaptive cluster sampling. Journal of the American
Statistical Association.1990 Dec;85(412): 1050-59.
4. Dyver L, Thompson SK. Improved unbiased estimators in Adaptive cluster
sampling, Journal of Royal Statistical Society, Series B.
2005;67(1):157-66.
5. Philip T, John JB. A review of adaptive cluster sampling. Environmental
and Ecological Statistics. 2005; 12:55-94.
6. Philppi T. Adaptive cluster sampling for estimation of abundance within
local populations of low-abundance plants. Ecology. 2005; 86(5); 1091-1100.
7. GoldBerg NA, Heine JN, Brown JA. The application of adaptive cluster
sampling for rare subtidal macroalgae. Mar Biol. 151, 1343-48. DIO:10.1007/s00227-006-0571-2.
8. Cochran WG. Sampling Techniques, 3rd ed. New York: Wiley; 1977.
9. Felix Medina MH. Analytical expressions for Rao-Blackwell estimators in
adaptive cluster sampling. Journal of Statistical Planning and inference. 2000 Mar; 84(1):221-36.
10. Sarndal, CE, Swensson, B, Wretman, J. Model Assisted Survey
Sampling.Springer, New York;1992, p.265.
11. Smith DR, Conroy MJ,Brakhage DH. Efficiency of adaptive cluster
sampling for estimating density of wintering waterfowl.Biometrics.1995 Jun;51(2):777-88.
12. Brown JA. Designing an efficient adaptive cluster sample. Environmental
and Ecological Statistics.2003; 10: 95–105.